

Introduction
In recent years, China’s proven hydrocarbon reserves in volcanic rocks have accounted for approximately 53% of the world’s total proven hydrocarbon reserves [1-8]. Consequently, the Junggar Basin has emerged as a primary focus for the exploration of volcanic oil and gas reservoirs in western China. However, volcanic rock reservoirs are characterized by highly diverse lithofacies, complex pore structures and mineral compositions. These features pose significant challenges to reservoir prediction and evaluation, thereby constraining the efficient exploration and development of such reservoirs [9-13]. Fracturing and acidizing technologies are key methods in the development of unconventional oil and gas resources, as they effectively remove flow blockages, enhance injectivity and production, and have been widely applied in recent years [14-16]. However, the erosion mechanisms governing pore-structure evolution in volcanic rock reservoirs before and after acidification remain poorly understood, and the processes of acid imbibition and H+ diffusion are highly complex. The application of fracturing and acidizing technologies in volcanic reservoirs remains challenging at present.
During the fracturing and acidizing process, complex physicochemical interactions occur between the acid solution and the rock, resulting in mineral dissolution and precipitation. These processes ultimately alter the micropore structure and influence fluid flow behavior. The appropriate selection of acid solution can effectively remove pore blockages and significantly enhance the permeability of the core matrix [17]. Studies on the effects of acid solution immersion on the microstructure of volcanic rocks have shown that acid solution-rock chemical reactions predominantly affect the contents of carbonate and clay minerals [18]. Most carbonate minerals react rapidly with acid solutions, leading to the dissolution of pores and small-scale laminated fracture structures, thereby significantly disrupting the accumulation form of mineral particles [19]. When the acid solution contacts with fracture surfaces, erosion reactions occur, resulting in the removal of loosely bonded blockages and erosion products from pore and fracture walls [20]. Meanwhile, the acid solution dissolves inorganic minerals that block fractures, thereby enhancing the connectivity between pore spaces and fracture networks [21]. Therefore, the acid erosion effect can not only remove pore and fracture blockages but also effectively interconnect the dual media of pores and fractures, thereby enhancing overall pore-structure connectivity.
Acid solution-rock interactions influence the seepage capacity of fluids within the pore structure to a certain extent. The seepage behavior of acid solutions is controlled by multiple factors, including the lithology of volcanic rocks, mineral composition, temperature and pressure conditions, and pore types (e.g., water-rich and oil-rich pores) [22-23]. Volcanic rocks of different lithologies exhibit pronounced variations in mineral composition. The dissolution extent of soluble minerals significantly influences the intensity of acid imbibition and the rate of ion diffusion within the rock matrix [24]. Following the dissolution of clay minerals by the acid solution, internal microfractures expand, thereby enhancing the seepage capacity of the pore structure [25]. Zhang et al. introduced a cooling effect into the fracturing fluid using rock-plate supports and found that a decrease in temperature inhibits the diffusion efficiency of H+ in the acid-rock reaction system [26]. Notably, significant differences exist in the acid solution migration mechanisms within water-rich and oil-rich pores of volcanic rocks, with H+ ion diffusion and imbibition constituting the dominant migration modes, respectively [27-29]. Irannezhad et al. pointed out that the varying proportion of water-wet to oil-wet zones in porous micromodels leads to significant differences in pore-scale fluid flow patterns under different wettability ratios [30].
As described above, volcanic rock reservoirs have strong heterogeneity, making it difficult for crude oil to be distributed continuously in large patches, which leads to significant differences in the migration patterns of acid solution in the water-rich and oil-rich pores of volcanic rocks. At present, for volcanic rocks of different lithologies, the evolution of pore structures before and after acid solution remains poorly understood, and studies on the mechanisms of acid imbibition in oil-rich pores and ion diffusion in water-rich pores are still relatively limited. Therefore, this work takes Carboniferous volcanic rock cores from the Junggar Basin as the research object. The evolution of pore structure and mineral composition in volcanic rocks of different lithologies under acid solution-rock interactions was systematically investigated. It further elucidated the migration characteristics of ion diffusion in water-rich pores and acid imbibition in oil-rich pores. The research results can provide theoretical guidance and technical support for the design of fracturing and acidizing technologies in volcanic oil reservoirs.
1. Experiment introduction
1.1. Experimental samples
This experiment takes four types of volcanic rocks in the Carboniferous system of the Junggar Basin as the research objects, including breccia, andesite, tuff and dacite. The downhole core samples were prepared as 25 mm×40 mm plunger specimens using wire-cutting technology. Physical property testing and analysis revealed that the porosity values of the cores range from 6.42% to 7.83%, while the permeability is (0.129 5-0.389 0)×10-3 μm2. To remove residual oil from the samples, they were washed with petroleum ether for 21 days and then dried in a drying oven until their mass remained constant.
1.2. Experimental designs
Volcanic rock reservoirs exhibit strong heterogeneity, which hinders the continuous distribution of crude oil. Additionally, there are significant differences in the acid solution migration mechanisms between water-rich and oil-rich pores. In oil-rich pores, the acid solution needs to overcome the resistance of the oil phase through imbibition action to invade the pore structure and initiate acid erosion reactions. In water-rich pores, formation water dilutes the acid solution, which in turn affects the diffusion path of H+. Additionally, the temperature and pressure conditions of the formation can influence the kinetics of acid solution-rock reactions. To investigate the differences in migration mechanisms of acid solution between water-rich and oil-rich pores in volcanic rocks of varying lithologies, as well as the impact of temperature and pressure, three sets of comparative experiments were conducted. The experimental designs are detailed in Tables 1 to 3.
Table 1. Experimental design for acid immersion in water- rich pores of volcanic rocks with different lithologies |
| SN | Lithology | Sample status | Type of acid solution | Porosity/ % | Permeability/ 10-3 μm2 |
|---|---|---|---|---|---|
| A1 | Breccia | Saturated with water | 10%HCl+1% HF | 7.62 | 0.318 5 |
| A2 | Dacite | Saturated with water | 10%HCl+1% HF | 6.42 | 0.129 5 |
| A3 | Andesite | Saturated with water | 10%HCl+1% HF | 7.23 | 0.389 0 |
| A4 | Tuff | Saturated with water | 10%HCl+1% HF | 7.35 | 0.293 5 |
Note: The experimental temperature is 25 °C and the pressure is 0.1 MPa. |
Table 2. Experimental design for acid immersion in oil- rich pores of volcanic rocks with different lithologies |
| SN | Lithology | Sample status | Type of acid solution | Porosity/ % | Permeability / 10-3 μm2 |
|---|---|---|---|---|---|
| B1 | Breccia | Saturated with oil | 10%HCl+1% HF | 7.83 | 0.331 2 |
| B2 | Dacite | Saturated with oil | 10%HCl+1% HF | 6.53 | 0.140 2 |
| B3 | Andesite | Saturated with oil | 10%HCl+1% HF | 7.26 | 0.386 2 |
| B4 | Tuff | Saturated with oil | 10%HCl+1% HF | 7.36 | 0.287 3 |
Note: The experimental temperature is 25 °C and the pressure is 0.1 MPa. |
Table 3. Experimental design of acid immersion in oil-rich pores of andesite under different temperature and pressure conditions |
| SN | Lithology | Sample status | Type of acid solution | Temperature/°C | Pressure/ MPa |
|---|---|---|---|---|---|
| C1 | Andesite | Saturated with oil | 10%HCl+ 1% HF | 70 | 30 |
| C2 | Andesite | Saturated with oil | 10%HCl+ 1% HF | 80 | 30 |
| C3 | Andesite | Saturated with oil | 10%HCl+ 1% HF | 90 | 30 |
1.3. Experimental methods
1.3.1. Acidification experiment
Based on the field process of volcanic rock fracturing and acidizing, the volcanic rock samples were treated with a composite acid solution containing 10 % HCl and 1 % HF: (1) The volcanic rock samples were placed in vacuum-treated containers and saturated with water or oil. (2) After the volcanic rock samples had been saturated, transferred them to a polytetrafluoroethylene (PTFE) acid-resistant container, then injected the pre-prepared composite acid solution into the container to fully immerse the rock samples, ensuring complete contact at the reaction interface. (3) Placed the container in the fume hood until the acidification was complete (when the T2 spectrum signal became stable), and repeatedly washed the samples with anhydrous ethanol to terminate the acid solution-rock reaction and removed the residual acid solution on the surface.
1.3.2. Characterization of mineral composition and pore structure
Three analytical methods were used to characterize the volcanic rock samples before and after acidification, including XRD, SEM and NMR. This work focused on the changes in pore structure, mineral composition, and fluid utilization capacity of the volcanic rocks before and after acidification.
XRD technology can determine the types and contents of rock minerals by analyzing the X-ray diffraction patterns of mineral samples. First, placed the volcanic rock samples to be tested in an agate mortar for mechanical crushing treatment to ensure that the particle size is less than 75 μm (200 mesh). Subsequently, a continuous scanning mode was employed to collect diffraction data in order to determine the types and relative mineral content. X-ray scans were conducted on the volcanic rock samples before and after acidification, and the evolution law of the mineral composition during the acidification process was then compared and analyzed.
SEM technology can provide high-resolution images, making it suitable for observing and analyzing the two- dimensional pore structure of volcanic rock thin-section samples and the erosion effects of acid solutions. The obtained images can reveal the surface morphology and changes in pore structure of the volcanic rocks. Based on SEM observations, the surface dissolution conditions at different scales (1 mm, 500 μm, and 50 μm) before and after acid immersion were analyzed, and the dissolution characteristics of volcanic rocks at different observation scales were further evaluated.
Before the NMR test, the volcanic rock samples were fully saturated with water or oil, and the T2 spectrum was used to directly reflect changes in pore size and distribution. During the acid solution immersion process, NMR tests were conducted at intervals. During the measurements, the core was wrapped in cling film to minimize the influence of air on the test results. When the T2 spectrum signal stabilizes, it indicates that the acid solution-rock erosion reaction has reached dynamic equilibrium. The average time required to achieve dynamic equilibrium in the same set of experiments is considered the equilibrium time of the acid solution-rock reaction.
2. Results and analysis
2.1. Evolutionary characteristics of mineralogy and pore structure
2.1.1. Changes in the mineral composition
The changes in the mineral composition of volcanic rocks with different lithologies before and after acidification are shown in Fig. 1. The initial mineral composition of the four types of volcanic rocks is predominantly composed of quartz and plagioclase. At the same time, certain lithological differences are presented. Specifically, a small amount of hematite is present in the breccia and tuff. The calcite content in breccia is significantly higher than in the other three lithologies, and the proportion of clay minerals in andesite is relatively prominent. In the acidification reaction, clay minerals, calcite, and hematite are the primary reactive minerals. Moreover, there are differences in the types of highly active minerals among different lithologies. Calcite in breccia exhibits the strongest reactivity with the acid solution, and its proportion decreases by 13.7 percentage points after acidification. The clay minerals in andesite exhibit the strongest reactivity with acid solutions, with their proportion decreasing by 18 percentage points after acidification. However, during the acidification reaction of dacite and tuff, the differences in the reactivity of acid solution among the various mineral components are relatively small, and there is no significant preferential reaction. The fluctuation in the content of various minerals is also relatively minor.
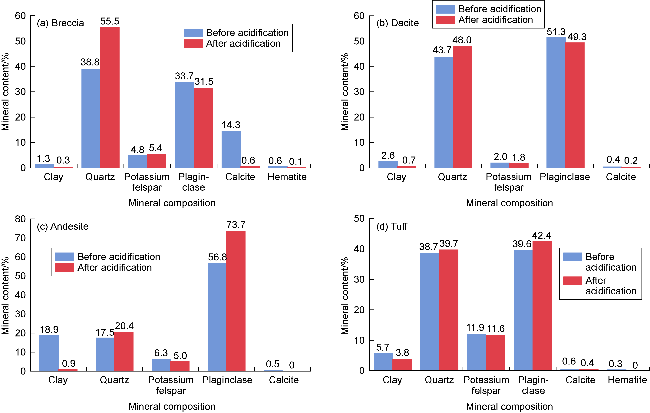
Fig. 1. Changes in mineral composition of volcanic rock samples of different lithologies before and after acidification. |
2.1.2. Changes in the pore structure
Based on tuff samples with characteristic vesicles, the dissolution patterns of the acid solution on the surface microscopic pore structure were observed and analyzed at three different scales (millimeters, hundreds of micrometers, micrometers) using SEM (Fig. 2). Before acidification, the pores were mainly vesicles. The dissolution effect of acid solution has a significant effect on pore expansion and enhancement of pore-fracture connectivity. At the millimeter scale, the roughness of the vesicle edges increases significantly, and the porosity values rise from 9.51% to 15.31%. It indicates that new secondary pores were formed by acid solution. At the scale of hundreds of micrometers, the acid solution has a significant dissolution effect on the boundaries of tuff fractures. On the one hand, the erosion depth of the primary vesicles has significantly increased, and the pore volume has expanded. On the other hand, the primary connecting fractures between pores expand, eliminating the blockage of seepage channels and forming a more continuous pore-fracture network. At the micron scale, a significant dissolution phenomenon of hematite was observed, forming concaves at the dissolution sites. At the same time, numerous distinct secondary pits were formed on the rock surface, further increasing the distribution density of micron-scale pores. Among the other three types of lithologies, the highly active minerals (calcite, clay minerals) in breccia and andesite are preferentially dissolved to form concaves, expanding the distribution range of surface pore structures and simultaneously enhancing the connectivity between pores. The content of highly active minerals in dacite is relatively low, and the reactivity differences among various minerals are not significant. After erosion, only a few dispersed pits can be observed.
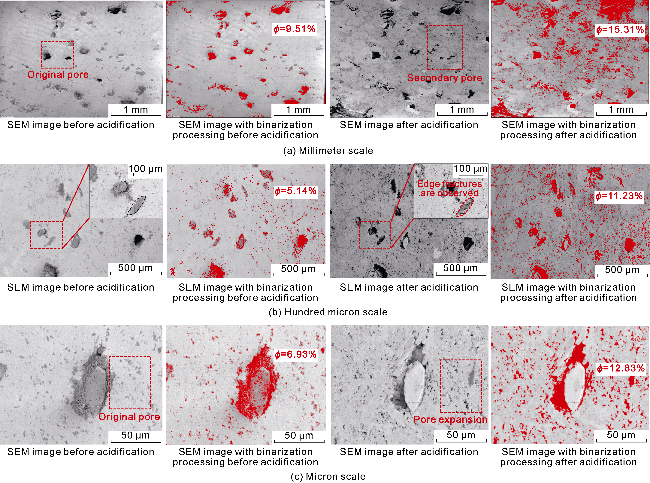
Fig. 2. Surface pore changes of tuff samples at multiple scales before and after acidification. |
2.2. Migration characteristics of acidic ions in water-rich pores
2.2.1. Analysis of NMR T2 spectra
The water-rich pores in volcanic rocks are primarily filled with the water phase. After the acid solution enters, it mixes with the water phase, forming a continuous aqueous phase system without interfacial tension hindrance. At this point, the migration of the acid solution is primarily driven by H+ diffusion. From the perspective of T2 spectral response, the acid erosion effects of the four types of samples all show a significant increase in the amplitudes of the medium and small pores (Fig. 3). However, there are significant differences in the T2 spectral evolution patterns among different lithologies. During the peak changes of T2 spectra of breccia and andesite before and after acidification, the increase in the amplitude of medium and small pores is the main factor. However, the peak values of T2 spectra of dacite and tuff fluctuate significantly in the horizontal direction.
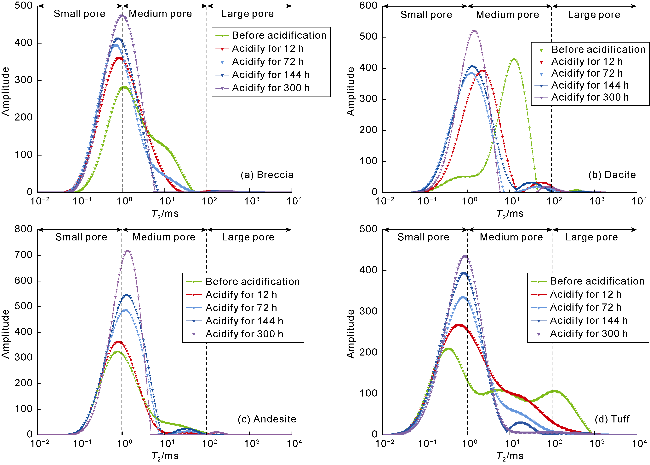
Fig. 3. T2 spectra of water-rich pores in volcanic rocks of different lithologies before and after acidification. |
Breccia and andesite exhibit better pore connectivity, high H+ diffusion efficiency, and rapid migration of the dissolution products with the water phase. The peak value of the T2 spectrum shows a significant increase in the amplitude of medium and small pores, without notable fluctuation in the horizontal direction. The acidification process has a minimal dissolution effect on the primary pores, primarily forming secondary medium and small pores through erosion. This suggests that the diffusion of H+ within the primary pores is stronger, with a short retention time and a wider diffusion range. Dacite and tuff exhibit a decrease in the proportion of medium and large pores, accompanied by an increase in the proportion of small pores. The microscopic heterogeneity of volcanic rocks directly results in a reduction in the continuity of H+ diffusion. The mineral particles produced by dissolution are difficult to migrate effectively and tend to accumulate, obstructing the pore throat. After being blocked, the medium and large pores are segmented into smaller pores, resulting in a decrease in the proportion of medium and large pores and a corresponding increase in the proportion of small pores.
2.2.2. Analysis of MRI
As shown in Fig. 4, both the signal distribution range and signal intensity in the MRI of volcanic rock samples from the four lithologies increased after acidification. It indicates that the acid erosion process is mainly characterized by H+ diffusion erosion. Following acid erosion, the development degree of the seepage channels within the cores is significantly improved, fluid flow capacity is improved and the effective swept range is substantially expanded. The fluid occurrence characteristics in the cores of different lithologies exhibit significant differences after acid erosion. The calcite content in breccia is relatively high, with a calcite cementation zone developed in the center of the core. During the acidification process, the reactivity in this area is relatively high, accompanied by significant gas release. The high-value region of the NMR signal extends along the calcite bands, and the occurrence of fluids in this region increases significantly. The pore heterogeneity of dacite and tuff is relatively high, and the degree of pore connectivity varies across different regions, leading to spatial differentiation in the enrichment degree during the H+ diffusion process. As a result, the NMR signal intensity in the core after acid erosion exhibits a non-uniform distribution. Among them, the occurrence of fluids within dacite exhibits a local enrichment pattern. Tuff mainly expands due to erosion along the characteristic pores, and the fluid content within the vesicles/amygdaloidal pores increases significantly. Andesite demonstrates better pore connectivity, with even H+ diffusion. More seepage channels are distributed in the right area, and the overall phenomenon displays uniform lateral expansion.
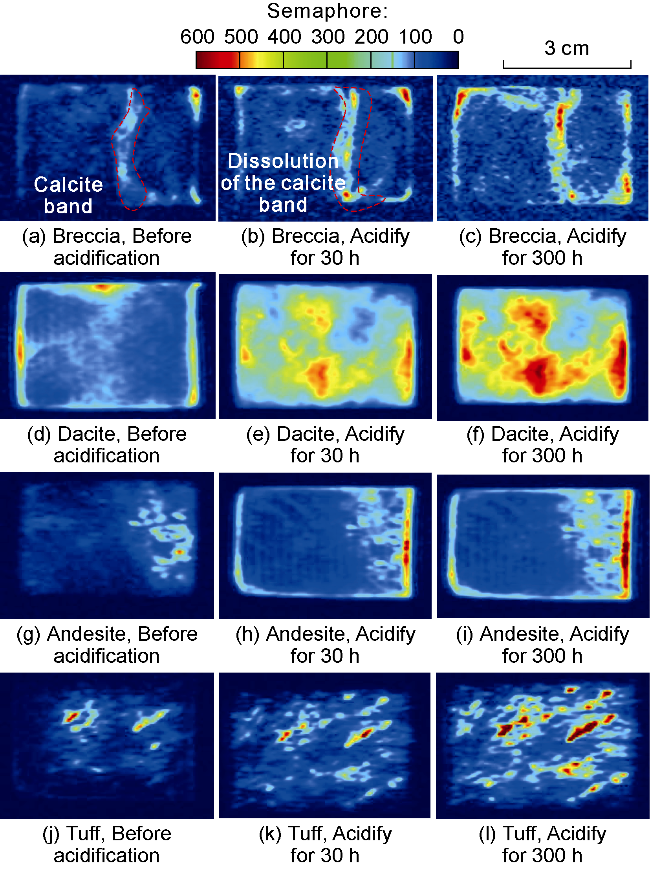
Fig. 4. The MRI of water-rich pores in volcanic rocks of different lithologies before and after acidification. |
2.3. Characteristics of acid imbibition in oil-rich pores
2.3.1. Analysis of NMR T2 spectra
In oil-rich pores, the migration of the acid solution is primarily driven by imbibition. Under the influence of capillary pressure, it overcomes the resistance of the oil film and enters the pores, where it reacts with the minerals. The evolution of the T2 spectrum induced by acid imbibition primarily follows two patterns (Fig. 5): Breccia and tuff are primarily characterized by a rightward shift and broadening of spectral peaks, indicating pore expansion dominated by the erosion driven by acid imbibition. In contrast, for dacite and andesite, the spectral peaks primarily narrow, indicating the enrichment of small pores and the homogenization of pore structure caused by the erosion driven by acid imbibition. Breccia contains a high content of calcite minerals. After the acid solution enters the pores via imbibition, it rapidly dissolves the carbonate minerals under the action of high-concentration acidic ions, expanding along the pore walls and gradually converting small pores into medium pores. Under the erosion driven by acid imbibition, some primary vesicles in tuff gradually connect with secondary pores. The pore structure within dacite exhibits a locally concentrated distribution. After the acid solution enters the pores via imbibition, it selectively dissolves the minerals. The resulting mineral particles tend to accumulate and obstruct the pore throats, splitting them into smaller pores. The primary pores of andesite are mainly medium and small pores, and the connectivity between the pores is relatively high. After uniform imbibition of the acid solution, erosion occurs along the pore walls, leading to a continuous increase in the number of small pores and a more uniform pore size distribution.
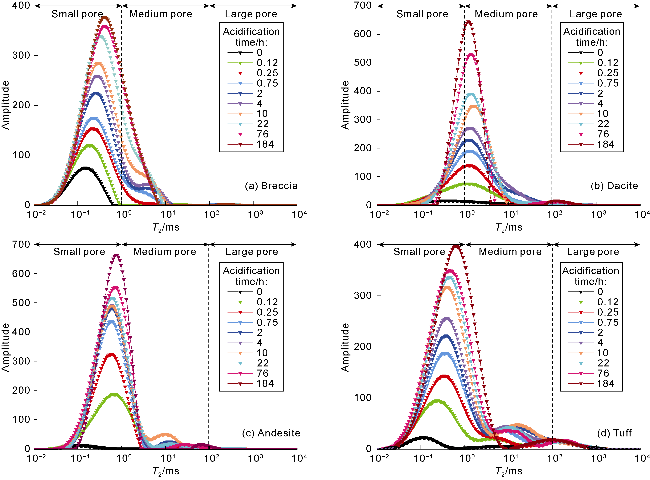
Fig. 5. T2 spectra of oil-rich pores in volcanic rocks of different lithologies before and after acidification. |
The fluctuations in the T2 spectral area and the horizontal displacement of the peak for andesite of water-rich/oil-rich pores are relatively small before and after acidification, indicating a low influence of pore enrichment type. Therefore, acid immersion experiments were further conducted on andesite under high temperature (70-90 °C) and high pressure (30 MPa) to investigate the acid imbibition law under different temperature and pressure conditions. The experimental results are presented in Fig. 6. Under temperature conditions of 70- 90 °C, the T2 spectral peaks of andesite after acidification showed a significant increase, and the spectral area expanded notably (Fig. 6a). This indicates that acid erosion under high temperature and pressure conditions led to significant pore expansion. As temperature increases, the imbibition effect of the acid solution intensifies, and the effective duration of erosion is significantly extended, further enhancing the extent of pore expansion. From the evolution of the total peak area of the T2 spectrum (Fig. 6b), it can be observed that at 70 °C, the growth of the total peak area of the T2 spectrum stabilizes after 10 h of acidification, indicating that the imbibition and erosion process of the acid solution reaches dynamic equilibrium relatively quickly. As the temperature increases, the duration of the growth of the total peak area of the T2 spectrum is significantly prolonged, with the increase gradually expanding. This indicates that the rise in temperature not only enhances the kinetic rate of the acid solution-rock reaction and intensifies mineral dissolution efficiency, but also increases the imbibition capacity of acid solution in oil-rich pores. This allows the acid solution to overcome the oil phase obstruction, continuously diffuse into deeper pores, and promote the acid erosion reaction.
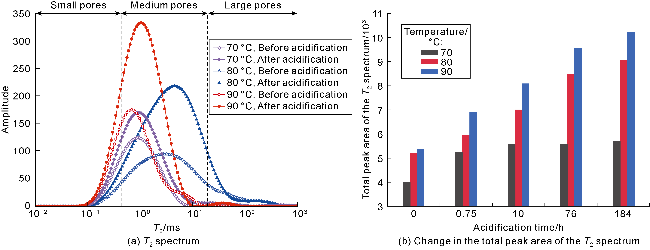
Fig. 6. Changes in the total peak area of T2 spectra of oil-rich pores in andesite before and after acidification under different temperature and pressure conditions. |
2.3.2. Analysis of MRI
The magnetic resonance imaging (MRI) of oil-rich pores in volcanic rocks of different lithologies, before and after acid imbibition at normal temperature and pressure, is shown in Fig. 7. The patterns of acid imbibition and migration in the oil-rich pores of volcanic rocks across different lithologies exhibit significant differences. Breccia, dacite, and andesite are primarily dominated by dispersed pores. In the early stage, the acid solution overcomes the resistance of the oil film. During the intermediate stage, the imbibition and erosion range expands uniformly. In the final stage, distinct imbibition and erosion channels are established, leading to a significant increase in fluid occurrence. The characteristic pores (vesicles and amygdaloidal pores) in tuff are well developed. The development orientation of these pores significantly influences the imbibition process. Its complex and isolated vesicle structure results in a lack of an obvious directional path for imbibition, making it difficult to form a stable dominant path during the acid imbibition process.
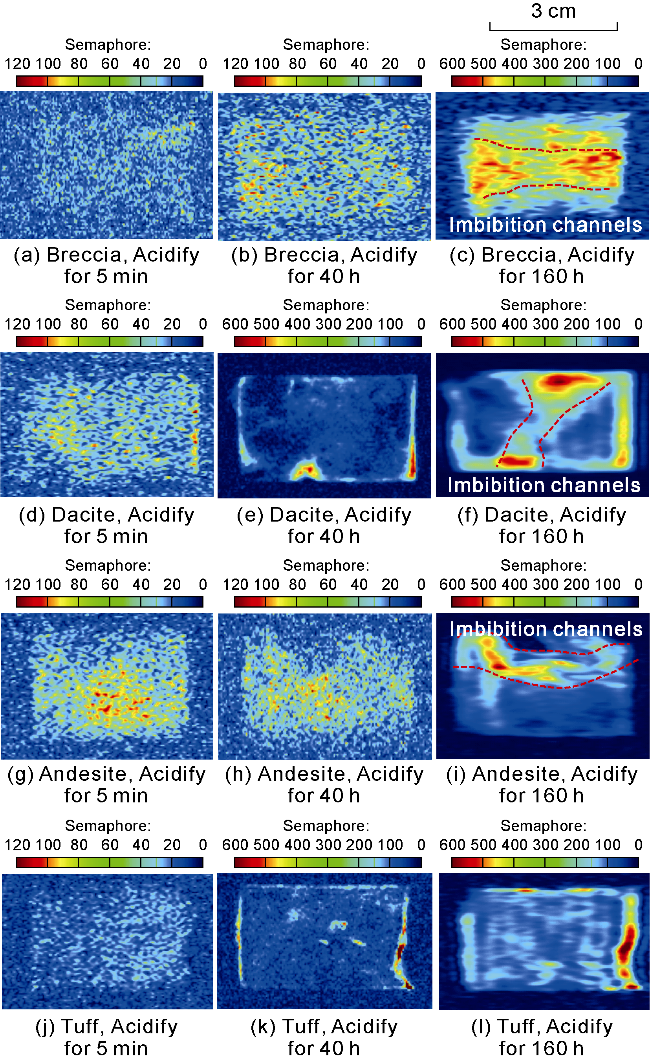
Fig. 7. The MRI of oil-rich pores in volcanic rocks of different lithologies before and after acidification at normal temperature and pressure. |
The MRI of oil-rich pores before and after acid imbibition under high temperature and pressure in andesite is shown in Fig. 8. High-temperature and high-pressure conditions enable the acid solution to rapidly overcome the combined constraints of oil film resistance and pore structure, thereby significantly enhancing the imbibition intensity and erosion effect of the acid solution. At a temperature of 70 °C, the acid solution-rock reaction rate is relatively low, which leads to a weaker degree of core erosion and a limited erosion range. As the temperature rises to 80 °C, the imbibition intensity and the efficiency of acid solution-rock reaction increase. The contact between the acid solution and the rock matrix becomes more thorough, and the erosion range expands significantly. When the temperature reaches 90 °C, both the imbibition intensity and erosion effect are markedly enhanced, resulting in the formation of concentrated high-signal regions within the core due to locally intense erosion.
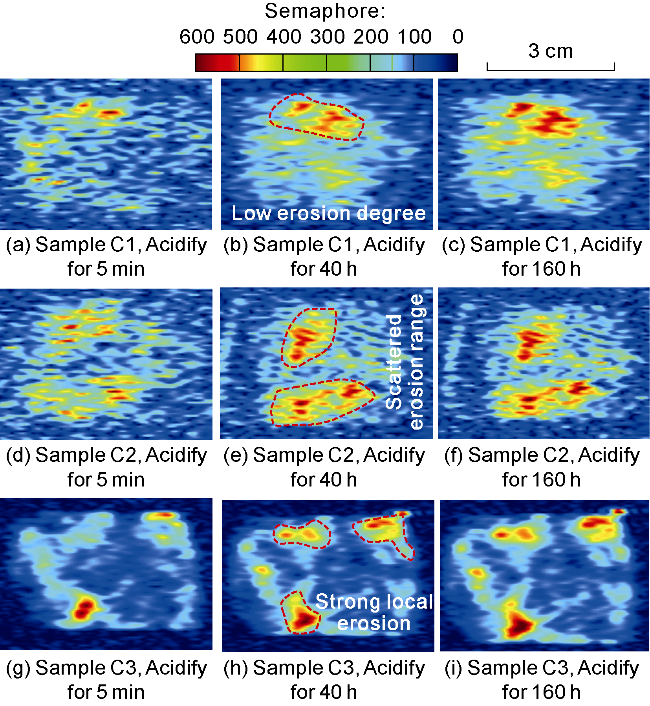
Fig. 8. The MRI of oil-rich pores in andesite before and after acidification under high temperature and pressure. |
2.4. Correlation between H+ diffusion and acid imbibition
2.4.1. Erosion law of H+ diffusion and acid imbibition
As shown in Fig. 9, the T2 spectral peak areas before and after acidification of water-rich pores in volcanic rocks of different lithologies were quantitatively analyzed. H+ uniformly diffuses into large, medium, and small pores. After acid erosion, all lithologies show an increase in the total peak area of small pores and a decrease in the total peak area of medium and large pores. However, influenced by the reactivity of mineral components and the original pore structure, the diffusion efficiency and reaction intensity of H+ vary significantly among different lithologies. Consequently, the four lithologic types of volcanic rocks exhibit distinct pore erosion characteristics. Breccia and andesite are primarily characterized by medium and small pores, with a mineral composition rich in highly reactive and soluble minerals such as calcite and clay. H+ can diffuse efficiently and react with these minerals, promoting the continuous erosion and expansion of medium and small pores. This ultimately results in a significant expansion of the pore structure, with the total peak area of the T2 spectrum increasing by 30.4% and 61.5%, respectively. The matrix minerals of dacite and tuff are mainly quartz and plagioclase, with relatively low reactivity, limiting the rate and extent of the acidification reaction. H+ tends to locally concentrate in large pores, with a reduced diffusion range, and the reaction products are likely to precipitate and accumulate within the pores. As a result, the increase in total porosity is relatively small, with the total peak area of the T2 spectrum increasing by only 17.1% and 6.7%, respectively.
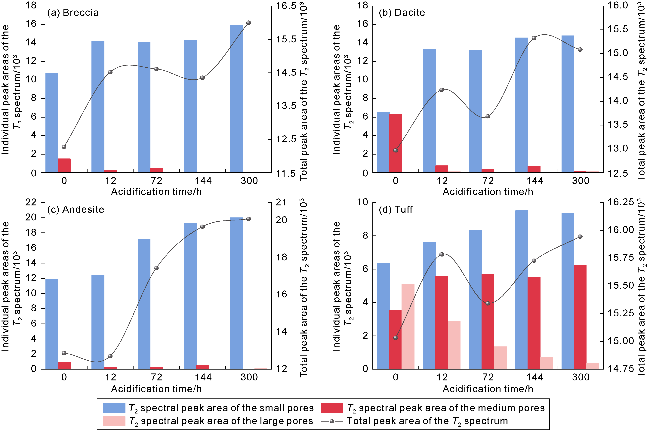
Fig. 9. Total peak area and individual peak variations in the T2 spectrum during acidification of water-rich pores in volcanic rocks of different lithologies. |
Fig. 10 shows the evolution curves of T2 spectral peak areas during the acidification process of oil-rich pores in volcanic rocks of different lithologies. The acidification of oil-rich pores is primarily driven by acid imbibition, and its imbibition intensity is influenced by both pore size and matrix minerals. The capillary pressure in small pores is higher, causing the acid solution to preferentially imbibe into the small pores. In contrast, the capillary pressure in medium and large pores is relatively lower, making acid imbibition more difficult. As a result, all four lithologies exhibit a significant increase in the T2 spectral peak area of small pores, with only a slight change in the spectral peak area of medium and large pores. Notably, the T2 spectral peak area of small pores in andesite showed a significant sudden increase during the early stage of acidification (0-0.75 h). This is because andesite has a relatively high content of clay minerals and a relatively homogeneous pore structure. The high reactivity of clay minerals provides a chemical driving force for acid imbibition, while the homogeneous pore structure reduces imbibition resistance, leading to a rapid increase in imbibition intensity and erosion efficiency during the early stage of acidification. However, the total peak area of the small-pore T2 spectra in breccia, dacite, and tuff exhibits a uniform growth trend with acidification time, reflecting a stable imbibition characteristic.
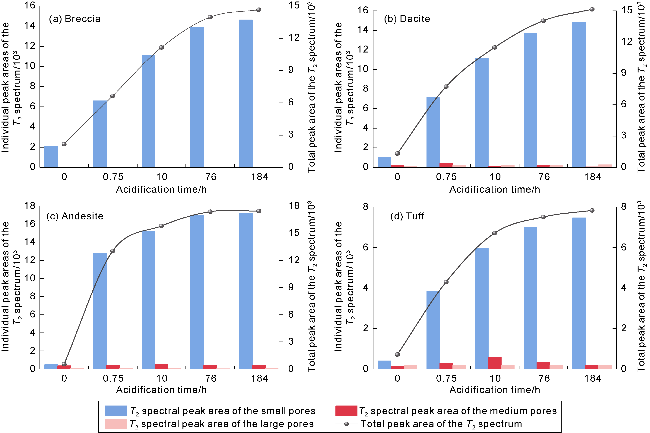
Fig. 10. Total peak area and individual peak variations in the T2 spectrum during acidification of oil-rich pores in volcanic rocks of different lithologies. |
2.4.2. Mechanisms of H+ diffusion and acid imbibition
$\lg W=(3-D) \lg T_{2}+(D-3) \lg T_{2 \max }$
Fig. 11 shows the statistical results of the fractal dimension. It can be observed that there are significant differences in the evolution patterns of water-rich and oil-rich pores. In water-rich pores, H+ diffuses through the continuous water medium, driving a certain degree of erosion in large, medium, and small pores. The total fractal dimension (DN) of the four lithologies exhibits a decreasing trend. The DN1 of tuff increases after acidification, which is attributed to the poor connectivity of its original pores, limiting the migration of dissolution products. Moreover, the retained sediment accumulates on the vesicle surfaces, increasing their roughness and structural complexity. The DN1 of the other lithologies shows varying degrees of decrease, indicating that acid erosion reduces the complexity of the pore structure.
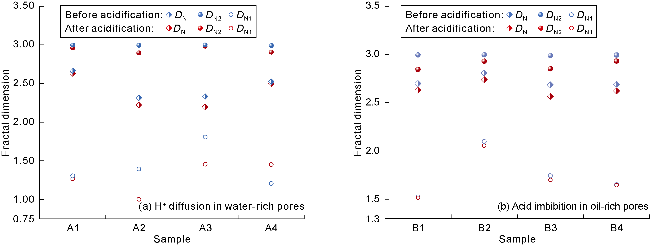
Fig. 11. Fractal dimension analysis of H+ diffusion in water-rich pores and acid imbibition in oil-rich pores of volcanic rocks. |
In oil-rich pores, the acid imbibition process is controlled by the capillary pressure gradient and preferentially advances along the small-pore channels with higher capillary pressure. Due to the relatively weak capillary pressure in medium and large pores, the degree of erosion is significantly delayed. After acid imbibition and erosion, the variation range of the total fractal dimension (DN) of breccia, dacite, and tuff is relatively small, remaining at a consistently higher level. However, the DN of andesite shows a significant decreasing trend. This is attributed to the high content of reactive clay minerals in andesite and its dense, homogeneous pore structure. More intense mineral dissolution reactions significantly improve pore connectivity and further enhance the capillary-driven imbibition force. This promotes the acid solution to overcome imbibition resistance, resulting to substantial matrix erosion. Ultimately, this drives the pore structure toward higher simplicity and homogenization, resulting in a significant decrease in fractal dimension.
2.4.3. Correlation analysis of H+ diffusion and acid imbibition
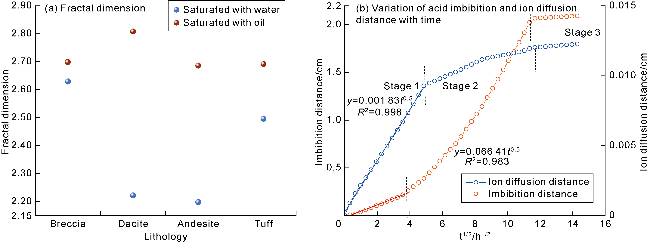
Fig. 12 shows the evolution curves of the fractal dimension of the pore structure after H+ diffusion erosion in water-rich pores and acid imbibition erosion in oil-rich pores of volcanic rocks of different lithologies. The fractal dimension following erosion induced by H+ diffusion in water-rich pores is generally lower than that resulting from acid imbibition in oil-rich pores. This is because in water-rich pores, the continuous water phase provides a uniform diffusion medium for H+. The uniform diffusion medium enables H+ to invade pores at all levels over a large area non-selectively, and dissolve minerals. It significantly enhances the connectivity of the pore network, increases the uniformity of the pore structure, and reduces the corresponding fractal dimension. In oil-rich pores, the core mass transfer mode of the acid solution is imbibition, and there are significant differences in capillary pressure among pores of different scales. The capillary pressure in small pores is stronger, causing the acid solution to preferentially imbibe and dissolve selectively, while the erosion process in medium and large pores is inhibited. Ultimately, the heterogeneity of the pore structure remains relatively high, and the fractal dimension remains correspondingly high.
Fig. 12. The fractal dimension of the water-rich and oil-rich pores of volcanic rock after acid erosion and the variation curve of the acid imbibition/ion diffusion distance with square root of time. |
To further reveal the fundamental differences in acidification between water-rich and oil-rich pores, the evolution mechanisms of H+ diffusion efficiency and acid imbibition intensity were analyzed from a dynamic perspective, and a quantitative reaction kinetics model was subsequently established. In water-rich pores, the difference in the H+ concentration gradient between the acid solution and the cores is relatively small. During the acidification process, the H+ diffusion coefficient can be approximated as a constant, and the H+ diffusion flux is positively correlated with the concentration gradient. Meanwhile, because the acid solution is diluted within the water phase, the concentration difference of H+ between it and the pore water is relatively small. The diffusion process driven by this chemical gradient can be equivalently expressed as a diffusion velocity dominated by volumetric flow for quantitative characterization [30]:
$V=\frac{J}{C}=\frac{V}{A_{\mathrm{c}} t}$
During the process of acid imbibition in oil-rich pores, the mineral dissolution resulting from acid solution-rock reactions directly leads to the reconstruction of the microscopic pore structure. This process further induces dynamic changes in the macroscopic physical properties (such as porosity and permeability) of the core. Based on this, the core physical properties are dynamically corrected first. Meanwhile, the correlation between the imbibition distance and t0.5 is used to characterize the kinetic behavior of acid imbibition. The imbibition distance is expressed as:
$D_{\mathrm{imb}}=\frac{V_{\mathrm{imb}}}{A_{\mathrm{c}}}=\sqrt{\frac{2 \phi(t) K(t) S_{\mathrm{wf}} p_{\mathrm{c}}}{\mu_{\mathrm{w}}}} \sqrt{t}$
The statistical data of the four lithologies were normalized to obtain the comprehensive characterization curve (Fig. 12b). Both the ion diffusion and acid imbibition processes exhibit three-stage evolution characteristics. In stage 1 (linear stage), both the H+ diffusion and acid imbibition processes show a strong linear correlation with t0.5. This indicates that in the early stage of the reaction, both the concentration difference (H+ diffusion driving force) and initial capillary pressure (imbibition driving force) can drive the acid solution-rock reaction to start efficiently. In stage 2 (transitional stage), the evolution trends of H+ diffusion and acid imbibition are opposite. The slope of the H+ diffusion curve gradually decreases, and the diffusion rate significantly slows down. The primary reason is that the precipitation of mineral particles resulting from erosion, coupled with the hydration-induced expansion of clay minerals, increases resistance to ion transport and hinders further H+ migration. The slope of the acid imbibition curve has significantly increased, and the imbibition rate shows an accelerating trend. The main reason is that the acid erosion reaction broadens the pore-throat radius, thereby increasing the core permeability. The increased fluidity resulting from improved permeability counteracts the negative effects of capillary pressure attenuation, ultimately enabling the acid to continuously imbibe into the pores inside the core. In stage 3 (stable stage), as the effective acid concentration within the system is depleted, the acid solution-rock reaction reaches dynamic equilibrium. Neither the ion diffusion distance nor the acid imbibition distance changes over time, and the comprehensive characterization curve stabilizes.
3. Conclusions
Significant differences exist in the acidification modification effects among volcanic rocks of different lithologies. Breccia and andesite are enriched in highly reactive and readily soluble minerals, such as calcite and clay. Following acidification, pore connectivity is significantly enhanced, resulting in a notable expansion of the swept effective fluid range. In tuff, the acid solution predominantly dissolves along the edges of characteristic pores, such as vesicles and amygdaloidal pores. As a result of this erosion, the fluid content within these pores increases significantly. However, dacite contains a relatively low proportion of highly reactive minerals, resulting in a weak acid erosion effect. Moreover, the reactivity differences among its constituent minerals during acidification are smaller, which limits the overall improvement of the pore structure.
Distinct differences exist in the migration mechanisms of acid solutions within water-rich and oil-rich pores. In water-rich pores, the hydrated hydrogen ion network formed within the continuous aqueous phase enhances H+ diffusion, promoting uniform erosion across large, medium and small pores. The pore structure becomes more homogenized, accompanied by a decrease in fractal dimension. In oil-rich pores, acid solution migration primarily occurs via imbibition driven by capillary pressure. Small pores with higher capillary forces are preferentially eroded, while medium and large pores are affected at a later stage. Overall, the extent of acid erosion in oil-rich pores is lower than that in water-rich pores, and pore heterogeneity remains relatively high.
Both the H+ diffusion process in water-rich pores and the acid imbibition process in oil-rich pores exhibit a three-stage evolution characterized as “linear-transitional-stable stages”. In the linear stage, the acid imbibition and H+ diffusion distances scale proportionally with t0.5, and the acid solution-rock reaction is driven by capillary pressure and concentration difference respectively. The transitional stage presents differentiated characteristics, the H+ diffusion rate decreases due to pore-throat blockage induced by the hydration and precipitation of clay minerals. The erosion resulting from acid imbibition enhances the permeability of the core. Concurrently, acid imbibition and mineral dissolution enhance the fluid flow capacity, partially offsetting the attenuation of capillary force, and sustaining the increase in imbibition rate. During the stable stage, both the H+ diffusion distance and the imbibition distance remain constant, and the acid solution-rock reaction reaches dynamic equilibrium.
Nomenclature
Ac—surface area, m2;
C—concentration of ions, mol/m3;
D—fractal dimension, unfactored;
Dimb—imbibition distance, m;
DN—total pore fractal dimension, unfactored;
DN1—fractal dimension of adsorption pores (medium and small pores), unfactored;
DN2—fractal dimension of seepage pores (large pores), unfactored;
J—diffusion flux, mol/(m2·s);
K—permeability of the imbibition solution, m2;
pc—capillary pressure, Pa;
Swf—saturation of the leading edge of adsorption, %;
t—time, s;
T2—lateral relaxation time, ms;
T2max—maximum lateral relaxation time, ms;
v—diffusion rate of ions, m/s;
V—change in the volume of the acid solution, m3;
Vimb—imbibition volume, m3;
w—cumulative pore volume fraction less than a certain T2 value, %;
μw—viscosity of the imbibition solution, Pa·s;
ϕ—rock porosity, %.