

Introduction
In China, coalbed methane (CBM) production surpassed the 10-billion-m3 milestone in 2023, and CBM resources endowed in medium-deep formations below 1 000 m account for an increasing proportion. This sector has become an important replacing option for ensuring the natural gas production capacity [1]. Compared to conventional shallow coal reservoirs, medium-deep coal reservoirs exhibit more complex geomechanical characteristics, posing new challenges for fracturing operations [2]. Commonly used "fluid-controlled and proppant- enhanced" techniques [3-5] face limitations in medium- deep coal reservoirs, such as restricted fracture height expansion, insufficiently complex fracture networks, or inadequate stimulated reservoir volume (SRV). For instance, some wells in typical blocks of the southern Qinshui Basin have demonstrated poor fracturing effect [6], with production falling below the economic threshold. Therefore, it is imperative to explore the fracture propagation mechanism in medium-deep coal reservoirs to provide theoretical basis for optimizing fracturing treatment.
The unique properties of medium-deep coal reservoirs are the fundamental cause of poor fracturing effects. Such reservoirs are typically characterized by: (1) intact primary textures with high mechanical strength; (2) well-developed bedding planes coupled with low cementing strength; and (3) pronounced anisotropy [7-8]. These characteristics collectively cause hydraulic fractures to propagate easily along bedding planes, hindering the formation of complex fracture networks. Experimental observations reveal that under conventional fracturing conditions, fractures often redirect along bedding planes, forming simple planar fracture networks [9-13]. This uniform fracture morphology severely limits reservoir stimulation. To address this limitation, variable pumping-rate fracturing is implemented to dynamically adjust operational parameters to alter the stress state of fractures, thereby increasing fracture complexity. This technique has been verified effective in actual shale gas development applications [12-13]. Its primary mechanisms include: (1) inducing competitive multi-fracture propagation through flow rate variation; (2) promoting fracture branching via stress fluctuations; and (3) optimizing fluid loss behavior to enhance fracture network uniformity [14-16]. However, the unique geomechanical characteristics of medium-deep coal reservoirs present unresolved challenges in mechanisms for bedding activation and fracture propagation control. The primary objective for large-scale treatment of medium-deep coal reservoirs remains the formation of complex fracture networks [17-19].
This paper presents an experimental study on coal reservoirs within the variable pumping-rate fracturing test area of the Qinshui Basin. Different pumping-rate lift schemes are designed to quantitatively analyze their impacts on fracture morphology. Furthermore, corresponding theoretical prediction models are constructed to analyze the application of variable pumping-rate fracturing in medium-deep coal reservoirs.
1. Variable pumping-rate fracturing: fundamental principles and experimental design
1.1. Fundamental principles
Variable pumping-rate fracturing is a technique by which the temporal sequence of fracturing parameters is dynamically adjusted [20] to optimize fracture propagation morphology and reservoir stimulation effects. Its core lies in establishing a fracture pressure gradient equation and a dynamic fluid loss equation, coupling flow rate, pore pressure, and fluid loss rate. Based on the mechanical anisotropy of coal-rock bedding planes and the dynamic characteristics of fracturing fluid loss, this paper proposes a “flow rate-fluid loss coupling fracture” model based on weak bedding planes. With this model, the fracture initiation pressure (FIP) and fluid loss behavior on bedding planes are regulated through slow-lift and fast-lift of pumping (or flow) rate to clarify the relationship between fracture network complexity and flow rate variation.
Model construction follows three key assumptions:
(1) Fracture pressure gradient is subjected to a competition mechanism. The coal-rock matrix is an isotropic elastomer. The shear strength of bedding planes is significantly lower than that of the matrix, allowing fractures to preferentially occur at weak bedding planes when variations in bedding plane dip angle are neglected.
(2) There is a dynamic relationship between flow rate and fluid loss. The fracturing fluid loss rate is nonlinearly related to the flow rate. At low flow rates, the loss coefficient (CL,slow) is dominated by matrix permeability, while continuous activation of microfractures in bedding planes increases the equivalent loss coefficient. At high flow rates, primary fractures open more rapidly, resulting in a relatively smaller CL,fast. The leaking surface area coefficient varies with flow rate: uniform loss distribution at low flow rates (βs,slow=0.15 cm), and localized high loss at high flow rates (βs,fast=0.32 cm).
(3) There is a correlation between flow rate and bottomhole pressure. The complex time delays or uncertainties caused by string friction and near-wellbore effects are ignored. In the flow rate slow-lift stage, it is assumed that, at low flow rates, fluid has a sufficient time to leak into weak bedding planes, preferentially increasing the pore pressure within these planes and reducing their effective stress and fracture pressure. In the flow rate fast-lift stage, it is assumed that, following the fast lift of flow rate, wellbore pressure surges sharply, swiftly exceeding the FIPs of multiple weak bedding planes or the matrix itself. Concurrently, due to relatively delayed leaking, the pressure concentration effect becomes more pronounced.
According to the Mohr-Coulomb criterion, the critical condition for shear failure at a bedding plane is [21]:
$\tau_{\mathrm{b}}=\mathcal{c}_{\mathrm{b}}+\sigma_{\mathrm{n}} \tan \phi_{\mathrm{b}}$
$\sigma_{\mathrm{n}}=\sigma_{\mathrm{h}} \cos ^{2} \theta+\sigma_{\mathrm{v}} \sin ^{2} \theta+\alpha_{\mathrm{p}} p_{\mathrm{p}}$
When γ=cb/c<0.6, bedding planes dominate fracturing, and the fracture pressure equation is modified as follows:
$p_{\mathrm{f}}=\sigma_{\mathrm{h}}+\min \left(\frac{2 c \cos \phi}{1-\sin \phi}, \frac{2 \mathcal{c}_{\mathrm{b}} \cos \phi_{\mathrm{b}}}{1-\sin \phi_{\mathrm{b}}}\right)$
The low strength characteristics of weak bedding planes result in their fracture thresholds lower than those of the matrix. Eq. (3) compares the fracture thresholds of bedding planes and matrix to determine the dominant fracture mechanism in reservoirs during flow rate regulation.
The high filtration properties of coal rock lead to significant leaking of fracturing fluid into the formation, with the fluid loss rate exhibiting a nonlinear relationship with flow rate. Considering the above-mentioned properties of coal rock, the fluid loss model is improved to:
$V_{\mathrm{L}}=C_{\mathrm{L}} \sqrt{t}+\beta_{\mathrm{s}} A_{\mathrm{f}}$
Fluid loss alters the pressure distribution near bedding planes. Fracturing fluid infiltrates microcracks near these planes, inducing microfractures at multiple weak points and thus creating multi-point fracture initiation. Considering variations in leaking under different pumping methods, variable pumping-rate fracturing fluid loss can be expressed as:
$V_{\mathrm{L}}=C_{\mathrm{L}, \text { slow }} \sqrt{t}+\beta_{\mathrm{s}, \text { slow }} A_{\mathrm{f}}$
$V_{\mathrm{L}}=C_{\mathrm{L}, \text { fast }} \sqrt{t}+\beta_{\mathrm{s}, \text { fast }} A_{\mathrm{f}}$
Combined with the bedding characteristics and high filtration properties of coal rock, the fracture pressures during slow and fast lifts of flow rates are respectively represented as:
$p_{\mathrm{f}, \mathrm{slow}}=\sigma_{\mathrm{h}}+\min \left(\frac{2 c \cos \phi}{1-\sin \phi}, \frac{2 c_{\mathrm{b}} \cos \phi_{\mathrm{b}}}{1-\sin \phi_{\mathrm{b}}}\right)-\alpha_{\mathrm{p}} p_{\mathrm{p}, \mathrm{slow}}$
$p_{\mathrm{f}, \mathrm{fast}}=\sigma_{\mathrm{h}}+\min \left(\frac{2 c \cos \phi}{1-\sin \phi}, \frac{2 c_{\mathrm{b}} \cos \phi_{\mathrm{b}}}{1-\sin \phi_{\mathrm{b}}}\right)-\alpha_{\mathrm{p}} p_{\mathrm{p}, \mathrm{fast}}$
In summary, variable pumping-rate fracturing controls fracture initiation and propagation by adjusting flow rates, thereby influencing the pressure distribution and loss behavior of fracturing fluid near bedding planes.
1.2. Preparation of experimental samples
1.2.1. Basic parameters of coal samples
Currently, 800 m is generally used as the boundary between shallow and medium-deep coal formations [22-24]. Coal samples used in this study were collected from an outcrop in the Shizhuang South Block of the Qinshui Basin, Shanxi Province (Fig. 1). This outcrop belongs to the same stratigraphic unit as the coal-rock formations (buried at depths of 1 000-1 600 m) in the variable pumping-rate fracturing test area of the Qinshui Basin. The coal is black, high-rank, and hard, with well-developed natural fractures. The bedding is easily activated, and mechanical properties vary significantly in the directions parallel and perpendicular to beddings. Plug sample test results indicate an anisotropy coefficient for elastic modulus ranging from 1.00 to 1.63 and an anisotropy coefficient for compressive strength from 0.83 to 1.08. Specific rock mechanical properties are detailed in Table 1.
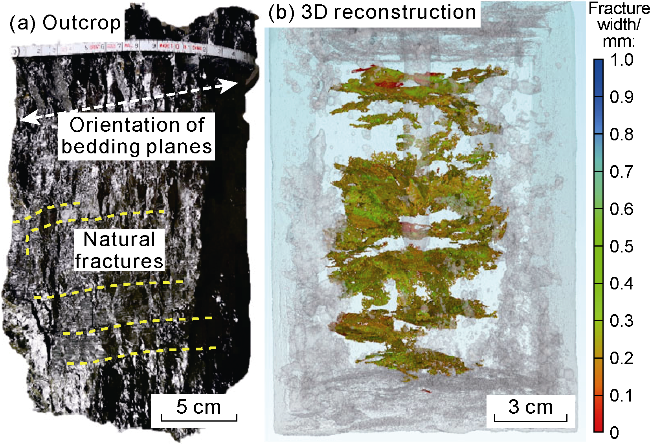
Fig. 1. Development of natural fractures in outcropped coal rock. |
Table 1. Mechanical properties of coal reservoirs in Qinshui Basin |
| Sample No. | Coring direction | Confining pressure/MPa | Compressive strength/MPa | Elastic modulus/GPa | Poisson's ratio |
|---|---|---|---|---|---|
| R1 | Perpendicular to bedding | 20 | 103.210 | 4.228 | 0.460 |
| R2 | Parallel to bedding | 89.160 | 4.494 | 0.362 | |
| R3 | Perpendicular to bedding | 30 | 112.657 | 4.898 | 0.484 |
| R4 | Parallel to bedding | 121.813 | 6.328 | 0.496 |
1.2.2. Preparation of fracturing specimens
The concrete casting method was employed to ensure coal sample integrity [25]. The artificial roof and floor of concrete prepared at different cement, sand, water ratios and the actual roof and floor of the medium-deep coal reservoir were compared to make sure their mechanical properties are consistent (Table 2). It is found that the roof and floor of concrete prepared at a cement- sand-water ratio of 2:5:1 have the mechanical properties closer to those of the real formation. Therefore, this ratio was used for concrete preparation in the experiment.
Table 2. Mechanical properties of roof/floor of specimens and coal reservoir |
| Concrete composition (Cement:sand:water ratio) | Elastic modulus /GPa | Poisson's ratio | Tensile strength /MPa |
|---|---|---|---|
| 3:1:1 | 14.32 | 0.27 | 2.03 |
| 3:2:1 | 16.97 | 0.27 | 3.01 |
| 2:3:1 | 18.95 | 0.24 | 4.40 |
| 2:5:1 | 20.17 | 0.21 | 4.56 |
| Actual coal rock | 18.70-20.21 | 0.21-0.22 | 2.73-5.08 |
The specimen preparation procedures are as follows:
(1) Use the coal rock samples taken from the outcrop to make four cubic specimens 1#-4# (25 cm × 25 cm × 25 cm), which are then placed at the center of a 30 cm × 30 cm × 30 cm mold.
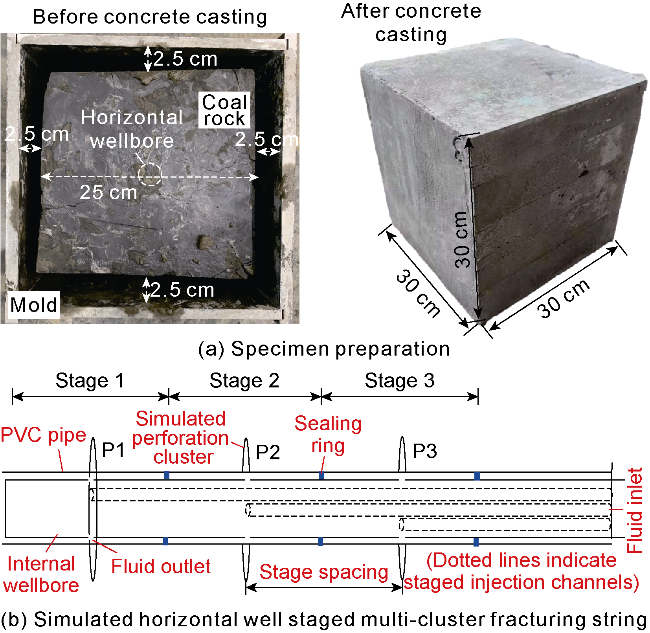
Fig. 2. Fracturing specimen preparation. |
(3) Drill a vertical hole with a diameter of 2.7 cm and a depth of 26.0 cm at the exact center of the rock sample surface parallel to the bedding plane. Insert a PVC pipe with an outer diameter of 2.2 cm as the horizontal section of the horizontal wellbore (Fig. 2b), and secure it in the hole using epoxy resin adhesive. Then, land the simulated staged multi-cluster fracturing string into the wellbore.
1.3. Similarity criteria and design for fracturing experiments
Laboratory simulation experiments of horizontal well staged fracturing consider the effects of different stage spacing and pumping methods on multi-fracture propagation morphology. The spacing between adjacent slots is defined as the stage spacing (Fig. 2b). Design parameters for stage spacing are determined based on the geometric similarity criteria:
$\frac{L_{\mathrm{s}, \mathrm{M}}}{L_{\mathrm{f}, \mathrm{M}}}=\alpha_{1} \frac{L_{\mathrm{s}, \mathrm{~F}}}{L_{\mathrm{f}, \mathrm{~F}}}$
Field data of coal reservoirs in the Qinshui Basin show that the average fracture half-length is 110 m [27-28], and the stage spacing typically ranges from 60 m to 80 m. The fracture half-lengths obtained in the experiments are 8.0 cm to 13.5 cm. Accordingly, calculations indicate that the 80 m field stage spacing corresponds to the 6 cm experimental stage spacing, while the 60 m field stage spacing corresponds to the 4 cm experimental stage spacing. Key field fracturing parameters are shown in Table 3; parameters and schemes for fracturing experiments based on similarity criteria are presented in Table 4.
Table 3. Field fracturing parameters |
| Fracturing mode | Elastic modulus/ GPa | Stage spacing/ m | Fracture half-length/ m | Pumping-rate/ (m3·min−1) | Pumping-rate lift rate/ (m3·min−1·cycle−1) | Vertical stress/ MPa | Maximum horizontal principal stress/MPa | Minimum horizontal principal stress/MPa | |
|---|---|---|---|---|---|---|---|---|---|
| Initial | Final | ||||||||
| Constant pumping-rate | 4.228-6.328 | 60 | 100-120 | 15 | 15 | 0 | 30 | 43 | 27 |
| 4.228-6.329 | 80 | 100-120 | 15 | 15 | 0 | 30 | 43 | 27 | |
| Variable pumping-rate | 4.228-6.330 | 60 | 100-120 | 1 | 15 | 1 | 30 | 43 | 27 |
| 4.228-6.331 | 60 | 100-120 | 1 | 15 | 2 | 30 | 43 | 27 | |
Table 4. Experimental fracturing parameters based on similarity criteria |
| Fracturing mode | Specimen No. | Elastic modulus/ GPa | Stage spacing/ cm | Fracture half-length/ cm | Pumping rate/ (m3·min−1) | Pumping-rate lift rate/ (m3·min−1·cycle−1) | Vertical stress/ MPa | Maximum horizontal principal stress/MPa | Minimum horizontal principal stress/MPa | |
|---|---|---|---|---|---|---|---|---|---|---|
| Initial | Final | |||||||||
| Constant pumping-rate | 1# | 4.89 | 4 | 8.0-13.5 | 50 | 50 | 0 | 17 | 30 | 14 |
| 2# | 4.89 | 6 | 8.0-13.5 | 50 | 50 | 0 | 17 | 30 | 14 | |
| Variable pumping-rate | 3# | 4.89 | 4 | 8.0-13.5 | 10 | 50 | 10 | 17 | 30 | 14 |
| 4# | 4.89 | 4 | 8.0-13.5 | 10 | 50 | 20 | 17 | 30 | 14 | |
1.4. Experimental procedure
(1) Place Specimen 1# in the core chamber and apply triaxial stresses according to preset parameters.
(2) Inject the fracturing fluid containing fluorescent tracer at a low flow rate of 5 mL/min (below the initial flow rate). After pressure stabilization, gradually increase the flow rate to 50 mL/min according to the flow rate lift scheme specified in Table 5.
Table 5. Fracture activation of specimens after fracturing |
| Specimen No. | Fracturing mode | Bedding fracture width/mm | Number of transverse fractures | Number of bedding fractures | Fracture area/cm2 | Proportion of bedding fracture area/% | Fracture complexity index |
|---|---|---|---|---|---|---|---|
| 1# | Constant pumping-rate | 4.0-6.0 | 1 | 2 | 1 497.71 | 74.0 | 2.11 |
| 2# | Constant pumping-rate | 5.0-6.0 | 2 | 1 | 2 391.11 | 62.0 | 2.26 |
| 3# | Slow-lift pumping-rate | 0.5-2.0 | 4 | 3 | 3 223.97 | 36.4 | 2.62 |
| 4# | Fast-lift pumping-rate | 1.0-3.0 | 6 | 2 | 2 798.98 | 24.8 | 2.49 |
(3) Upon completion of the fracture-propagation-stabilization process at the current fracturing stage, proceed to the next stage, until all operations at the three fracturing stages of the horizontal wellbore are completed.
(4) After fracturing completion, drill a plug with 6 cm radius at the center of the wellbore. Acquire grayscale images of the specimen using a high-precision CT scanner with the resolution of 13 μm, and calculate the fracture area.
(5) Analyze the propagation morphology of artificial fractures on the surface of and within the rock samples, through three-dimensional reconstruction of fracture morphology, combined with fluorescent tracer distribution characteristics and rock sample sectioning results (Natural fractures are well-developed in actual coal rock, but sample sections cannot distinguish natural from artificial fractures. Therefore, fluorescent tracer distribution characteristics are used to assist in clarifying artificial fracture propagation).
(6) Repeat steps (1) to (5) on Specimens 2#-4# sequentially, and then terminate the experiments.
To examine especially the activation effect of variable pumping-rate fracturing on beddings and natural fractures in coal rock, the box-counting method [31-32] was employed to quantitatively evaluate the spatial complexity of the fracture network. The total artificial fracture area and bedding fracture area can be calculated using the box-counting method based on the near-wellbore total fracture area and near-wellbore bedding fracture area derived from CT scanning results:
$D=\lim _{\epsilon \rightarrow 0} \frac{\lg N(\epsilon)}{\lg (1 / \epsilon)}$
$S_{\mathrm{t}}=S_{\mathrm{nw}}\left(\frac{L_{\mathrm{max}}}{L_{\mathrm{nw}}}\right)^{D-2}$
2. Artificial fracture morphology
2.1. Fracture morphology in constant pumping-rate and variable pumping-rate fracturing
For the convenience of subsequent descriptions, view and fracture propagation directions shown in Fig. 3 are specifically defined.

Fig. 3. View direction and fracture propagation direction. |
For Specimens 1# and 2#, perforation intervals are spaced 4 cm and 6 cm, respectively. Injection was performed at a constant pumping-rate of 50 mL/min. During fracturing, the near-wellbore bedding fractures were primarily activated, while vertical fracture propagation was constrained. Consequently, simple linear fractures predominantly formed along the bedding planes on the specimen surfaces (Fig. 4). Specimens 1# and 2# exhibited bedding fracture areas of 1 048.40 cm2 and 1 482.49 cm2, respectively, accounting for 72% and 62% of the total 62% of the total artificial fracture area. The fracture complexity (characterized by D) was approximately 2.11 and 2.26.
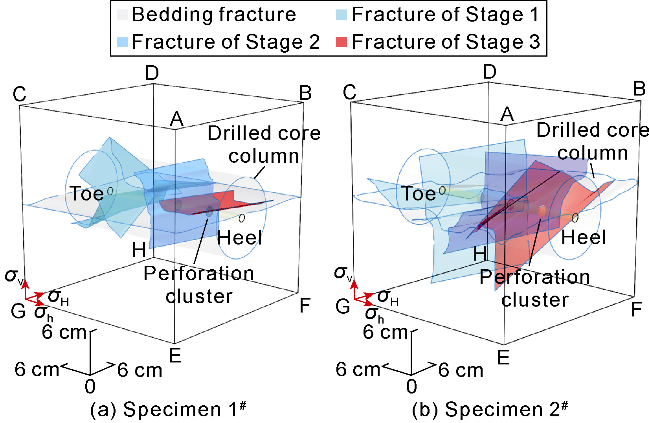
Fig. 4. 3D reconstruction of specimens after constant pumping-rate fracturing. |
A comparison of near-wellbore fracture traces (Fig. 5) indicates that the vertical propagation distance of fractures (or propagation distance in the fracture height direction) in Specimen 1# is significantly constrained. Only two fractures extended beyond 6 cm from the wellbore into the mid-to-distant areas. In contrast, in Specimen 2#, with the stage spacing increased to 6 cm, the vertical propagation distance of fractures increased, substantially reducing the barrier effect of bedding on near-wellbore transverse fractures.
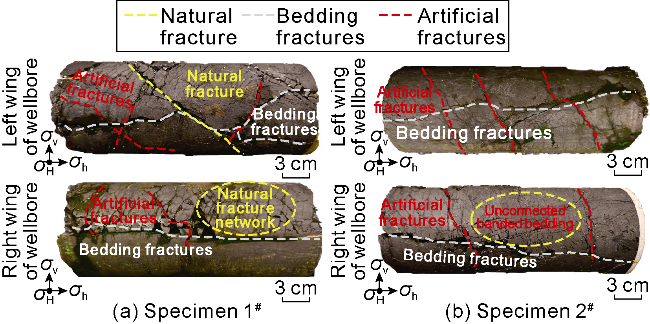
Fig. 5. Trace of artificial fractures on the surface of specimen after constant pumping-rate fracturing. |
Weak fluorescence tracing (Fig. 6) also indicates that multiple activated beddings exert a significant trapping effect on fracture distribution. The bottom of the left wing of wellbore in Specimen 2# contains numerous activated natural fractures (weak fluorescence signals indicating low activation of natural fractures in area, without forming effective primary fractures), which significantly restricts the propagation of artificial fractures in this area. The morphology of artificial fractures in this zone is slightly less complex compared to the top of the left wing and the right wing of the wellbore. Under identical wellbore and completion conditions, although overall fracture propagation remains constrained by beddings, Specimen 2 exhibits a trend toward increased vertical expansion in localized areas due to relatively weak inter-fracture interference. This indicates that increasing cluster spacing can marginally reduce the interference of bedding planes on artificial fractures, but still fails to extend artificial fractures to distant wellbore areas.
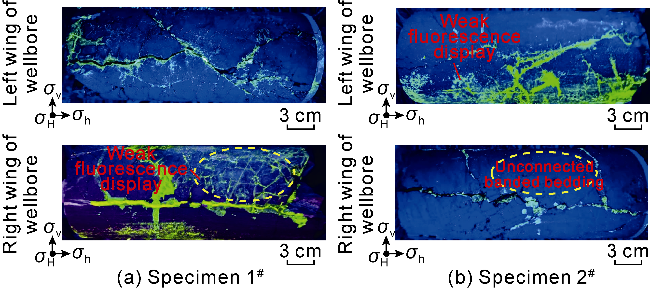
Fig. 6. Tracer distribution in the specimen after constant pumping-rate fracturing. |
Specimen 3# was fractured using a slow-lift pumping- rate method, forming a complex spine-shaped fracture network (Fig. 7a, Fig. 8a). The fractures are initiated at bedding, and then reoriented before being reconnected, which are distinct from the behaviors in conventional fracturing. The drilled core column from Specimen 3# also revealed that fracturing under pumping-rate slow- life formed 4 transverse fractures in addition to 3 bedding fractures, with 3 transverse fractures extending to the specimen surface (see the three fractures extending to the boundary on the AEGC surface in Fig. 7a). Specimen 4# was fractured using a fast-lift pumping-rate, forming nearly spine-shaped or #-shaped fracture network (Figs. 7b and 8b). These fractures exhibit distinct characteristics of “cross bedding initiation-branching and reconnection-bedding parallel linkage”.
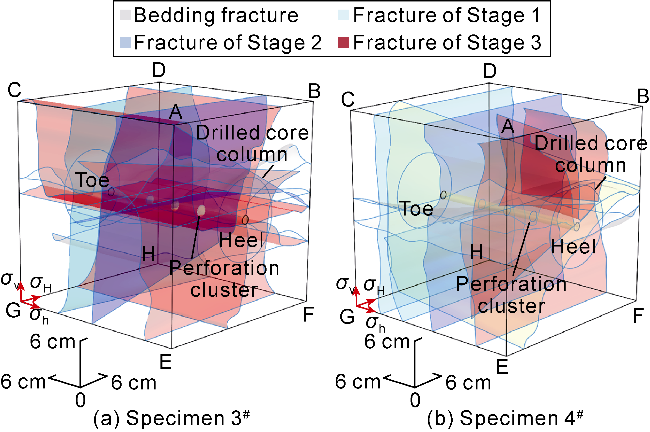
Fig. 7. 3D reconstruction of fractures in specimen after variable pumping-rate fracturing. |
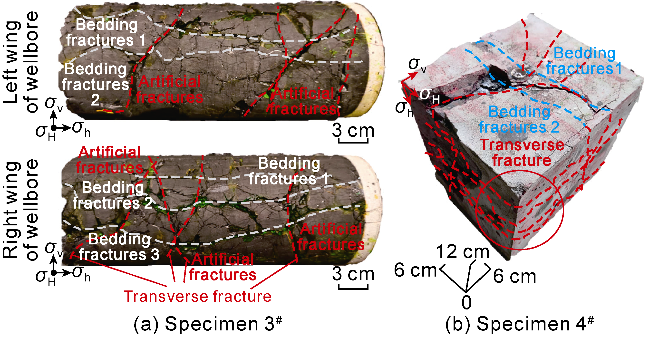
Fig. 8. Trace of artificial fractures on the surface of the specimen after variable pumping-rate fracturing. |
In Fig. 9a, no weak fluorescent features with a network distribution appears, indicating that the expansion characteristics of bedding-initiated fractures differ from those of bedding-captured fractures. Specifically, artificial fractures first propagate along bedding planes, and multi- branched fractures undergo multiple stepwise turns and connections under the combined effects of pumping-rate lift and coal structure. The number of near-wellbore transverse fractures increases, which reflecting a pattern of multiple fractures competing for expansion. Specimen 4# fractured under pumping-rate fast-lift exhibits the dominance of cross-bedding main fractures, especially single main fracture. There are few fracture deflections and branches, and 4 of the 6 transverse fractures extend to the specimen surface (Fig. 9b).
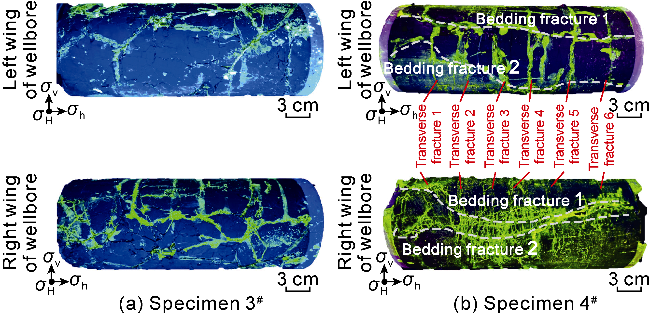
Fig. 9. Tracer distribution in the specimen after variable pumping-rate fracturing. |
Calculations show that, for Specimen 3#, the total fracture area is 3 223.97 cm2, with bedding fracture area of 1 173.53 cm2 (36.4%), and the fracture complexity index is approximately 2.62. For Specimen 4#, the total fracture area is 2 798.98 cm2, with bedding fracture area of 694.15 cm2 (24.8%), and the fracture complexity index is approximately 2.49. Compared with constant pumping- rate fracturing (Table 5), variable pumping-rate fracturing increases the total artificial fracture area by an average of 1 108 cm2, elevates the fracture complexity by approximately 14.4%, and reduces the average proportion of bedding fracture area by 37.4%. This demonstrates that variable pumping-rate fracturing effectively enhances fracture complexity while reducing the activation of beddings.
2.2. Effect of stage spacing on bedding activation
Under constant pumping-rate fracturing, in Specimens 1# and 2#, fractures are primarily imitated along bedding fractures, which account for over 60% of the total fracture area. The fracture complexity index below 2.3 and limited vertical fracture propagation indicate that variations in perforation interval spacing have a limited impact on fracture complexity.
Multi-point fracture initiation appears near the well- bore in Specimen 1# (Fig. 10), with overall vertical propagation significantly constrained by beddings. At Stage 1, fractures are initiated along the direction of maximum horizontal principal stress and communicated with natural fractures, forming inclined artificial fractures (Fig. 10a). Below the wellbore (toward the floor), fractures initiated are reoriented along the well-developed beddings, forming two bedding fractures parallel to the wellbore (Fig. 10b). At Stage 2, constrained by the wide bedding fractures at Stage 1, vertical artificial fractures are connected to the bedding fractures at Stage 1. In the fracture length direction, the artificial fractures on the right wing of the wellbore are reoriented to and connected with natural fractures, and the fractures on the left wing of the wellbore are initiated along beddings and then reoriented along the direction of the maximum horizontal principal stress. Influenced by the connected bedding fractures and natural fractures, the vertical propagation distance is limited, making these fractures difficult to extend to the distal wellbore area. At Stage 3, fractures below the wellbore communicate with the bedding fractures formed at Stages 1 and 2. Collectively, they form a fracture network dominated by bedding fractures around the wellbore. Disturbance above the wellbore is weak. Vertical fractures are initiated along the bedding fractures, and then reoriented toward the direction of maximum horizontal principal stress in the Stage 2 area. Similarly, constrained by the already communicated bedding fractures and insufficient fracturing fluid kinetic energy, fractures arrest after reorientation.
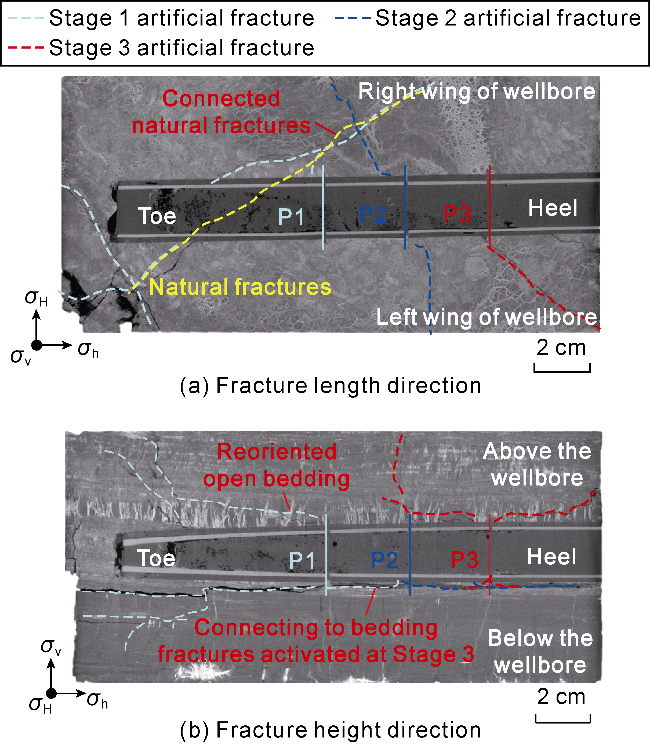
Fig. 10. CT section of near-wellbore fractures in Specimen 1# after fracturing. |
The stage spacing in Specimen 3# was increased to 6 cm, resulting in reduced restriction on vertical fracture propagation at all stages (Fig. 11). At Stage 1, in the fracture length direction, transvers main fractures are formed near the wellbore, and branch fractures are initiated along the wellbore and arrest on the left wing of the wellbore (Fig. 11a). In the fracture height direction, fractures are initiated along beddings below the wellbore before arresting at the high-density bedding area (the bright area below the wellbore). At Stage 2, in the fracture height direction, the branch bedding fractures initiated above the wellbore cross the bedding planes and then they are oriented, forming vertical fractures. At Stage 3, fractures below the wellbore, though influenced by Stage 2, can still initiate at multiple points near the perforation cluster. After initiation, they first propagate along bedding planes and then reorient along principal stress. Fractures above the wellbore are reoriented due to the presence of beddings, extending to the area unaffected at Stage 2, forming a banded fracture network (Fig. 11b). In Specimen 2#, the trapping effect of beddings on artificial fractures is significantly weakened, most bedding fractures occur in the area nearly above the wellbore, and artificial fractures tend to propagate vertically (or to form transverse fractures) but arrest immediately after their reorientation due to the distribution of fracturing fluid mainly within interconnected bedding fractures.
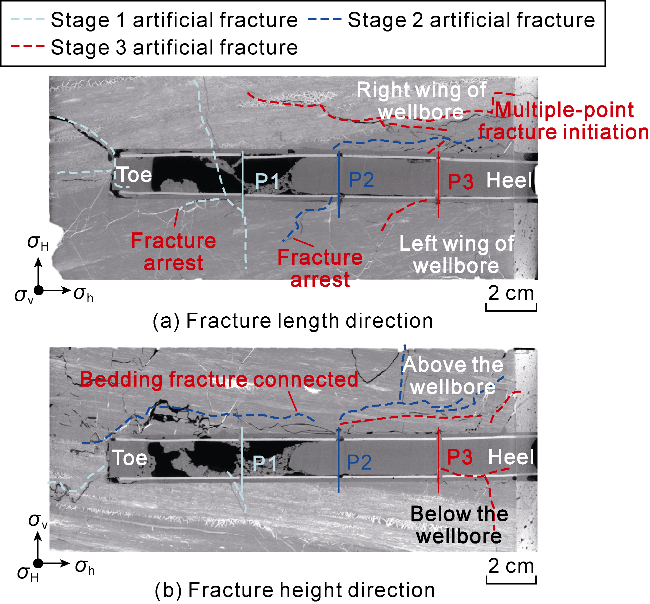
Fig. 11. CT section of near-wellbore fractures in Specimen 2# after fracturing. |
Previous studies have shown that when perforation and coal-rock cleat inclinations are fixed and the spacing is 60 mm, the fracturing network achieves its maximum and can more readily penetrate cleat surfaces [33]. However, in conventional fracturing, variations in stage spacing yield limited improvements to complex fracture networks [34]. Due to differences in coal structure and well placement, fracture initiation conditions are complex. Conventional high-pumping-rate fracturing often disrupts beddings, leading to the formation of large-width horizontal fractures in areas with poor-developed bedding planes (Fig. 12), which reduces the SRV. This indicates that coal structure significantly influences fracture morphology more than stage spacing. Given the generally small coal reservoir thickness, enhancing fracture complexity is more critical than increasing fracture height. The core advantage of variable pumping-rate fracturing lies in suppressing excessive opening of bedding, significantly enhancing the ability to form complex fracture networks.
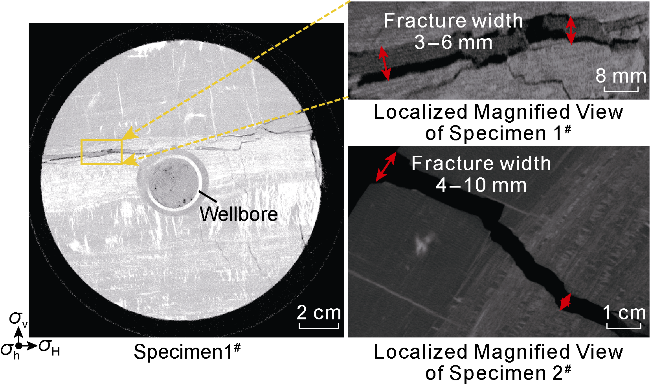
Fig. 12. Width of bedding fracture in Specimens 1# and 2# after constant pumping-rate fracturing. |
2.3. Effect of variable pumping-rate fracturing on bedding activation
Variable pumping-rate fracturing effectively regulates the initiation and propagation of near-wellbore fractures in coal reservoirs. As shown in Fig. 13a and 13b, fracturing at slow-lift pumping-rate form 4 transverse fractures. Taking Stage 1 in Fig. 13b as an example, fractures are initiated along the direction of maximum horizontal principal stress. After four lifts of pumping- rate, multiple stepped-reorienting fractures are formed in a manner of propagation in stress direction and bedding direction alternatively (see Re 1-5 in Fig. 13b). They connect three bedding fractures (Fig. 13c). Compared to constant pumping-rate, slow-lift pumping-rate suppresses excessive activation of bedding fractures while increasing fracture area. At Stages 2 and 3, fractures are also initiated at multiple points. Even after bedding fractures on both wings of the wellbore are successfully activated, multiple stepped-reorienting fractures are formed. This further confirms the role of variable pumping-rate in promoting complex fracture network formation, avoiding premature activation of bedding fractures at high pumping-rate that would reduce fracture creation efficiency.
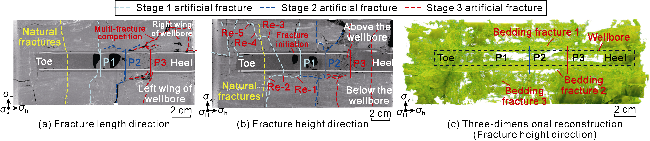
Fig. 13. CT section and 3D reconstruction of fracture morphology in Specimen 3# after fracturing. |
The fracture propagation during fracturing at fast-lift pumping-rate primarily follows a path of rapid competition-bedding interference-bedding penetration-return to principal stress. As shown in Fig. 14a and 14b, at Stage 1, in the fracture length direction, fractures initiate along the maximum horizontal principal stress direction. Influenced by both the mineral zone and pumping-rate fast-lift, near-wellbore fractures are narrower and hindered for competition. After traversing the mineral zone, the resulting main fracture propagates along the maximum horizontal principal stress direction, while branch fractures are reoriented along the mineral zone and bedding to form a complex fracture network. In the fracture height direction, fractures undergo vertical reorientation at bedding interfaces, and activate two bedding fractures during this process (Fig. 14c). At Stage 2, in the fracture length direction, fractures on the right wing of the wellbore deflect when penetrating the mineral zone and generate branch fractures. In the fracture height direction, fractures above the wellbore are initiated along the direction of maximum horizontal principal stress, and then reoriented due to bedding influence but subsequently extend again along the maximum horizontal principal stress direction. Fractures below the wellbore are initiated along beddings and connected with Stage 1's bedding fractures (Fig. 14b). At Stage 3, in the fracture length direction, on the right wing of the wellbore, fractures are initiated at multiple points and arrest at the mineral zone boundary; on the left wing, vertically oriented fractures are formed. In the fracture height direction, fractures are initiated along beddings at perforation clusters both above and below the wellbore. The bedding fractures below the wellbore are connected with fractures of Stage 2, forming continuous bedding fractures along the wellbore.
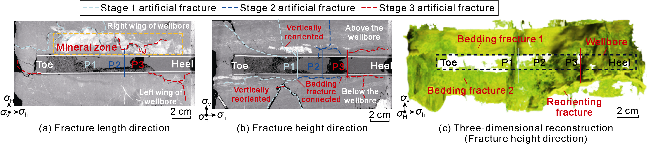
Fig. 14. CT section and 3D reconstruction of fracture morphology in Specimen 4# after fracturing. |
2.4. Fracture cross-bedding propagation in variable pumping-rate fracturing
During pumping-rate slow-lift, significant fluid loss occurs, and fracturing fluid more readily infiltrates microcracks near bedding planes. This induces multi- point fracture initiation, with lower fracture pressure (average 9.2 MPa) and narrower fractures (0.5-1.5 mm).
During pumping-rate fast-lift, the higher fluid injection rate creates an uneven pressure distribution near the bedding planes. High-pressure zones readily initiate primary fractures, while low-pressure zones may trigger branching fractures. The shear strength of bedding planes is relatively low, allowing multiple branching fractures to form at weak points. However, fluid loss is minimal, pore pressure increases rapidly, effective stress decreases quickly, fracture pressure is relatively high (average 13.2 MPa), and fracture width is relatively large (typically 2.5-3.0 mm) (Fig. 15).
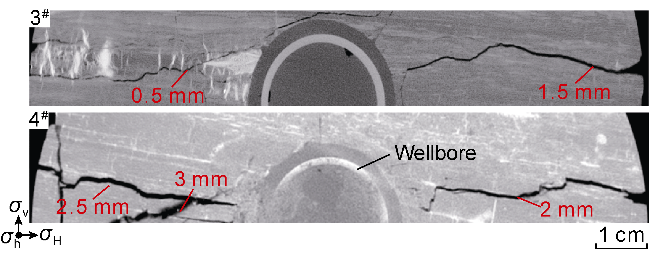
Fig. 15. Comparison of fracture widths under variable pumping-rate fracturing. |
Based on the aforementioned differences in bedding activation, the spatial distribution of acoustic emission events was overlaid with post-fracturing CT scans of rock samples (Fig. 16). During variable pumping-rate fracturing, acoustic emission signals exhibit distinct phased variations. For Specimen 1# with constant pumping-rate fracturing (Fig. 16a), acoustic emission signals during the fracture initiation are concentrated in the wellbore area and nearby bedding zones, characterized by high-frequency and dense patterns. For Specimens 3# and 4# with variable pumping-rate fracturing (Fig. 16b, 16c), the initiation phase features predominantly low-frequency sparse events. During fracture propagation, acoustic emission signals significantly intensify, manifesting as high-frequency dense events. Signals during the stabilized fracture expansion tend to be steady. During fracturing at fast-lift pumping-rate, the clustering characteristics of acoustic emission signals become more pronounced (Fig. 16c). When the pumping-rate increases to 30 mL/min, fractures are rapidly connected to the beddings near the wellbore, forming multi-fracture competitive propagation. As the pumping-rate increases to 50 mL/min, the barrier effect of bedding on fractures is significantly weakened, allowing the fractures to expand steadily to the sample boundary. The number of acoustic emission points gradually increase during the pumping-rate lift phase. For Specimen 4# with fracturing at fast-lift pumping-rate, two cases of multi-fracture initiation and propagation are found (see ① and ② in Fig. 16c). In contrast, for Specimen 3# with fracturing at slow-lift pumping-rate, five locations of multi-fracture initiation and expansion appear (see ①-⑤ in Fig. 16b). Specimen 1# with constant-rate fracturing shows minimal evidence of multi-directional activation of microfractures along bedding planes. Even when microfractures are activated, they rapidly arrest within the beddings, severely limiting the fracture height achievable in horizontal wells. Comprehensive analysis of the effects of constant pumping-rate and variable pumping-rate fracturing on artificial fracture propagation in coal reservoirs reveals that Specimens 1# and 2# subjected to constant pumping-rate fracturing exhibited rapid opening of bedding planes, while Specimens 3# and 4# subjected to variable pumping-rate fracturing show gradual opening and communication of bedding fractures, which significantly reduces the degree of bedding activation and decreases fracture width. The average width of bedding fractures ranges from 4.0 mm to 6.0 mm in Specimens 1# and 2#, while between 0.5 mm and 3.0 mm in Specimens 3# and 4# (Table 5). The variable pumping-rate fracturing specimens exhibit a higher number of transverse fractures and a greater number of connected natural fractures compared to the constant pumping-rate fracturing specimens. This indicates that variable pumping-rate fracturing helps reduce the barrier of beddings on artificial fractures. Near the wellbore is dominated by multi-fracture competitive propagation rather than a domination of bedding fractures in fracture propagation. This significantly enhances the ability of artificial fractures to connect with more natural fractures, effectively controlling fracture initiation directions in the near-wellbore zone.
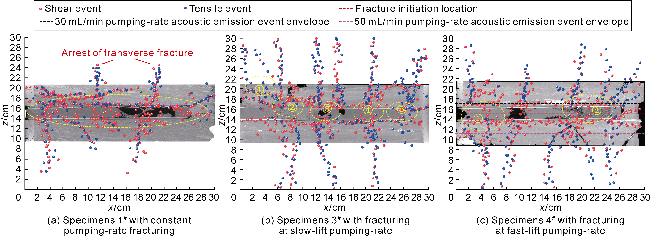
Fig. 16. Acoustic emission distribution characteristics of specimens (x indicates the distance to the heel, while z indicates the vertical distance to the bottom of the cubic specimen; ①-⑤ indicate the location of multi-fracture competitive initiation). |
As shown in Fig. 17, the average width of transverse fractures in the fracture height direction of Specimen 3# subjected to slow-lift pumping-rate fracturing is 2.14 mm, narrower than the average fracture width of 3.06 mm observed in Specimen 4# subjected to fast-lift pumping- rate fracturing. The fracture width variation patterns under both schemes exhibit the following characteristics: (1) similar fracture widths at initiation points, with Specimens 3# and 4# showing 2.94 mm and 3.02 mm respectively; (2) larger fracture widths in bedding fracture zones, gradually decreasing after bedding penetration, with Specimen 4# under fast-lift scheme exhibiting frequent fluctuations in fracture width; and (3) given the minimal mechanical property differences between Specimens 3# and 4#, pumping-rate fast-lift increases fracture width during bedding penetration while enhancing fracture tortuosity, while slow-lift facilitates bedding penetration and increases fracture area.
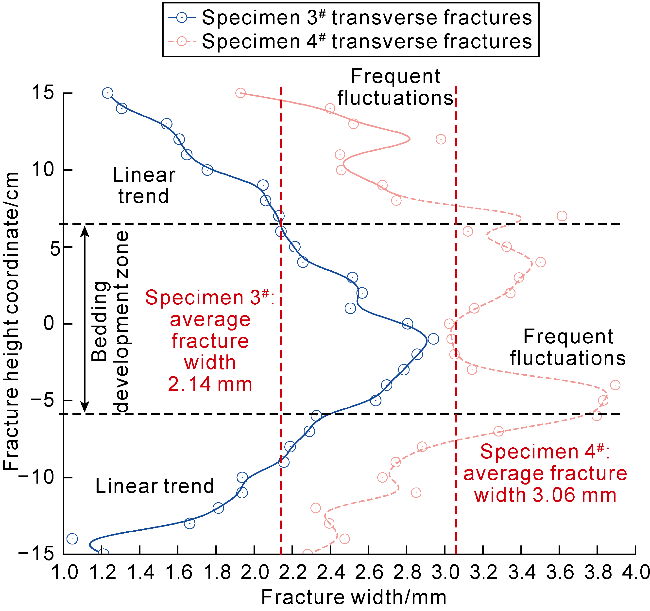
Fig. 17. Fracture width in the fracture height direction for Specimens 3# and 4#. |
3. Fracturing curve characteristics
Considering experimental boundary effects comprehensively, validation was performed using the fracture pressures from Stage 2 for Specimens 3# and 4#. The absolute error between the model-calculated fracture pressures by Eqs. (7) and (8) and the measured fracture pressure is less than or equal to 0.55 MPa, and the relative error is below or equal to 4.40% (Table 6). Thus, this model is highly accurate and can meet the requirements for variable pumping-rate pressure analysis in this study.
Table 6. Comparison of model results and actual values |
| Specimen No. | Pumping-rate mode | Measured fracture pressure/MPa | Calculated fracture pressure/MPa | Absolute error/MPa | Relative error/% |
|---|---|---|---|---|---|
| 3# | Slow lift | 7.04 | 6.80 | 0.24 | 3.41 |
| 4# | Fast lift | 11.95 | 12.50 | 0.55 | 4.40 |
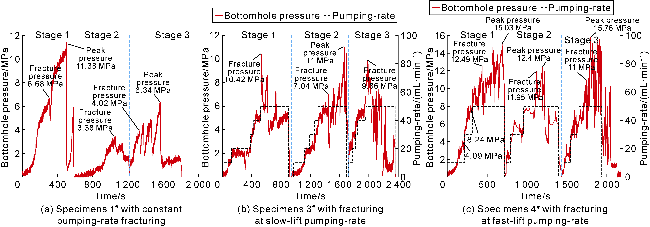
Fracturing curves exhibit distinct characteristics between constant pumping-rate and variable pumping-rate fracturing (Fig. 18). The constant pumping-rate fracturing shows rapid pressure rise, followed by intense interference after initial bedding fracture penetration, leading to reduced fracture pressure and formation of only a few main fractures. Slow-lift variable pumping-rate fracturing produces a stepwise pressure increase with minor fluctuations, promoting multi-point fracture initiation, with alternating propagation of transverse fractures and bedding fractures, forming a complex fracture network. Fast-lift variable pumping-rate fracturing exhibits steep pressure surges with significant fluctuations, often accompanied by simultaneous expansion of vertical and bedding fractures, corresponding to the wider fractures in Fig. 15. For Specimen 1# fractured at a constant pumping-rate of 50 mL/min, at Stage 1, a fracture pressure of 6.68 MPa appears at 294 s, forming near-wellbore inclined fractures. Subsequently, high pumping-rate and a low fluid loss coefficient cause pore pressure accumulation, causing bottomhole pressure to surge abruptly to 11.38 MPa, triggering large-scale activation of beddings. Stages 2 and 3 exhibit fracture pressures reduced to 3-6 MPa, indicating that the initial bedding fractures strongly interfered with subsequent fracture formation. The high fluid loss surface area coefficient suppressed branching fracture propagation, ultimately forming only two primary fractures and significantly reducing the enhanced volume. For Specimen 3# employed a stepwise pumping-rate lift with a 10 mL/(min·cycle). During the 10-50 mL/min pumping-rate lift at Stage 1, pressure rises in steps. After reaching the fracture pressure of 10.42 MPa, a ±1.5 MPa pressure fluctuation occurs during the 650-900 s constant pumping-rate phase. This reflects the simultaneous expansion of four transverse fractures and bedding fractures, forming a complex fracture network. The high filtration coefficient (CL,slow = 2.33) promots a “multiple-point fracture initiation—alternating expansion” mechanism (Fig. 16b, where acoustic emission signals alternate between sparse and dense distributions). Stages 2 and 3 retain good fracture initiation capability due to the unconnected bedding fractures at Stage 1, ultimately forming connected bedding fractures with smaller widths. For Specimen 4#, the 0-328 s interval represents Stage 1 fast-lift phase. With a pumping-rate of 20 mL/(min·cycle), bottomhole pressures at 10 mL/min and 30 mL/min were 4.09 MPa and 8.24 MPa, respectively. Upon increasing pumping-rate to 50 mL/min, the fracture pressure of 12.49 MPa was reached, followed by a 5.4 MPa pressure drop post-fracture. Due to the presence of a mineral zone at the perforation cluster location, the post-fracturing pressure gradually increased to 15.03 MPa. The artificial fracture redirects along the mineral zone, forming a vertical fracture perpendicular to the bedding plane. This vertical fracture propagates synchronously with the bedding fracture. Between 328 and 628 s, the pressure curve exhibits frequent fluctuations (±3.8 MPa). The bedding fractures and vertical fractures are interconnected through natural fractures, forming a complex fracture network. Stage 2 exhibits a fracture pressure of 11.95 MPa. When fractures initiates in perforation clusters, the complexity of fractures decreases due to the widespread bedding fractures formed in Stage 1. However, influenced by the mineral zone, the overall fracture pressure remains low, with the peak pressure decreasing by only 2.6 MPa. Stage 3 is less affected by the sweep in Stage 2, and its fracturing effect resembles that in Stage 1, achieving a peak pressure of 15.76 MPa.
Fig. 18. Fracturing curves for different pumping methods. |
4. Field application
Variable pumping-rate fracturing was pilot-tested in the No. 3 coal seam of the Mabidong Block in the southern Qinshui Basin, yielding favorable results (Table 7). Ten variable pumping-rate fracturing operations were conducted in this block using a clear water pumping-rate slow-lift method. The lift rate was 2 m3/(min·cycle), with an initial pumping-rate of 1 m3/min and a maximum pumping-rate of 15 m3/min. Variable pumping-rate fracturing was applied to 8-11 stages and 18-21 clusters in the fractured wells, with total fluid volumes ranging from 19 880 m3 to 22 265 m3 and total sand volumes from 1 615 m3 to 1 940 m3. Post-fracturing average fracture lengths reached 409.2 m, average fracture zone widths were 154.8 m, and daily gas production ranged from 11 000 m3 to 20 500 m3. In the same block, 10 typical adjacent constant pumping-rate fractured wells were fractured at 8-11 stages and 18-22 clusters, with total fluid volumes of 18 878-21 687 m3 and total sand volumes of 1 669-1 981 m3. Post-fracturing average fracture length was 329.7 m, average fracture zone width was 127.1 m, and daily gas production ranged from 3 251 m3 to 7 845 m3. It can be observed that the fracturing scale of both methods is essentially consistent. However, under equivalent scales, the variable pumping-rate fracturing wells exhibit an average fracture length 1.24 times that of the constant pumping- rate fracturing wells, an average fracture zone width 1.22 times greater, and an average daily gas production 2.2 times higher. This demonstrates the highly significant reservoir stimulation effects and enhanced production capacity of variable pumping-rate fracturing technology.
Table 7. Treatment scale and production of variable pumping-rate and constant pumping-rate fracturing wells |
| Fracturing type | Well | Number of clusters/stages | Total sand volume/m3 | Total fluid volume/m3 | Fracture zone length/m | Fracture zone width/m | Daily gas production/m3 |
|---|---|---|---|---|---|---|---|
| Variable pumping-rate | MP79-3-3U | 8/18 | 1 780 | 19 880 | 442 | 146 | 12 000 |
| QS12P4L | 10/18 | 1 619 | 20 102 | 343 | 113 | 10 000 | |
| Z3P6-1L | 11/19 | 1 740 | 17 494 | 386 | 127 | 11 900 | |
| Z3P6-3L | 11/21 | 1 940 | 18 921 | 524 | 219 | 20 500 | |
| Z24P7-2L | 10/19 | 1 940 | 22 265 | 481 | 198 | 16 800 | |
| Z24P7-4L | 9/18 | 1 621 | 22 265 | 363 | 120 | 11 200 | |
| ZS30P1-1L | 10/20 | 1 940 | 17 526 | 465 | 206 | 18 200 | |
| ZSP8-6L | 9/18 | 1 619 | 22 265 | 359 | 118 | 11 000 | |
| Z24P11-1L | 9/18 | 1 648 | 17 494 | 386 | 127 | 11 900 | |
| Z24P11-2L | 9/18 | 1 905 | 17 926 | 343 | 113 | 15 800 | |
| Constant pumping-rate | Z12-3-2U | 9/19 | 1 883 | 18 947 | 341 | 152 | 7 845 |
| MP28-3-3U | 10/18 | 1 783 | 19 670 | 307 | 120 | 3 251 | |
| MP78-3-2U | 10/20 | 1 763 | 18 878 | 298 | 92 | 6 400 | |
| Z1P2-1L | 10/20 | 1 800 | 19 381 | 289 | 121 | 5 408 | |
| Z4P1-1L | 10/22 | 1 747 | 21 424 | 293 | 124 | 7 487 | |
| Z4P8-3L | 10/21 | 1 981 | 20 990 | 366 | 126 | 5 577 | |
| Z24P7-1L | 10/19 | 1 669 | 21 687 | 373 | 141 | 5 367 | |
| Z24P11-4L | 10/19 | 1 853 | 19 669 | 344 | 115 | 5 359 | |
| ZSP8-5L | 11/20 | 1 866 | 20 699 | 378 | 140 | 5 823 | |
| Z3P6-1-2L | 10/19 | 1 837 | 20 847 | 308 | 140 | 6 207 |
Based on the spatial distribution of microseismic events from fracturing wells in this block, the fractal dimension was calculated using the box-counting method [32]. Variable pumping-rate fracturing wells exhibit an average fractal dimension of 2.46, while constant pumping-rate fracturing wells averaged 2.15. The fractal dimension positively correlates with the geometric complexity of the fracture network, indicating that variable pumping-rate fracturing creates a more complex fracture network and achieves superior enhancement effects. Variable pumping-rate fracturing wells averaged 341 microseismic events with a density of 0.77 events/m3, while constant pumping-rate fracturing wells averaged 112 events with a density of 0.25 events/m3. Variable pumping-rate fracturing exhibits higher event density, mainly in the 20-40 m zone around the wellbore, indicating active branch fracture propagation. Calculating fracture density based on microseismic event density, variable pumping-rate fracturing achieves a fracture density of 3.7 fractures/m3, while constant pumping-rate fracturing yields 1.2 fractures/m3. The variable pumping-rate fracturing density is 3.08 times that of conventional fracturing, representing a 14.4% increase in complexity.
5. Conclusions
Variable pumping-rate fracturing significantly reduces the degree of bedding activation in coal reservoirs. Due to the low shear strength of bedding planes, pumping-rate variations cause uneven pressure distribution and high fluid loss, inducing microfractures at multiple weak points near bedding planes. This results in multi-point fracture initiation, enhancing fracture network complexity and reservoir stimulation efficiency.
Pumping-rate lift rate determines coal-rock fracture width. Under equivalent treatment scale, artificial fracture widths rank from smallest to largest as follows: pumping-rate slow-lift, pumping-rate fast-lift, and constant pumping-rate fracturing. For coal reservoirs with higher rock strength, appropriately increasing the pumping-rate lift rate can prevent sand blockage caused by excessively narrow fractures. Compared to constant pumping-rate fracturing, variable pumping-rate fracturing enables more complex fracture networks: slow-lift pumping-rate produces a stepwise pressure increase with minor fluctuations, promoting multi-point fracture initiation and alternating expansion, while fast-lift pumping-rate causes steep pressure rises with significant fluctuations, facilitating the simultaneous propagation of vertical fractures and bedding fractures to form a complex fracture network.
Field variable-sequence fracturing tests confirmed that slow-pumping-rate fracturing wells achieved daily production of 11 000-20 500 m3. The average fracture length was 1.24 times that of constant-pumping-rate fracturing wells, the average fracture zone width was 1.22 times greater, and the average daily gas production was 2.2 times higher, demonstrating excellent application results.
Nomenclature
Af—fracture surface area, cm2;
c—cohesion of coal matrix, MPa;
cb—cohesion of bedding plane, MPa;
CL—fluid loss coefficient, cm3/s0.5;
CL,fast—loss coefficient during fast-pumping-rate pumping, cm3/s0.5;
CL,slow—fluid loss coefficient during slow-pumping-rate pumping, cm3/s0.5;
D—box dimension, dimensionless;
Lf,F—laboratory fracture half-length, m;
Lf,M—field fracture half-length, m;
Ls,F—laboratory stage spacing, m;
Ls,M—field fracturing stage spacing, m;
Lmax—maximum laboratory fracture half-length, cm;
Lnw—near-wellbore laboratory fracture half-length, cm;
$N(\epsilon)$—minimum number of cubes (boxes) of diameter required to cover the target object;
pf—fracture pressure, MPa;
pp—pore pressure, MPa;
pf,fast—fracture pressure during fast-lift pumping, MPa;
pf,slow—fracture pressure during slow-lift pumping, MPa;
Snw—near-wellbore fracture area, cm2;
St—total fracture area, cm2;
t—fracturing duration, s;
VL—loss pumping-rate, mL;
VL,fast—loss pumping-rate during fast-lift pumping, mL;
VL,slow—loss pumping-rate during slow-lift pumping, mL;
α1—empirical coefficient, set to 0.1, dimensionless;
α—biot coefficient, set to 0.78, dimensionless;
βs—filtration surface area coefficient of coal rock, cm;
βs,fast—filtration surface area coefficient of coal rock at fast pumping-rate, cm;
βs,slow—filtration surface area coefficient of coal rock at slow pumping-rate, cm;
θ—bedding dip angle, (°);
σh—minimum horizontal principal stress, MPa;
σH—maximum horizontal principal stress, MPa;
σn—normal stress, MPa;
σv—vertical stress, MPa;
τb—shear strength of bedding plane, MPa;
ϕ—internal friction angle of coal-rock matrix, (°);
ϕb—internal friction angle of bedding plane, (°);
$\epsilon$—cube (box) diameter, m.