

Introduction
The piedmont of southwestern Tarim Basin has a large area with abundant petroleum resources and limited exploration, making it an important field for oil and gas exploration in the Tarim Basin [1-4]. According to the hydrocarbon resource assessment during the 13th Five-Year Plan period, there estimated 4.5×10⁸ t of oil initially-in- place and 1.9×10¹² m3 of natural gas initially-in-place. This indicates the potential for the formation of substantial oil and gas fields with reserves on the scale of “billions of tons of oil and trillions of cubic meters of gas”. In June 2023, an industrial gas flow rate at nearly 8×10⁴ m3/d was first obtained from the Carboniferous-Permian carbonate rock reservoir in Well QT1 in the Wuqia structural belt in the piedmont zone. Then in January 2024, oil flow at 90 t/d and gas flow over 8×10⁴ m3/d were first obtained from the Permian Qipan Formation clastic rock reservoir in Well YT1 in the Kedong structural belt. This represents a strategic breakthrough after 47 years since the discovery of Kekeya oil and gas field in 1977. In May 2024, high yields of oil and gas at nearly 180 t/d and over 2×10⁴ m3/d, respectively, were produced from the clastic rock reservoir of the Permian Duwa Formation in Well DW1 located only 70 m far from Well YT1. These successive breakthroughs in the three target layers of Carboniferous-Permian (i.e., Carboniferous-Permian carbonate rock, Permian Qipan Formation and Duwa Formation) may change the piedmont zone from a strategic backup area to a strategic development area.
The study on oil/gas-source correlation found that the oil and gas in the Kekeya area are principally derived from the deep Permian source rocks [5-10]. In addition, according to well YT1, the Permian Pusige Formation source rocks contribute to the oil and gas found in the Carboniferous-Permian target layers [4,11]. However, the Pusige Formation source rocks are characterized by low rock-eval parameters and poor quality [3-4,11], and seem to lack the potential for large-scale hydrocarbon generation. This finding seems inconsistent with the successive exploration breakthroughs to the Carboniferous-Permian targets in the piedmont zone. The question of whether the Permian Pusige Formation source rock can be considered as the primary source rock in this region requires further comprehensive investigation.
Furthermore, the binary hydrocarbon-generation pattern established through traditional pyrolysis experiments simplistically categorizes the pyrolysis products of source rock into gaseous hydrocarbons (CH4-C5H12) and liquid hydrocarbons (C6+). Such patterns fail to adequately assess the potential and evolution patterns of light oil, condensate and wet gas [12-13], thereby significantly hindering the exploration and development of light hydrocarbon [14]. For the Carboniferous-Permian petroleum system in the piedmont of southwest Tarim Basin, the source rocks exhibit low total organic carbon content (TOC) and hydrocarbon potential (S1+S2) values. However, the hydrogen index (HI) shows considerable variation and relatively high values in some intervals, so it necessitates re-evaluation of their hydrocarbon-generation potential. The newly discovered hydrocarbons in the Carboniferous-Permian strata in the Kekeya and adjacent areas display a high proportion of light hydrocarbon, and low oil density of 0.786 1-0.872 6 g/cm3 (averaged 0.821 7 g/cm3 at 20 °C), belonging light oil. The traditional two-component model is ineffective for accurately evaluating the potential of the Pusige Formation source rocks to generate light oil or for predicting their distribution, representing a key constraint on current oil and gas exploration and deployment in this region.
Based on the current exploration status in the piedmont zone, and the studies on hydrocarbon generation from source rocks of the Permian Pusige Formation, shallow-well cores were selected to conduct pyrolysis experiments with the intent to eliminate the influences of weathered outcrops and highly mature deep cores. The composition of pyrolysis products is analyzed using a precise quantitative method for dry gas (CH4), wet gas (CH4-C5H12), light hydrocarbon (C6-C14) and heavy hydrocarbon (C14+). Hydrocarbon-generation kinetics is used to recover the hydrocarbon-generation process under geological heating conditions, and to establish the hydrocarbon-generation models for dry gas, wet gas, light hydrocarbon and heavy hydrocarbon. Finally, we investigate the hydrocarbon generation capacity of different types of oil and gas in combination with the distribution of the Pusige Formation source rocks, attempting to provide a theoretical guidance for further exploration in the piedmont of southwest Tarim Basin.
1. Regional geology
Located in the southwestern Tarim Basin, the piedmont zone is surrounded by the western part of the southern Tianshan Mountain in the north and the western Kunlun Mountain in the southwest (Fig. 1a) [15]. Based on the tectonics, it is divided into four secondary structural units: the West Tianshan Thrust Belt, the West Kunlun Thrust Belt, the Kashgar Sag and the Yecheng- Hotan Sag (Fig. 1b) [16-19]. This area constitutes a foreland basin that was formed during the Himalayan period as a consequence of the collision between the Indian and the Eurasian plates. Situated at the front zone of the right-side wedge-shaped thrust of the Pamir Salient, it experienced intense tectonic compression and obvious layered deformation [20-22]. The Paleo-Tethys Ocean was open during the Late Devonian and Permian period, which caused the development of a marine-transitional-continental sedimentary system along the southwestern margin of the Tarim Basin [23]. During the Hercynian period, the basin was located in the northern area of the Paleo-Tethys Ocean and passive continental margin. Thick Carboniferous-Permian carbonate rock was deposited at the Devonian paleo-topography [24-26]. During the deposition of the Qipan Formation, the northward subduction of the Paleo-Tethys Ocean and the tectonic uplift of the Kunlun Mountains gradually transformed the continental sedimentary environment from northwest to southeast. High-quality sandstone reservoirs of delta front were predominantly developed in the eastern part of the peripheral Kekeya area, and bay-lagoon source rocks were developed in the western Qimeigan-Kashgar Sag where there was a residual bay. During the deposition of the Pusige Formation, frequent marine transgressions led to the formation of thick, dark calcareous mudstone which acts as a large-scale marine-continental source rock. By the time of the deposition of the Upper Permian Duwa Formation, the closure of the Paleo-Tethys Ocean resulted in a complete transition to continental sediments characterized by the development of intracontinental shore- shallow lacustrine subfacies [27-28]. During the Indosinian period, the piedmonts of the West Kunlun and the West Tianshan Mountains in the Tarim Block experienced overall tectonic uplift, resulting in the absence of the Triassic strata. There are multiple Paleozoic thrust fault belts widely developed in the piedmont zone, by tectonic over-thrusting and stacking to create imbricate thrust structures [29-30].
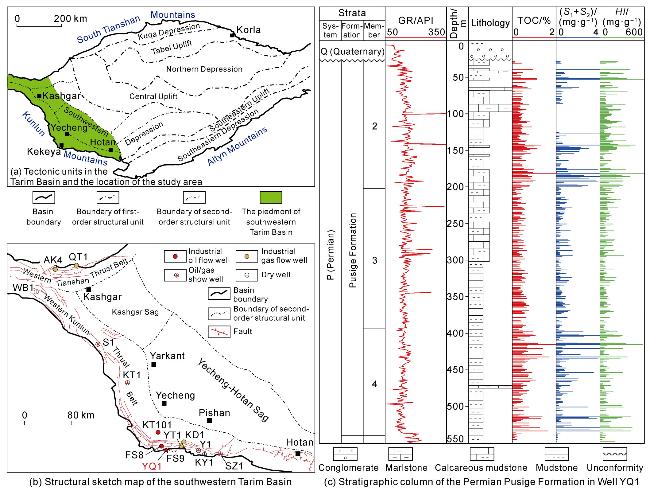
The Permian Pusige Formation in the piedmont zone contains thick dark-gray calcareous mudstone and argillaceous limestone that cover an area of approximately 12×104 km2. The Kekeya and peripheral areas are the hydrocarbon-generation center of the Pusige Formation source rock, covering an area of 1.0×10⁴ km2. This formation is generally over 200 m thick, even 1 000 m to the maximum, making it the primary source rock in this zone [11,31 -32]. The Permian Pusige Formation experienced two major water transformations which caused distinct vertical segmentation. It can be divided into four members from top to bottom. The organic matter is composed by types II and III, with Ro from 0.5% to 1.8% (mature to high-mature stages). Well YQ1 is located in the Wuluwusitang profile of the southern thrust nappe in the Kedong structural belt, and within the hydrocarbon-generation center of the Permian Pusige Formation source rock. Due to its position in the high part of the nappe, the first member is absent (Fig. 1c). The Permian Pusige Formation in Well YQ 1 is 513 m thick and classified into fair-to-poor source rock, with the effective thickness is only 221 m, TOC of 0.50%-3.27%, (S1+S2) of 0.1-19.3 mg/g and HI of 6-633 mg/g (Fig. 2).
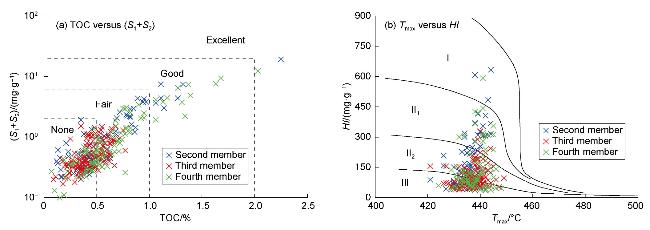
Fig. 2. Rock-Eval pyrolysis parameters of the Permian Pusige Formation source rocks in Well YQ1 in the piedmont of southwestern Tarim Basin. |
2. Hydrocarbon-generation simulation experiments
2.1. Samples and experiments
2.1.1. Samples
All samples are dark-gray calcareous mudstone taken from the Permian Pusige Formation in Well YQ 1. The Rock-Eval pyrolysis data from the samples covering the whole well section (Fig. 1) indicate the Pusige Formation source rocks at three quality levels, namely good, fair and poor (non-source rock) (Table 1, Fig. 2), and accounting for 6.2%, 36.9% and 56.9%, with average TOC values of 1.45%, 0.66% and 0.35%, respectively. To comprehensively evaluate their hydrocarbon-generation potential, representative samples (YQ1-1, YQ1-2 and YQ1-3) were selected based on their average TOC values to conduct pyrolysis experiments. The Ro of sample YQ1-1 containing Type I organic matter from the second member of the Pusige Formation is approximately 0.76%, that of sample YQ1-2 containing Type II1 organic matter from the fourth member is about 0.72%, and that of sample YQ1-3 containing Type III organic matter from the third member is around 0.76%, based on the Tmax-Ro empirical formula [33] (Table 2).
Table 1. Classification of the Permian Pusige Formation source rocks in Well YQ1 |
| Quality of source rocks | TOC/% | Average TOC/% | Cumulative thickness/m | Representative sample |
|---|---|---|---|---|
| Good | >1.0 (6.2%) | 1.45 | 32.1 | YQ1-1 |
| Fair | 0.5-1.0 (36.9%) | 0.66 | 189.2 | YQ1-2 |
| Poor | <0.5 (56.9%) | 0.35 | 291.8 | YQ1-3 |
Note: the value in parentheses indicates the thickness proportion of the source rock. |
Table 2. Geochemical parameters of the Pusige Formation source rock samples for experiment |
| Sample | Member | Depth/m | S1/(mg•g−1) | S2/(mg•g−1) | Tmax/°C | HI/(mg•g−1) | TOC/% | Type |
|---|---|---|---|---|---|---|---|---|
| YQ1-1 | 2 | 142.8 | 0.50 | 6.90 | 440 | 511 | 1.35 | I |
| YQ1-2 | 4 | 432.3 | 0.39 | 2.20 | 438 | 319 | 0.70 | II1 |
| YQ1-3 | 3 | 274.5 | 0.04 | 0.24 | 440 | 100 | 0.24 | III |
2.1.2. Experimental methods
The hydrocarbon-generation simulation experiments were conducted using a closed gold tube, developed by the Guangzhou Institute of Geochemistry, Chinese Academy of Sciences [34]. Given that the Pusige Formation contains predominantly humic organic matter, the closed gold tube can simulate a natural hydrocarbon-generation environment to the maximum extent [35]. Kerogen isolation and the analysis of pyrolysis products (i.e. gas, light and heavy hydrocarbons) were performed at the Guangzhou Institute of Geochemistry. The thermal maturity at every temperature point was calculated by the EasyRo% model [36] based on the time-temperature relationship.
The source rock sample was crushed into powder less than 0.2 mm. After removing soluble organic matter via Soxhlet extraction and inorganic minerals using hydrochloric and hydrofluoric acids, the sample was washed using deionized water until it became neutral, and then dried at 60 °C. The final black powder is the kerogen needed for experiment. Put approximately 10-100 mg of the kerogen into a gold tube (40 mm in height, 4.5 mm in diameter and 0.25 mm wall thick) which has been sealed at one end. Purge the gold tubes with argon for 15 min, and then weld the other end and check the sealability of the tube. At least two gold tubes are prepared and placed into a stainless-steel vessel for each experiment. The experiment pressure was kept at (50±2) MPa, and the temperature was 315-600 °C. After raising from room temperature to 250 °C for 10 h, increase the experiment temperature at 2 °C/h and 20 °C/h, respectively with totally 16 temperature points. After the set temperature was reached, close the pressure valve of the stainless-steel vessel, and quickly quench it in cold water and retrieve the gold tubes.
In a special vacuum, pierce the sealed gold tube to release the gases in it, which were directly analyzed and quantified using an Agilent 6890N gas chromatograph connected with the vacuum. Light hydrocarbons were collected by cooling with liquid nitrogen and analyzed and quantified with an Agilent 7890B gas chromatograph. The residual sample in the tube was extracted by the Soxhlet extraction method. The extracted solution was concentrated through evaporation and drying, and the heavy hydrocarbons were then determined by the constant-weight method. The detailed analytical procedures are referenced from Huang et al. [37].
2.2. Yields of pyrolysis products
2.2.1. Yield of oil
The generated oil includes heavy and light hydrocarbons, and their yields show an initial increase followed by a decrease with rising temperature and thermal maturity, with variations observed in different samples (Fig. 3). For sample YQ1-1 heated at 2 °C/h, the maximum yield of heavy hydrocarbon is 508 mg/g at 375 °C (Ro = 0.99%), and the maximum yield of light hydrocarbon is 244 mg/g at 435 °C (Ro = 1.74%). Under 20 °C/h heating rate, the maximum yields of heavy and light hydrocarbons occur at 405 °C (Ro = 0.93%) and 465 °C (Ro = 1.59%), which are 464 mg/g and 242 mg/g, respectively (Fig. 3a, 3b). For sample YQ1-2 heated at 2 °C/h, the heavy and light hydrocarbon yields reach their maximum values at 360 °C (Ro = 0.86%) and 390 °C (Ro = 1.15%), which are 140 mg/g and 61 mg/g, respectively. Under 20 °C/h heating rate, the maximum values occurr at 405 °C (Ro = 0.93%) and 420 °C (Ro = 1.07%), which are 143.0 mg/g and 63.2 mg/g, respectively (Fig. 3c, 3d). Under 2 °C/h heating rate, the yields of heavy and light hydrocarbons of sample YQ1-3 reach the maximum values at 375 °C (Ro = 0.99%) and 390 °C (Ro = 1.15%), of 25.1 mg/g and 38.5 mg/g, respectively. Under 20 °C/h heating rate, the maximum yields are observed at 405 °C (Ro = 0.93%) and 435 °C (Ro = 1.23%), of 24.5 mg/g and 39.6 mg/g, respectively (Fig. 3e, 3f). In general, source rocks with better organic matter exhibit larger yield of hydrocarbon. However, at different heating rates, the maximum yields and their corresponding thermal maturities differ significantly. This is because that at a higher heating rate, cracking occurs more rapidly but less thoroughly, resulting in lower maximum yield and corresponding to earlier Ro.
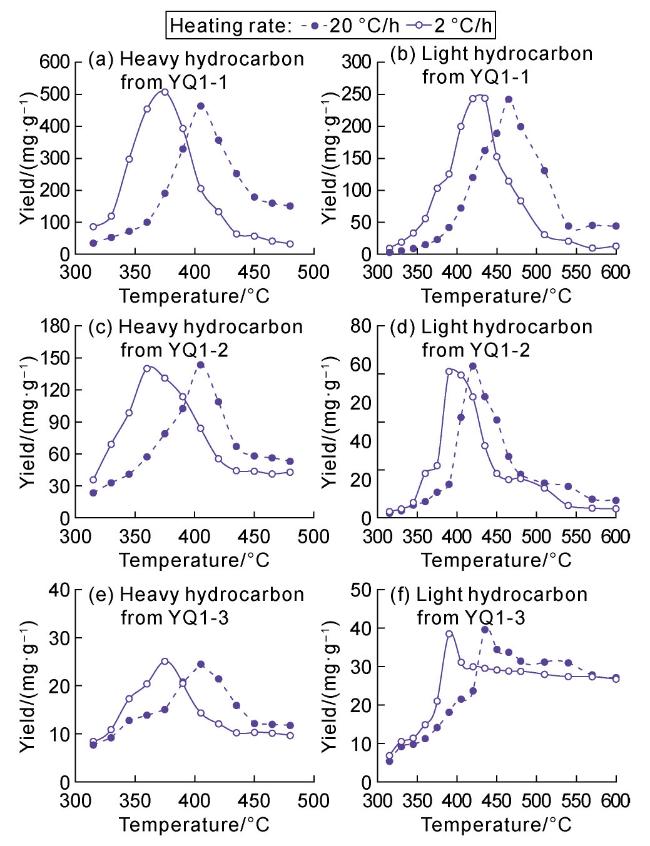
Fig. 3. Yields of heavy and light hydrocarbons versus temperature for the Pusige Formation source rock samples at three quality levels. |
2.2.2. Yield of gas
The gaseous hydrocarbons include methane (CH4), ethane (C2H6), propane (C3H8), butane (C4H10) and pentane (C5H12), of which the later four are collectively referred to as wet gas. Overall, the yield of methane shows a gradual increasing trend with rising temperature (Fig. 4a-4c), whereas the yield of wet gas initially increases and then decreases (Fig. 4d-4f). Under 2 °C/h heating rate, the methane yield of sample YQ1-1 reach 352 mg/g at 600 °C (Ro = 4.45%) and approached equilibrium (Fig. 4a). Under the same conditions, the methane yield of sample YQ1-2 reach 232 mg/g but has not yet reached equilibrium (Fig. 4b), while the methane yield of sample YQ1-3 peaked at 540 °C (Ro = 3.67%), namely 73.6 mg/g (Fig. 4c). Under 20 °C/h heating rate, the overall trends remain largely consistent with those observed at 2 °C/h, but lower maximum yields and higher temperature. For wet gas, under 2 °C/h heating rate, the maximum yields from samples YQ1-1, YQ1-2 and YQ1-3 occur at 465 °C (Ro = 2.25%), 450 °C (Ro = 1.98%), and 435 °C (Ro = 1.74%), namely 231.0, 69.3 and 18.3 mg/g, respectively. Under 20 °C/h heating rate, the maximum yields from the three samples occur at 510 °C (Ro = 2.30%), 480 °C (Ro = 1.81%), and 480 °C (Ro = 1.81%), respectively (Fig. 4d-4f), and these temperatures are consistently higher than those observed at 2 °C/h.
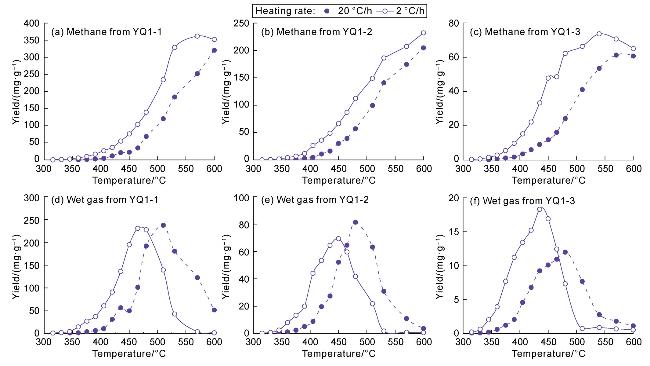
Fig. 4. Yields of methane and wet gas versus temperature for the Pusige Formation source rock samples at three quality levels. |
2.3. Kinetic features for hydrocarbon generation
The hydrocarbon generation process of kerogen is usually described by multiple parallel first-order kinetic models. After inputting the yields of heavy hydrocarbon, light hydrocarbon, wet gas and methane at different temperature and 2 °C/h and 20 °C/h heating rates into the Kinetic 1998 software, their transformation ratios, pre-exponential factor (A) and activation energy (Ea) distribution were automatically calculated.
2.3.1. Kinetic features for oil generation
For the heavy hydrocarbon from sample YQ1-1, the pre-exponential factor is 1.0×10¹² s−1, and the activation energy ranges from 175 kJ/mol to 200 kJ/mol (Fig. 5a). The main activation energy is 197 kJ/mol, accounting for approximately 92% in total and indicating a highly concentrated generation process for heavy hydrocarbon dominantly, which is associated with the better organic matter. In contrast, the light hydrocarbon has a pre-exponential factor of 1.0×10¹⁴ s−1 and wider activation energy distribution (Fig. 5b) ranging from 180 kJ/mol to 250 kJ/mol, and with a mean of 223 kJ/mol. The main activation energy for light hydrocarbon is 226 kJ/mol, constituting about 54% in total.
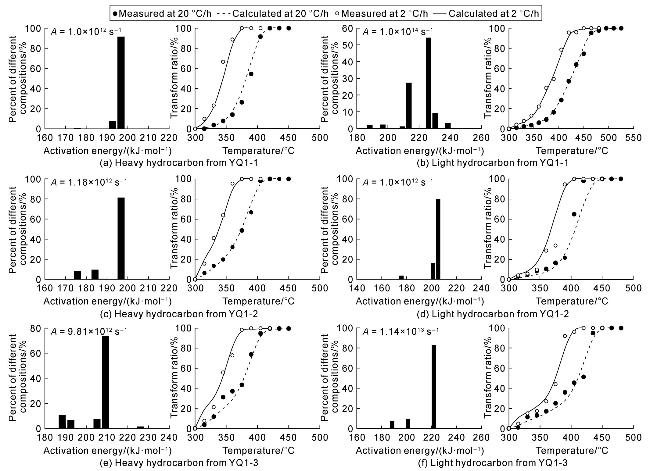
Fig. 5. Activation energy distribution and transformation ratios of heavy and light hydrocarbons from the Pusige Formation source rock samples at three quality levels. |
For sample YQ1-2, the pre-exponential factor for heavy hydrocarbon is 1.18×10¹² s−1. Although classified as II1 organic matter, the activation energy distribution for heavy hydrocarbon remains relatively narrow, ranging from 175 kJ/mol to 200 kJ/mol (Fig. 5c). The main activation energy is 197 kJ/mol, accounting for approximately 81% in total. The light hydrocarbon has a pre-exponential factor of 1.0×10¹² s−1 and exhibits a relatively narrow activation energy distribution ranging from 176 kJ/mol to 205 kJ/mol (Fig. 5d). The main activation energy is 205 kJ/mol, accounting for about 80% in total, which differs significantly from the activation energy distribution observed on the light hydrocarbon from sample YQ1-1.
In comparison, sample YQ1-3 shows a pre-exponential factor of 9.81×10¹² s−1 for heavy hydrocarbon, and more dispersed activation energy distribution ranging from 188 kJ/mol to 226 kJ/mol (Fig. 5e). The main activation energy is 209 kJ/mol, constituting approximately 74% in total, which is related to the poor quality and inferior organic matter of the source rock. For its light hydrocarbon, the pre-exponential factor is 1.14×10¹³ s−1, and the activation energy distribution ranges from 188 kJ/mol to 222 kJ/mol (Fig. 5f). The main activation energy is 222 kJ/mol, representing about 83% in total.
2.3.2. Kinetic features for gas generation
Fig. 6 displays the kinetic features for methane and wet gas generation from samples YQ1-1, YQ1-2, and YQ1-3. For sample YQ1-1, methane generation is characterized by a pre-exponential factor of 1.0×10¹³ s−1 and activation energy distribution ranging from 190 kJ/mol to 290 kJ/mol, with a mean value of 256 kJ/mol (Fig. 6a). Sample YQ1-2 exhibits a methane pre-exponential factor of 5.5×10¹⁵ s−1, and activation energy distribution between 239 kJ/mol and 335 kJ/mol and a mean of 299 kJ/mol (Fig. 6c). For sample YQ1-3, the pre-exponential factor is 1.06×10¹³ s−1, and the activation energy distribution is from 193 kJ/mol to 293 kJ/mol, with a mean of 248 kJ/mol (Fig. 6e). The broad activation energy distribution for methane generation in sample YQ1-1 is primarily attributed to different methane sources at various thermal maturity stages. At lower thermal maturity, methane is mainly originated from the primary cracking of kerogen. As pyrolysis temperature and thermal maturity increase, a significant amount of methane is generated from the secondary cracking of oil. At higher maturity, wet gas begins to crack into methane. Furthermore, heating at 2 °C/h, the transformation ratio for methane from sample YQ1-1 reached 91% at 540 °C (Ro = 3.67%), which is higher than the 77% transformation ratio observed on sample YQ1-2 under the same conditions (Fig. 6a, 6c). This suggests that the fair-quality sample YQ1-2 generates less methane at higher maturity, indicating it retains some potential for methane generation at the late stage.
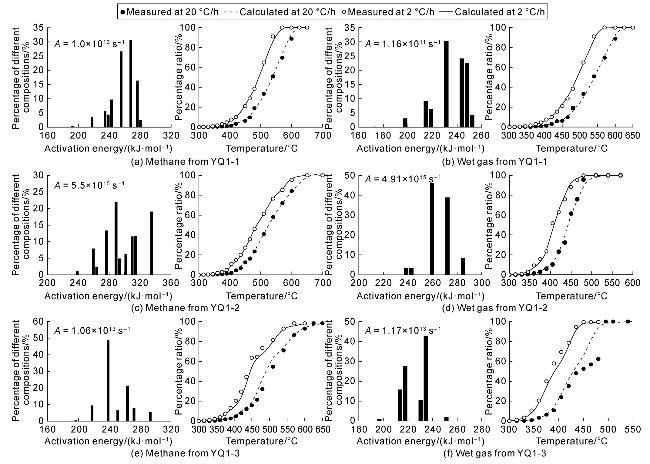
Fig. 6. Activation energy distribution and percentage ratios of methane and wet gas from the Pusige Formation source rock samples at three quality levels. |
Compared to methane, the three samples exhibit narrow activation energy distributions for wet gas, and more concentrated generation process (Fig. 6b, 6d, 6f). For sample YQ1-1, wet gas generation is characterized by a pre-exponential factor of 1.16×10¹¹ s−1 and activation energy distribution ranging from 167 kJ/mol to 247 kJ/mol, with a mean of 230 kJ/mol (Fig. 6b). Sample YQ1-2 shows a pre-exponential factor of 4.91×10¹⁵ s−1, and activation energy distribution between 214 kJ/mol and 285 kJ/mol and a mean of 265 kJ/mol (Fig. 6d). For sample YQ1-3, the pre-exponential factor for wet gas is 1.17×10¹³ s−1, and the activation energy distribution ranges from 188 kJ/mol to 251 kJ/mol and a mean of 226 kJ/mol (Fig. 6f). The main difference is that the poor-quality sample YQ1-3 demonstrated narrower activation energy distribution and a higher transformation ratio for wet gas. For instance, at 450 °C (Ro = 1.98%) and heating at 2 °C/h, the transformation ratios of wet gas for the three samples are 21% (Fig. 6b), 88% (Fig. 6d) and nearly 100% (Fig. 6f), respectively.
2.4. Hydrocarbon-generation processes under geological heating conditions
Based on the kinetic parameters of hydrocarbon generation by different samples, the generation processes of heavy hydrocarbon, light hydrocarbon, wet gas and methane from the Pusige Formation source rocks in the piedmont of southwestern Tarim Basin were extrapolated and simulated under geological heating conditions (2.5 °C/Ma) (Fig. 7). According to the classification by Pepper and Corvi [38], the peak of hydrocarbon generation takes place at the transformation ratio of 10%-90%. The peak generation stages for the four components in the three samples are shown in Fig. 7. Under the geological heating rate of 2.5 °C/Ma, significant differences exist in the peaks of four components from three samples (Fig. 7), which may be related to their organic matter types. At the same geological heating rate, sample YQ1-2 generate oil earlier, and at lower temperature and thermal maturity than sample YQ1-1. The temperature and maturity ranges for the peak heavy hydrocarbon stage of sample YQ1-2 are wider, but the ranges for light hydrocarbon are narrower. In terms of wet gas generation process, the hydrocarbon generation peak occurs earlier for sample YQ1-3, while that ends later for sample YQ1-1. It is noteworthy that the methane generation peak for sample YQ1-3 ends at Ro = 2.48%, and that ends at Ro = 3.55% for sample YQ1-1, but sample YQ1-2 still has a considerable methane generation potential at higher thermal maturity (Fig. 7).
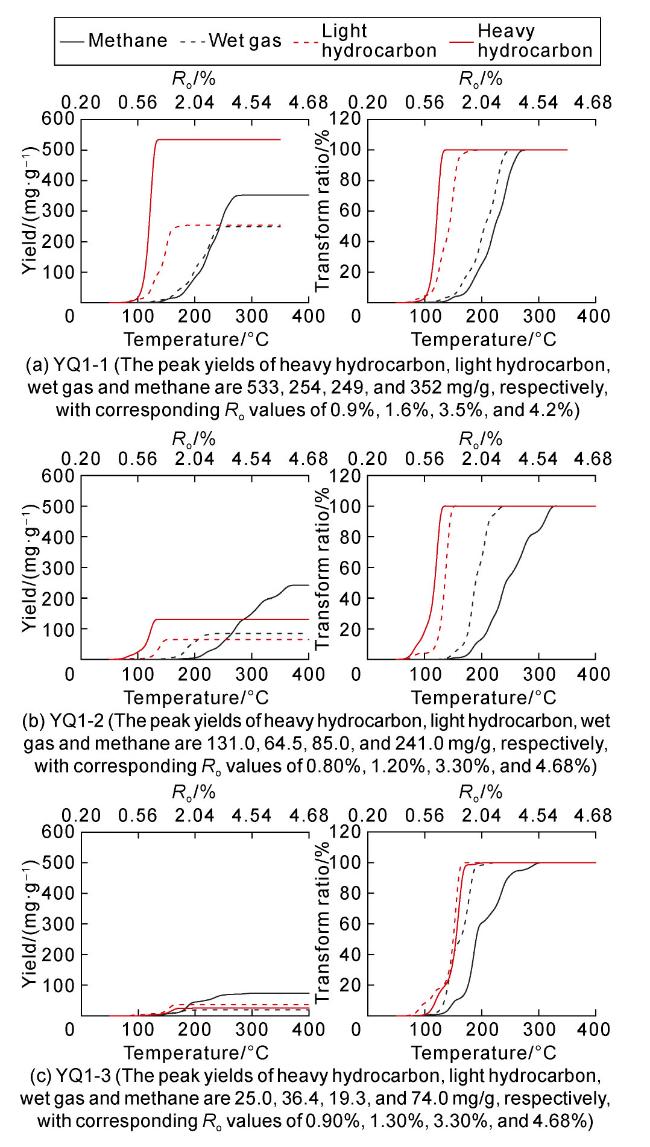
Fig. 7. The generation histories of methane, wet gas and light and heavy hydrocarbons of the Pusige Formation source rock samples at three quality levels under 2.5 °C/Ma heating rate. |
2.5. Multi-component hydrocarbon-generation patterns of the Pusige Formation source rocks
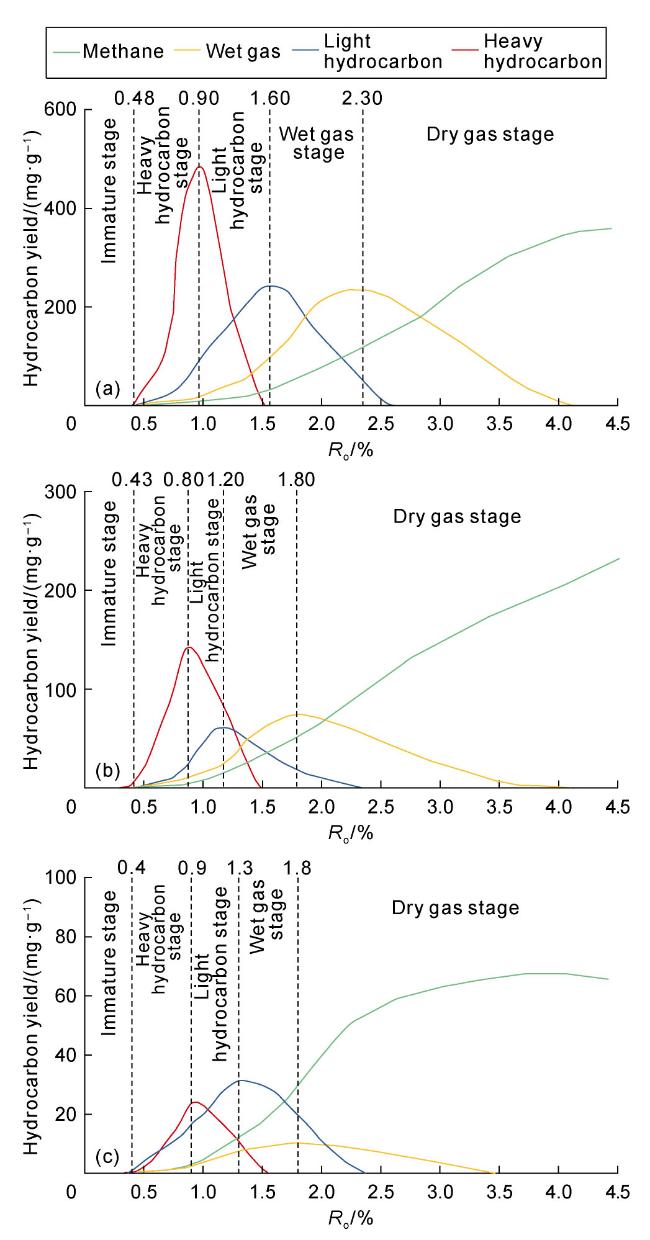
Based on the hydrocarbon-generation evolution (Figs. 3 and 4), this study establishes multi-component hydrocarbon-generation patterns for the Pusige Formation source rocks, involving five stages: immature, heavy hydrocarbon, light hydrocarbon, wet gas and dry gas (Fig. 8). The maturity corresponding to the five stages varies significantly depending on the type of organic matter.
Fig. 8. Hydrocarbon-generation patterns for the Permian Pusige Formation source rocks with different types of organic matter. |
For sample YQ1-1 with type I organic matter, the kerogen is rich in long-chain aliphatic structures and exhibits concentrated activation energy distribution. The generation process is continuous and the peak value is distinct. Heavy and light hydrocarbons are generated in large quantities successively within a relatively narrow thermal maturity range. The corresponding Ro values for heavy and light hydrocarbons are 0.48%-0.90% and 0.90%- 1.60%, respectively (Fig. 8a). The content of long-chain aliphatic compounds for type II1 kerogen is lower than that for type I kerogen. By contrast, sample YQ1-2 with type II1 organic matter exhibits early generation of heavy and light hydrocarbons but with lower yields (Fig. 8b). The Ro ranges for heavy and light hydrocarbons are 0.43%-0.80% and 0.80%-1.20%, respectively. For sample YQ1-3 containing type III organic matter, the kerogen is more aromatic, has a low HI value, and wider activation energy distribution, leading to generally low oil yield. The Ro ranges for heavy and light hydrocarbons are 0.40%- 0.90% and 0.90%-1.30%, respectively (Fig. 8c). Overall, high-quality organic matter type leads to a more concentrated oil generation process and a higher peak yield, but low-quality organic matter starts oil generation earlier but with lower oil yield.
Wet and dry gas is the result from primary kerogen cracking and secondary oil cracking. The peak of wet gas generation generally occurs between the stage of declining light hydrocarbon yield and the stage of substantial dry gas generation. The abundant liquid hydrocarbons generated earlier from type I kerogen provide sufficient material for wet gas generation, resulting in a high gas yield and a prolonged wet gas stage (Ro is 1.6% to 2.3%) for sample YQ1-1. The Ro ranges for wet gas from samples YQ1-2 and YQ1-3 are 1.2%-1.8% and 1.3%-1.8%, respectively. Because the activation energy distribution for wet gas from sample YQ1-2 is more concentrated than that for sample YQ1-1 (Fig. 6b, 6d), the wet gas yield reaches its maximum when the light hydrocarbon yield decreases significantly (Fig. 8b). The light hydrocarbons generated by samples YQ1-2 and YQ1-3 undergo cracking earlier, causing that these samples enter and exit the wet gas stage earlier than sample YQ1-1 (Fig. 8). However, for sample YQ1-3 with type III organic matter and low HI, the wet gas yield is low and mainly from primary kerogen cracking. Methane sources vary at different maturity stages. In the early stage, it is almost originated from kerogen cracking. As maturity increases, the cracking of heavy and light hydrocarbons and wet gas also contributes significant dry gas. When Ro exceeded 2.3%, sample YQ1-1 entered the dry gas stage, and its maximum dry gas yield is higher than those of samples YQ1-2 and YQ1-3, related to its better organic matter. When Ro exceedes 1.8%, samples YQ1-2 and YQ1-3 begin to generate dry gas, but with relatively low yields. This is primarily attributed to the low content of liquid hydrocarbon generated earlier, which results in a low potential for late gas generation.
3. Geological implications
3.1. Effect of the multi-component hydrocarbon-generation pattern on resource assessment
Based on the types of discovered oil reservoirs, it is evident that the burial depth and thermal maturity of source rocks vary significantly in different areas in the southwestern Tarim Basin. Coupled with intense tectonic activities, including folding, compression and fracturing, the types of oil reservoirs are complex, including light oil, condensate, wet gas and dry gas reservoirs [39]. The hydrocarbon-generation pattern s established by traditional pyrolysis experiments are simplistic or cannot effectively evaluate the resource potential of such diverse reservoirs. Furthermore, the types of organic matter in the Pusige Formation source rocks are diverse, predominantly types II and III, and locally type I, and exhibiting distinct hydrocarbon-generation patterns [38,40]. Samples YQ1-1, YQ1-2 and YQ1-3 with types I, II1 and III organic matter, respectively, can represent the hydrocarbon-generation characteristics of the Pusige Formation source rocks. Multi-component generation patterns for heavy hydrocarbon, light hydrocarbon, wet gas and methane have been established accordingly (Fig. 8).
With different types of organic matter, the three samples show variations in maximum hydrocarbon yield and process. The higher the HI, the larger the maximum hydrocarbon yield (Fig. 8), and indicating a stronger hydrocarbon generation potential. From the perspective of the generation process, better organic matter exhibits a more concentrated process within a short period (Fig. 8), as evidenced by narrower activation energy distribution for heavy hydrocarbon (Fig. 5a, 5c, 5e). Compared to sample YQ1-1, samples with types II1 and III organic matters (samples YQ1-2 and YQ1-3) show wider activation energy distributions for heavy and light hydrocarbons (Fig. 5), resulting in longer and less concentrated hydrocarbon-generation (Fig. 8). The poor-quality of the organic matters with types II1 and III kerogens, as well as the low total hydrocarbon yield, lead to insufficient potential of the late-stage hydrocarbon generation, causing hydrocarbon generation to end earlier. Similarly, samples containing types II1 and III kerogens enter and exit the wet gas stage earlier than the sample containing type I kerogen (Fig. 8). The activation energy distributions for wet gas from samples YQ1-2 and YQ1-3 are more concentrated than that from sample YQ1-1 (Fig. 6b, 6d, 6f). The earlier cracking of light hydrocarbons generated by types II1 and III kerogens causes these samples to enter the wet gas stage sooner than the sample with type I kerogen. The activation energy distributions for methane generation are relatively dispersed for the source rocks with different types of organic matter (Fig. 6a, 6c, 6e), primarily related to the different sources of methane at different thermal maturity stages in a closed system. Overall, better organic matter results in a later entry into the dry gas stage. This is because that samples with poor-quality organic matter have lower HI values and lower yields of heavy and light hydrocarbons. Methane is mainly originated from kerogen cracking, and a little from oil cracking. This necessitates higher temperature and maturity to meet the activation energy required for significant methane generation.
Based on the multi-component patterns for the Pusige Formation source rocks, the yields of heavy hydrocarbon, light hydrocarbon, wet gas and methane vary systematically with organic matter type, moving beyond the traditional two-component resource assessment model. The multi-component hydrocarbon-generation patterns for different types of organic matter can not only comprehensively evaluate the hydrocarbon-generation potential of source rocks, but also facilitate the accurate calculation and assessment of resources in different types of oil and gas reservoirs, which is of significance for exploration decision and well placement. (1) In petroleum exploration, multi-component generation patterns, together with reservoir evolution, can study the distributions of different oil and gas reservoirs and resources for subsequent exploration deployment. (2) When analyzing the hydrocarbon resource potential in a region, these patterns can be used to calculate the potentials of heavy hydrocarbon, light hydrocarbon, wet gas and methane separately. Therefore, the economic value of the petroleum resources in the region can be evaluated for making a development plan in the future.
3.2. Evaluation of the hydrocarbon-generation potential of low-abundance of the Permian Pusige Formation source rocks
The Permian Pusige Formation source rocks are characterized by a high calcium content and low TOC values. Different TOC values may influence their hydrocarbon-generation potentials. Samples with different TOC values show that higher organic matter abundance correlates with higher hydrocarbon yield (Fig. 8). Sample YQ1-1 with TOC of 1.35% has maximum yields of 507 mg/g for heavy hydrocarbon, 242 mg/g for light hydrocarbon, 230 mg/g for wet gas, 361 mg/g for dry gas, and totally 648 mg/g for all hydrocarbon components. Samples YQ1-2 and YQ1-3 with TOC of 0.7% and 0.24%, respectively, have maximum total hydrocarbon yields of 236 mg/g and 108 mg/g, respectively. According to the industry standard for geochemical evaluation of source rocks (SY/T 5735-2019) [41], TOC higher than 0.5% defines an effective source rock, and TOC higher than 2.0% indicates a good-quality source rock. The majority of the Pusige Formation source rocks have TOC between 0.5% and 1.0%, and averaged 0.9%, so they are fair source rocks, although a small number of samples have TOC higher than 2.0% [11,39,42]. They show no potential to generate substantial hydrocarbon. Traditional source rock evaluation primarily focuses on the organic matter abundance of high-quality source rocks, often overlooking hydrocarbon-generation kinetic parameters. According to Table 3, the geochemical indices of TOC, (S1 + S2) and HI in the Pusige Formation source rocks are poor, indicating inferior organic matter types, compared to the Jurassic source rocks in the Kuqa Depression and the Permian Fengcheng Formation in the Junggar Basin. However, in terms of kinetic parameters, the activation energy ranges from 176 kJ/mol to 198 kJ/mol, and the maximum oil/gas yield is 500 mg/g. The good-quality source rock possesses a strong hydrocarbon-generation capacity, comparable to those of the Jurassic Qiakemake Formation in the Kuqa Depression and the Fengcheng Formation lacustrine mudstone in the Junggar Basin [43-44]. Even the fair-quality source rocks have significant generation capacity, and the low-TOC, poor-quality (none) source rocks still retain certain potential.
Table 3. Organic geochemical indicators and hydrocarbon-generation kinetic parameters of source rocks from various areas [43-44] |
| Area | Formation | Organic geochemical indicators | Hydrocarbon-generation Kinetic parameters | |||||
|---|---|---|---|---|---|---|---|---|
| TOC/% | (S1+S2)/ (mg·g-1) | HI/ (mg·g-1) | Type of organic matter | Frequency factor/s-1 | Activation energy/ (kJ·mol-1) | Maximum oil yield/(mg·g-1) | ||
| Southwestern Depression, Tarim Basin | Permian Pusige | 0.5-1.0 (0.9) | 0.21-19.25 (1.77) | 50-514 (154) | II, III | 1.00×10¹² | 176-198 | 500 (closed system) |
| Kuqa Depression, Tarim Basin | Jurassic Qiakemake | 0.6-7.2 (2.7) | 0.19-39.6 (7.14) | 16-712 (183) | I, II | 7.32×10¹⁴ | 205-306 | 450 (closed system) |
| Junggar Basin | Permian Fengcheng | 0.5-2.0 (1.2) | 0.47-25.64 (9.35) | 200-400 (313) | I, II | 1.98×10¹³ | 176-239 | 420-500 (closed system) |
Note: the value in parentheses represents the average value. |
Additionally, the Pusige Formation source rocks have a high calcareous content, and the carbonate mineral content may be up to 40%. Referring to the carbonate source rock standard, the carbonate rock with TOC > 0.2% is generally classified into effective source rock [45], and has a certain hydrocarbon generation potential. This is consistent with the simulation results in this study. Similar to the Pusige Formation source rocks, the Funing Formation in the Subei Basin, the Ganchaigou Formation in the Qaidam Basin and the Fengcheng Formation in the Junggar Basin developed in saline lacustrine environments have low TOC, but deliver high hydrocarbon yields [46-48]. Therefore, traditional source rock evaluation standards may not be very effective for evaluating the potential of the Pusige Formation source rocks which are rich in calcium. This, in turn, has a subsequent impact on oil and gas exploration decisions. Despite the high calcium content and generally low organic matter abundance of the Pusige Formation source rocks in the piedmont of southwestern Tarim Basin, their great thickness, extensive distribution, and high organic matter conversion efficiency suggest they still possess the potential for large-scale hydrocarbon generation, providing a substantial material basis for hydrocarbon formation in the region.
Finally, based on the multi-component pyrolysis experiments, the hydrocarbon generation yield of the Permian Pusige Formation source rocks was estimated using the thermal simulation method. This method estimates the hydrocarbon yields of low mature source rocks of the same type at different thermal evolution stages by following the principle of kerogen pyrolysis, and using time-temperature compensation. It is an inductive method [49] following the formula as follows:
$Q_{\mathrm{ge}}=T O C \rho S H K_{\mathrm{c}} \beta_{\mathrm{HC}} \times 10^{-3}$
The Pusige Formation source rocks covering about 1.0×10⁴ km2 in the Kekeya area are 200 m to 800 m, and approximately averaged 350 m thick in the hydrocarbon generation center. The TOC values were selected according to the type of source rock (Table 1). By now no systematic study has been conducted on the original organic carbon restoration coefficient. Previous studies [50-51] concluded that the Ro is 0.5% to 1.8%, and the organic matter is almost of types II and III. Taking a restoration coefficient as 1.25, this study estimated the hydrocarbon yields based on simulation results, namely heavy oil is 225×108 t, light oil 150×108 t, wet gas 3×10¹² m3, and dry gas 6×10¹² m3 generated by the Pusige Formation source rocks in the study area (Table 4). These results far exceed the previous resource assessments, indicating a promising exploration future. Furthermore, multiplying the yield of a component by a migration-accumulation coefficient gives a rudimentary estimate of the resource [52]. The migration-accumulation coefficient is taken 2% to 5% by referring to the models for foreland basins in western China [53] and considering the actual geology in the piedmont of southwestern Tarim Basin. The light hydrocarbon resources calculated are approximately (3.0-7.5)×108 t, indicating abundant light hydrocarbon resources and substantial reserves. This suggests that this area could become a strategic base for light hydrocarbons, and provide a solid foundation for the ethylene industry in Xinjiang. Regarding contribution from different source rocks, although the high-quality source rock has the strongest hydrocarbon generation capacity, it only accounts for a very small proportion, and its contribution to heavy and light oil is only over 30%. The fair-quality source rock with moderate TOC and hydrocarbon generation capacity accounts for a large proportion, and contributes to all components by over 50%, making it a major contributor in the Kekeya area. With poor indicators like TOC, the poor/non-source rock accounts for a large proportion and with large thickness. It contributes to heavy oil by less than 10%, and to other resources by over 11%, particularly to natural gas. The hydrocarbon volume calculated is over 1×10¹² m3. Although the contribution to oil is low, the poor-/non-source rock contributes to gas significantly. This indicates that the contribution from the Pusige Formation poor/non-source rock with high-calcium content and low-abundance cannot be neglected. Source rock evaluation methods which rely solely on Rock-Eval parameters need further improvement.
Table 4. Calculated hydrocarbon-generation yields and proportions from source rocks in the Pusige Formation of study area |
| Sample | Quality of source rock | Hydrocarbon yield | |||
|---|---|---|---|---|---|
| Heavy oil/108 t | Light oil/108 t | Wet gas/1012 m3 | Dry gas/1012 m3 | ||
| YQ1-1 | Good | 84(37.3%) | 52(34.7%) | 0.36(12.0%) | 0.44(7.3%) |
| YQ1-2 | Fair | 130(57.8%) | 81(54.0%) | 2.18(72.7%) | 4.82(80.3%) |
| YQ1-3 | Poor | 11(4.9%) | 17(11.3%) | 0.46(15.3%) | 0.74(12.4%) |
| Total | 225 | 150 | 3 | 6 | |
Note: the value in parentheses represents the percentage of the resource. |
4. Conclusions
The hydrocarbon yield from the Permian Pusige Formation source rocks is significantly influenced by the abundance and type of organic matter. Higher abundance and hydrogen index (HI) could lead to a higher potential for generating oil and gas. The maximum hydrocarbon yield from the good source rock (TOC = 1.35%) is 648 mg/g, 236 mg/g from the fair (TOC = 0.70%), and 108 mg/g from the poor (TOC = 0.24%).
The activation energy distribution varies distinctly. The sample with high TOC and good quality exhibits a more concentrated oil generation process. The sample with low TOC and poor quality generates oil earlier and the activation energy distribution is wider for heavy hydrocarbon. Based on the pyrolysis experiments, multi-component hydrocarbon-generation patterns for three types of organic matter (I, II1, and III) have been established, which involve five generation stages: immature, heavy hydrocarbon, light hydrocarbon, wet gas and dry gas.
Based on the multi-component hydrocarbon-generation patterns, the heavy oil estimated is 225×108 t, light oil 150×108 t, wet gas 3×10¹² m3, and dry gas 6×10¹² m3, generated by the Permian Pusige Formation source rocks. These results confirm a high hydrocarbon generation potential and abundant light oil resources in the piedmont of southwestern Tarim Basin.
Acknowledgements
The authors appreciate Doctor Wang Qiang and Mr. Li Yong from Guangzhou Institute of Geochemistry, Chinese Academy of Sciences, for their assistance with the experimental analysis.
Nomenclature
A—pre-exponential factor, s-1;
Ea—activation energy, kJ/mol;
GR—natural gamma ray, API;
H—the thickness of source rocks, m;
HI—hydrogen index, mg/g;
Kc—original organic carbon restoration coefficient, dimensionless;
Qge—hydrocarbon yield during a geological period, t;
Ro—vitrinite reflectance, %;
S—the area of source rocks, km2;
S1+S2—hydrocarbon potential, mg/g;
Tmax—peak pyrolysis temperature, °C;
TOC—total organic carbon content, %;
ρ—the density of source rocks, t/m3;
βHC—hydrocarbon yield, kg/t.