

Introduction
Since 2014, roughly 60% of newly discovered oil and gas reserves globally have been located offshore, and deepwater to ultra-deepwater exploration accounts for about 62% of these new offshore additions [1-2]. This domain has thus become a critical frontier for growing global hydrocarbon reserves and production. In contrast to the steady breakthroughs in global deepwater risk exploration, the deepwater exploration of deep reservoirs in China remains at an initial yet rapidly developing stage. Although Well Liwan 3-1-1 achieved the first deepwater discovery in the northern South China Sea margin in 2006, deepwater deep-reservoir prediction and risk assessment still face challenges such as low seismic resolution, difficulty in predicting effective reservoirs, and high drilling complexity [3-4].
Situated in the Pearl River Mouth Basin, Baiyun Sag is one of the important deepwater exploration targets in the deepwater area of the northern South China Sea margin, China. During the deposition of the Paleogene Enping Formation, the sediment provenance system was complex, involving contributions from multiple peripheral uplifts as well as intra-sag sources. The depositional system underwent pronounced shifts in time and space, and the distribution of high-quality sand bodies was controlled by the combined influences of tectonically created accommodation, relative sea-level changes and sediment supply. With no or few wells and low seismic resolution of deep layers as constraints, it is difficult to effectively detect the contributions from different sediment sources and the evolutionary process of the Enping Formation, leading to large uncertainties in deepwater reservoir prediction and consequently hindering further exploration planning and prospect prioritization [5].
As an essential approach for sedimentology and basin analysis, source-to-sink analysis can effectively predict the distribution of reservoirs in deepwater basins and reduce exploration risk by providing an integrative framework for understanding basin filling processes [6-7]. However, for complicated targets such as the Enping Formation with deep-time, multi-source, and deepwater settings in the Baiyun Sag, the analysis of traditional source-to-sink system of single source faces numerous limitations: the incompleteness of the stratigraphic record can bias long-term sedimentation rate estimates [8-9]; mineralogical and geochemical provenance tracers often yield non-unique interpretations, increasing uncertainties in source identification [10-12]; and static data-based methods are unable to reconstruct the dynamic evolution of depositional processes [13-15]. For example, in deepwater areas with no or few wells and low-resolution seismic data, distinguishing the contributions from different sources is hardly possible, making reservoir distribution prediction in less explored areas extremely challenging. At the same time, the discontinuity of deep-time records hinder the quantitative characterization of sedimentation rates and basin filling history, and conventional approaches cannot capture how depositional systems respond to external drivers such as tectonic activity and climate change. Therefore, there is an urgent need to develop a quantitative method capable of reconstructing the spatiotemporal evolution of multi-source sedimentary systems under data-limited conditions to support reservoir prediction.
Stratigraphic forward modeling (SFM) parametrically simulates sediment release, transport, and deposition processes to dynamically reproduce the complete depositional system from source to sink. This approach can partially compensate for information gaps caused by incomplete stratigraphic records and enhance the spatiotemporal resolution of source-to-sink process characterization [16-18]. In recent years, SFM’s applicability in complex source-to-sink systems has been continuously validated, as it can capture high-frequency sedimentary variations that are difficult to detect with traditional methods, thereby more fully revealing how depositional processes respond to external drivers [19]. However, for deep-time, multi-source systems, a readily applicable workflow for dynamically tracking and quantitatively attributing each source’s sediment contribution is still lacking. Most recent studies focus on simulating sedimentary facies belts and sand bodies distribution, which makes it difficult to quantify the contributions of different provenances at different times with high resolution. The SFM model’s built-in “spatiotemporal provenance tagging” function offers a potential solution to this problem: it can assign a unique label to sediments from each source and track them through simulation, thereby providing support for quantitative analysis of multi-source contributions.
To address these challenges, this study focuses on the Paleogene Enping Formation in the Baiyun Sag in the Pearl River Mouth Basin. We construct a three-dimensional SFM model and carry out a series of quantitative simulations to reconstruct the depositional and infilling process of the Enping Formation under a complex scenario with multi-source supply and then examine the factors controlling the evolution of the sedimentary system and the distribution of potential high-quality reservoirs. This work aims to provide an operational method for predicting reservoir distribution in deepwater areas with no or few wells and low seismic resolution, and to serve as a reference for studies on basin-filling evolution in deepwater basins in the northern South China Sea margin and for deepwater exploration of deep reservoirs.
1. Regional geology and source-to-sink system
1.1. Regional tectonic and sedimentary background
As a typical passive continental margin basin, the Pearl River Mouth Basin has a structural pattern characterized by north-south zonation and east-west block segmentation (Fig. 1a) [20-21]. The Baiyun Sag, located in the southern part of the basin, has undergone continuous subsidence since the Paleogene, evolving into a large sag with a shallower northern part and a deeper southern part. Differential subsidence within the sag created a northern gentle slope belt and a southern steep faulted zone [22-26]. The Panyu Low Uplift, Yunkai Low Uplift, and Dongsha Uplift around the Baiyun Sag were the primary provenances during the deposition of the Paleogene Enping Formation (Fig. 1b). Multiple fluvial systems transported clastic sediments from these uplifts into the sag, shaping the incipient braided river deltas [27-28]. Meanwhile, the eastern margin of the Baiyun Sag was uplifted into a relatively high barrier at the end of the Eocene Wenchang Formation, which effectively blocked sediment input from the east. The process of tectonic subsidence directly shaped the basin’s paleogeography, and influenced the extent of sediment dispersal, stratigraphic thickness trend, and the timing and magnitude of sediment supply.
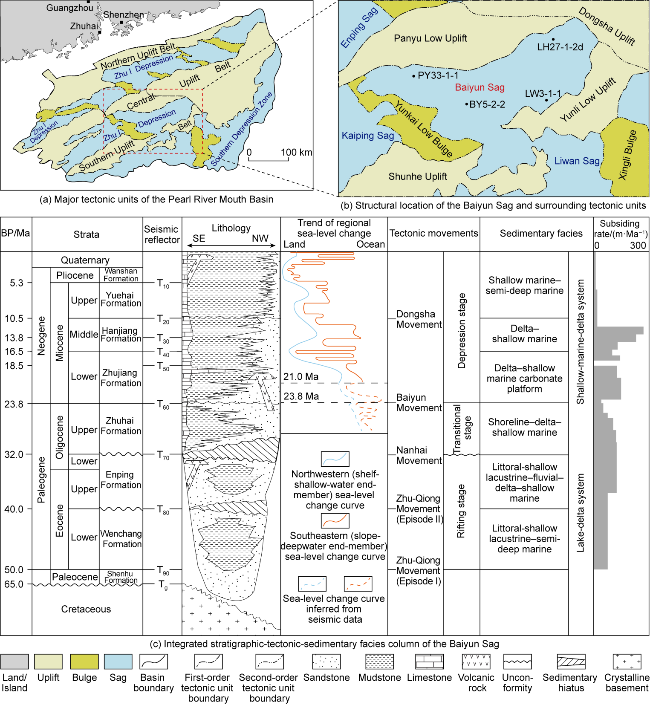
The research suggests that during Enping Formation deposition, tectonic subsidence in the Baiyun Sag can be subdivided into three stages: rift-controlled sag subsidence, continued rifting with sag segmentation, and adjustment subsidence transitioning to the post-rift phase [22]. As shown in Fig. 1c, variations in subsidence rates among these stages determined the rate and distribution of accommodation creation, which in turn influenced the sediment delivery mechanisms and depositional patterns of different sources. The coupled effects of tectonic subsidence, sediment supply, and base-level fluctuations over time collectively shaped the spatiotemporal configuration of the source-to-sink system in the Baiyun Sag.
1.2. Evolution of the Enping Formation source-to-sink system
Previous studies have preliminarily established a geological model for the source-to-sink evolution of the Paleogene Enping Formation in the Baiyun Sag by integrating the regional tectonic setting, limited well and seismic data, and provenance tracer analyses, e.g. heavy mineral assemblages and detrital zircon ages. These studies indicate that sediment supply evolved from an early “proximal, multiple-entry” configuration to a later “distal, single major source” [27-28]. Accordingly, the Enping Formation can be divided into three members— lower, middle, and upper in terms of depositional stages (Fig. 2)—each exhibiting distinctly different source-to- sink system characteristics.
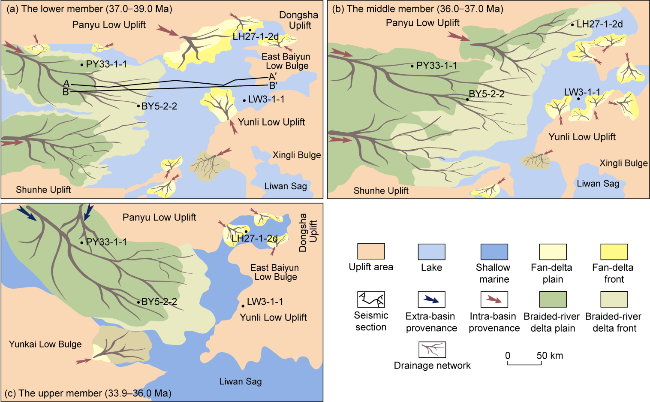
Fig. 2. Geological model of source-to-sink system for the Enping Formation: lower member (a), middle member (b), and upper member (c). |
Early Enping (the lower member): During the early stage of Enping deposition, the basin continued the detachment fault-controlled rifting pattern of the preceding Wenchang Formation and remained largely semi-enclosed as peripheral uplifts isolated the Baiyun Sag from adjacent depressions (Fig. 2a). Sediments were derived mainly from Mesozoic basement uplifts around the sag, and delivered by short, small-scale and dispersed fluvial systems. Each uplift belt developed paleo-valleys extending toward the basin interior, and small fluvial-deltaic systems formed along the sag margins [29]. Overall, the early Enping stage showed a “proximal, multiple-entry” sediment supply pattern, with the depocenter located in the central part of the sag, and near-source sediment input from the periphery producing multiple small, isolated clastic accumulations.
Middle Enping (the middle member): In the middle Enping stage, the source-to-sink system entered a transitional phase (Fig. 2b). As the depositional extent expanded, the influence of northern and northwestern sources was significantly enhanced [30-31]. During that time, the Panyu Low Uplift at the northern margin still acted as a barrier, and the distal paleo-Pearl River system had not yet connected on a large scale to the Baiyun Sag. However, the source-to-sink configuration was already shifting from dispersed peripheral inputs toward dominance by a northwestern source. Sediment supply from the southern (proximal) sources waned, leading to small fan deltas with limited scales [32]. In the northern gentle slope area, an embryonic braided river delta began to prograde into the basin, though it remained relatively small. In summary, sediment supply was becoming increasingly focused on the north, resulting in a depositional pattern intermediate between the earlier near- source, multi-provenance mode and the later far-source- dominated mode.
Late Enping (the upper member): In the late Enping stage, the source-to-sink system underwent a fundamental transformation (Fig. 2c). Tectonic activities waned and a regional transgression intensified, leading to extensive erosion and planation of the surrounding uplifts, which were gradually submerged by seawater. The northern Panyu Low Uplift began to receive sediments, establishing a connection between the Baiyun Sag and the adjacent sag to the north. A large paleovalley developed across the northwestern margin, cutting through the Panyu Low Uplift and allowing the distal paleo-Pearl River to enter the basin on a large scale [27,33]. As the basin evolved from a closed lacustrine setting into an open, shallow marine environment, a large, braided river delta system developed along the northern gentle slope. This delta prograded continuously toward the basin center, and its front had advanced to near the southern edge of the Baiyun Sag by the end of Enping deposition [25,34]. The upper Enping member stands in stark contrast to the earlier proximal, small-scale multi-source pattern: the depocenter shifted markedly northward to the northern gentle slope belt, and the sustainable input of abundant distal sediments became dominant. An extensive upward-onlapping succession of progradational sand bodies was emplaced — essentially a continuously expanding, mega-scale prograding delta system.
Although heavy mineral assemblage and detrital zircon dating analyses have provided a preliminary understanding of the Enping Formation’s source-to-sink evolution in the Baiyun Sag, important limitations remain to be addressed: (1) Multi-source discrimination: Under complex multi-source conditions, a single detrital mineral indicator or zircon age spectrum is insufficient to accurately distinguish the mixed contributions from different provenances. Such methods can only indirectly infer the dominant sediment source or cannot quantitatively characterize the relative contribution of each source. (2) Dynamic evolution and reservoir prediction: Owing to the scarcity of wells in deepwater areas and the limited resolution of deep seismic data, conventional analyses have difficulty in capturing the complete dynamic evolution of the source-to-sink system. Consequently, the spatiotemporal distribution of high-quality reservoir sandstones remains unclear. These shortcomings significantly increase the uncertainties in reconstructing the depositional history of the Paleogene Enping Formation and predicting reservoir distribution. It is therefore necessary to employ quantitative approaches such as stratigraphic forward modeling to dynamically reconstruct the source-to-sink system. Such methods can overcome the limitations of traditional techniques and provide stronger constraints for predicting the distribution of high-quality sand bodies and optimizing well placement in underexplored deepwater regions.
2. Stratigraphic forward modeling methodology and model construction
2.1. Stratigraphic forward modeling workflow
As shown in Fig. 3, the SFM-based quantitative analysis of a source-to-sink system involves the following steps: (1) Build a geological model: Based on a thorough analysis of geological and exploration data, build a 3D geological model that faithfully reflects the dynamic coupling among sources, transport channels and depositional sinks. Perform a qualitative analysis of the tectonic-sedimentary evolution of the depositional system. (2) Acquire key parameters including paleogeomorphology, major sediment sources and their supply characteristics, as well as external driving parameters such as tectonic uplift/subsidence, climate changes, and relative lake-level fluctuations. (3) Conduct forward modeling: Select an appropriate SFM program and input the above parameters to carry out numerical simulation of sedimentary processes. Different SFM algorithms have different strengths and focuses, depending on the research objective [16,18,35]. For example, the open-source model pyBadlands coupling surface diffusion with sediment transport processes can effectively simulate large-scale basin erosion-sedimentation [36-37]. Considering the extensional rift setting, multiple sediment provenances, and lacustrine-to-shallow-marine transition in the study area, this study employed a 3D SFM program that couples hydrodynamic transport and base-level changes. (4) Calibrate the modeling results: Compare the model outputs (stratal thicknesses, facies, etc.) against observed data from seismic sections, well logs, and outcrops/cores, to evaluate how well the model reproduces key sedimentary features. Following the above workflow, a complete sediment routing process can be reconstructed from the source area, through the transport channels, to the sink, and a refined 3D depositional model is established by using limited geological information.
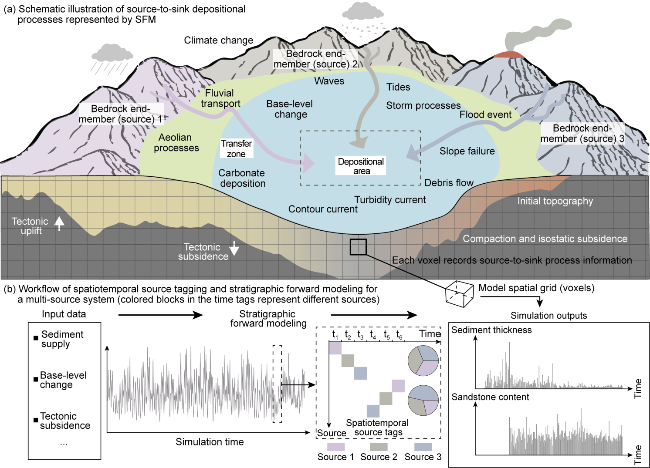
Fig. 3. Schematic diagram of the SFM-based quantitative analysis workflow for a multi-source source-to-sink system. End-member sources labeling in Fig. a (i.e., bedrock sources/sources 1-3) and entering the SFM grid (Fig. b); depositional processes include onshore transport, hydrodynamic reworking and gravity flows. Fig. b inputs parameters such as sediment supply, base-level change and tectonic subsidence, run the SFM forward simulation of erosion-transport-deposition processes, and outputs results including sediment thickness, sandstone content and contributions from each source; the variable t1-t6 in Fig. b are relative time step labels, which only indicate the chronological sequence. |
2.2. Multi-source spatiotemporal provenance tagging method
Within a properly constructed SFM model, the built-in “spatiotemporal provenance tagging” function can be utilized to precisely track and quantitatively resolve contributions from multiple sources. The core concept is to assign the sediment in the numerical simulation a unique label containing its depositional time and source information, so that the supply from each time interval and each source leaves an identifiable “marker” in the stratigraphic record [38]. In practice, without altering the model’s depositional dynamics, multiple sediment sources are injected into the model sequentially over different time intervals, and the sediment introduced in each interval is given a distinct label (i.e. a source “fingerprint”), thereby establishing a correspondence between time interval and source. This mechanism allows us to distinguish sediments from different sources and time intervals, providing a basis for quantitatively evaluating the relative contribution of each source. A multi-source model incorporating spatiotemporal source tags can intuitively reveal the source-to-sink evolutionary characteristics under complex multi-source superposition, significantly enhancing the spatiotemporal resolution of source-to- sink analysis.
As shown in Fig. 4, the spatiotemporal tagging functionality permits quantitative interpretation of a multi-source sedimentary system from multiple perspectives. For example, the pseudo well section displays changes in sediment thickness and source contribution ratio over time for multiple time intervals (Fig. 4a); the paleo-water depth section and the depositional facies maps reflect the water depth distribution, depositional environment, and changing source pathways during specific depositional stages (Fig. 4b-4d); and the paleo-water depth evolution curve records fluctuations in water depth throughout deposition, which can be used to analyze the influence of base-level changes on sand bodies deposition and migration (Fig. 4e). Additionally, if an interval lacks a particular time label, it will be a depositional hiatus in the model, reflecting a discontinuity in the actual stratigraphic record. Overall, the multi-source quantitative analysis framework enabled by spatiotemporal provenance tags represents a major advance over traditional provenance analysis, because it embeds both time and provenance information into the stratigraphic record and high-precision quantification of source contributions.
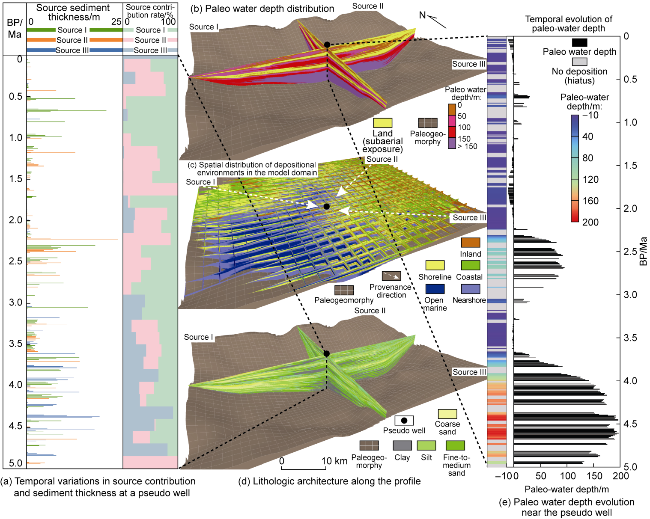
Fig. 4. Conceptual diagram of quantitative analysis of multi-source source-to-sink processes using spatiotemporal provenance tags. Panels (b)-(d) show grid-based results at the end of the simulation (end of Enping Formation deposition); brown indicates th paleogeomorphic background at the time. Panels (b) and (d) each display one representative cross-sections in the x and y directions, respectively. |
2.3. Model design and parameters
In this study, we conducted stratigraphic forward modeling of the source-to-sink system, covering a geologic time span of 33.9-39.0 Ma and corresponding to the main depositional period of the Enping Formation in the Baiyun Sag of the Pearl River Mouth Basin. For ease of comparison with actual stratigraphic divisions and to highlight the staged nature of source-to-sink evolution, the simulation included three phases—early, middle, and late—representing the early, middle, and late depositional stages, and broadly corresponding to the lower, middle, and upper members of the Enping Formation.
Based on the understanding of the geological background in the study area, a geological model was first constructed for the Enping Formation source-to-sink system (Fig. 2) to provide initial constraints for forward simulation. Previous studies have shown that during the early depositional stage of the Enping Formation, sediment supply was characterized by a near-sourced, multi-entry pattern, and the depocenter was located inside the Baiyun Sag. By the late stage, a northern distal source became dominant, the sediment supply evolved to a single distal-source pattern, and the depocenter shifted markedly to the northern part of the sag. This evolution led to the development of multi-phase, progradationally stacked delta-front sand bodies sequences (i.e. a large- scale progradational delta system) in the basin. Integrating limited well and seismic data with the above geological insights and published information, this study reconstructed the paleogeographic configuration of the basin at the early stage of the Enping deposition (about 39 Ma). The results show that the Baiyun Sag was ringed by uplifts around its margins and featured a centrally located low-lying lake basin (Fig. 5). With the western, northwestern and northern uplift zones serving as major source areas, with multiple river systems delivering sediment into the basin and forming nascent braided- river deltas. The eastern margin which was gradually uplifted with earlier deposits and reducing activities of the boundary faults became a secondary source area and influenced the subsequent migration of the depocenter and the distribution of sand bodies to some extent [27,32,39]. This paleogeographic pattern is generally consistent with the geological model results (Fig. 2), reflecting the source-to-sink system of the Enping Formation evolving from a near- and multi-source supply to a single distal source.
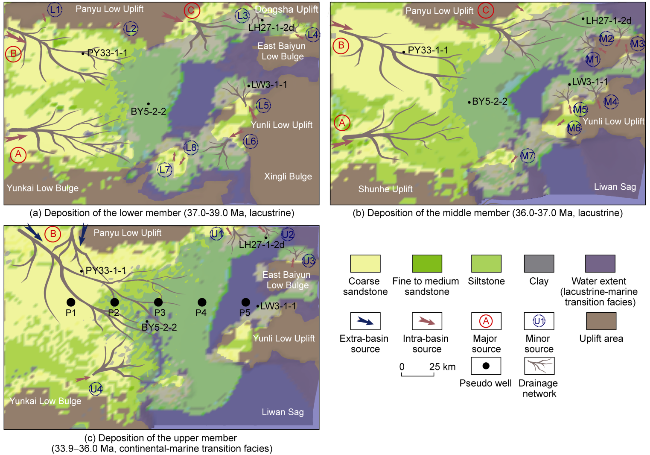
Fig. 5. Distribution of depositional systems in the lower (a), middle (b), and upper (c) members of the Enping Formation. SFM simulation results; A-C denote the three major sources, and L1-L8, M1-M7, U1-U4 are the secondary source identifiers for the lower, middle, and upper members, respectively. |
In the model, base-level changes (lake-level fluctuations) and tectonic subsidence were together treated as the drivers of accommodation creation [33]. Base-level change was implemented via climate cycle-induced lake level oscillations to reflect basin water-level rise and fall, while the amount of tectonic subsidence was estimated using an empirical approach. For each depositional phase, the total subsidence was set to approximately 1.3 times the cumulative sediment thickness and distributed uniformly over time [17,21]. These two factors together control the temporal evolution of accommodation in the basin. With the above settings, the model simulates the response of the depositional system to base-level fluctuations during the lake-to-shallow-marine transition [40] and reproduces the overall trend of variation in tectonic subsidence rate over time.
We also varied the sediment supply from the three major source areas (western, northwestern, and northern uplifts) in different time intervals by assigning time-specific source labels, such that each of the three source areas in turn became the dominant sediment supplier in a given stage (i.e. during each stage only one source provides high-intensity input, while the others maintain low-intensity background supply). This scheme simulates the evolutionary shift in sediment supply from an early multi-point, near-sourced pattern to a late single, northern distant-source dominance, consistent with the geological evidence of Enping source changes. Through label tracing, we can dynamically track the transport pathways and depositional extents of sediments from different sources, enabling the model to quantitatively assess each source’s sediment contribution rate.
Under the constraints of the paleogeography, accommodation drivers, and source supply scheme above, a 3D SFM model was built, and the depositional processes were simulated for the Baiyun Sag. The model outputs include three-dimensional quantitative information on the spatial distribution, thickness evolution, and provenance contributions of the depositional systems in all Enping members. These continuous, data-supported, process-driven insights effectively compensate for the shortcomings of the static geological model.
3. Simulation results and discussion
3.1. Enping Formation depositional evolution simulation results and model validation
The SFM simulation outputs for the lower, middle, and upper members of the Enping Formation reveal the spatial distribution of the depositional system in each stage and their evolution (Fig. 5). Overall, the depositional system evolved from an early multi-point near-sourced supply pattern to a late, single, distal northern source, with the depocenter correspondingly shifting northward. This is consistent with the geological model understanding in Section 1.2 (Fig. 2).
A quantitative comparison shows that the modeled thickness is consistent with the measured values of the three members of Enping (Fig. 6), with thickness differences mostly within ±10%, and the locations of the major depocenters, their thicknesses, and variation trends are all reasonably reproduced. This indicates that the model has accurately replicated the thickness distribution during each stage, demonstrating high confidence in its thickness predictions. Meanwhile, an observed east-west seismic section A-A° in the study area was selected for comparison (location shown in Fig. 2a). To facilitate comparison with the seismic data, the simulation results were extracted along a model section B-B° that is approximately parallel to and adjacent to A-A°. The pseudo-seismic section along B-B’ is generally consistent with the observed seismic section A-A° (Fig. 7a, 7b) in terms of the relative positions and geometries of major reflectors, and the distribution and stacking of depositional bodies (I-V) can be directly correlated between them. The B-B° pseudo-seismic section clearly exhibits progradational oblique clinoform structures, matching the observed seismic reflection characteristics. Moreover, the modeled paleo-water-depth section at B-B° (Fig. 7c) reveals the trend of water-depth change over time, consistent with the direction of facies belt migration. These comparisons show that the model accurately reproduces the internal architecture and vertical evolution of the depositional sequence. Although minor local discrepancies exist between the model and the seismic section, they are within a reasonable range and do not affect the overall match. In summary, the strong agreement between the modeled results and seismic data in terms of thickness and section validates the simulation results and provides a reliable basis for subsequent analysis.
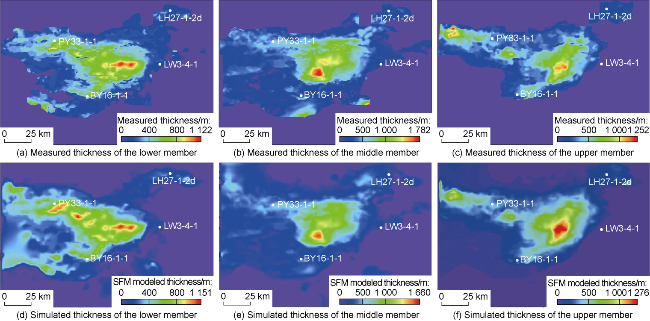
Fig. 6. Comparison between measured and SFM-simulated thicknesses of the lower, middle, and upper members of the Enping Formation, Baiyun Sag. |
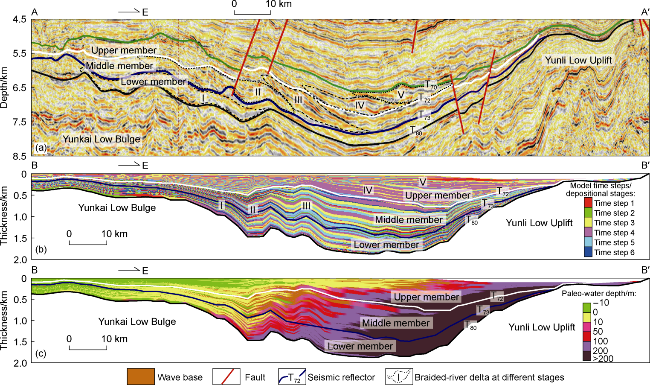
Fig. 7. Comparison of seismic section with the modeled vertical evolution of the depositional system of the Enping Formation (the section location shown in Fig. 2a). (a) Representative seismic section A-A’ (T70 not flattened), showing the main seismic reflectors and depositional units (I-V are labels for five stages of braided delta-front deposits); (b) pseudo-seismic section from the model at a nearby section (I-V correspond to those in panel (a); periods 1-6 are relative time steps within one model run, used only to indicate the sequence of deposition and not corresponding to absolute ages or formation boundaries); (c) simulated paleo-water-depth changes at the same section location. |
3.2. Spatiotemporal characteristics of multi-source sediment contributions
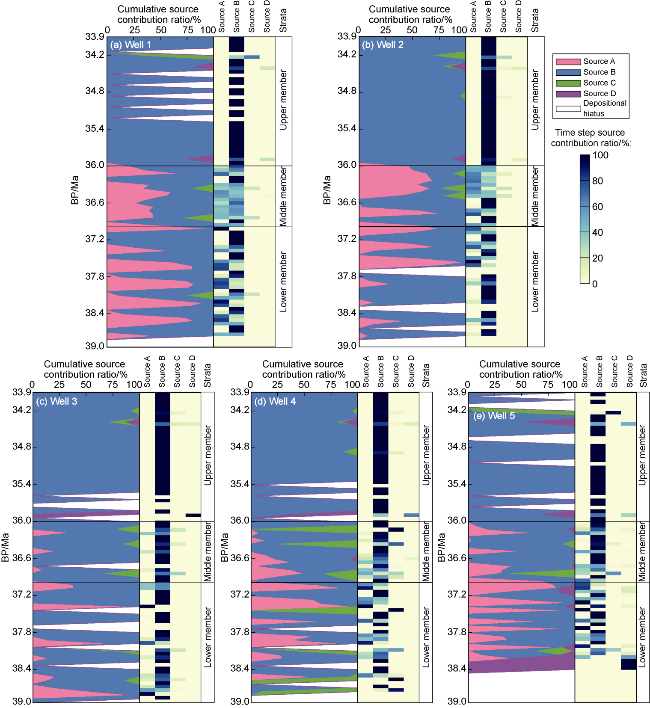
Using the model’s “spatiotemporal provenance tagging” function, the transport pathways and final deposition locations of sediments from different source areas can be tracked throughout the basin. Five representative pseudo wells (Well 1 to Well 5) were placed from proximal to distal across the Baiyun Sag (with distance from the main Source B increasing from Well 1 to Well 5; Fig. 5c), and the evolution of source contributions over time was compiled for each well (Fig. 8). In Fig. 8, sources A-C correspond to the three main sources labeled A-C in Fig. 5, and source D represents an aggregation of minor sources (the combined minor sources of types L, M, U in the lower, middle, and upper Enping Formation, respectively). In general, the proximal wells 1-3 were dominated by a single source for extended periods, whereas the distal wells 4-5 received an alternating supply from multiple sources.
Fig. 8. Temporal evolution of source contributions in five pseudo wells (see pseudo wells location in Fig. 5c). In each subfigure, the left panel is an area chart showing the changing cumulative contribution of sources A, B, C, D over time in that well (illustrating the relative composition of sources in the total sediments accumulated); the right panel is the corresponding heatmap of source contributions at each time step, with color intensity indicating the relative contribution of each source during each depositional period. Sources A, B, C correspond to the three major sources shown in Fig. 5; source D is the aggregate of minor sources (the combined L-, M-, and U-type minor sources in the lower, middle, and upper members of the Enping Formation). |
Wells 1-2 received sediments primarily from Source B, with Source A as a secondary contributor, and virtually all sediments in these wells was supplied by just these two sources (contributions from other sources are negligible). In Well 1, Source B consistently accounts for a very high proportion of the sediments (often reaching 100%), and although Source A occasionally exceeds 50%, it remains clearly subordinate to Source B overall. Well 2 is similar: Source B is dominant, while Source A has only minimal influence during a few intervals. Sediments in Well 3 are also nearly entirely derived from Source B —Source B’s contribution reaches 100% in multiple periods. Only in a few short intervals does Well 3 show small contributions from Sources A and C, and Source D remains very minor overall (though around 36 Ma showing a brief phase of increased contribution). These results indicate that in areas close to Source B, that source leveraged its locational advantage and steady supply to become overwhelmingly dominant, with other sources remaining secondary. In Fig. 8, the contribution curves for wells 1-3 are almost a single color (representing Source B), clearly illustrating Source B’s dominance during most of the depositional history.
By contrast, wells 4-5 — being farther from Source B — display a more diverse mixture of sources in the early and middle stages. In Well 4, aside from Source B, Source C is particularly prominent: Source C becomes completely dominant (100% contribution) in multiple intervals. Source A also reaches a high proportion in a couple of intervals (peaking near 90%), while Source D remains negligible. Well 5 exhibits a pronounced alternation of sources: the initial deposits are fed entirely by minor Source D, then Source A becomes dominant over several subsequent intervals, and Source B has become dominant again by the mid-late stage of deposition. Overall, well 5 experienced successive shifts in dominant source—from Source D to Source A, and later to Source B—while Source C contributed only sporadically.
This staged alternation of multiple sources indicates that in distal parts of the basin or near secondary source areas, the source supply pattern can change readily over time. When the supply from one primary source wanes or is cut off, other sources can become the main sediment providers during specific intervals. Meanwhile, different sources may also act concurrently in certain periods (e.g., sources B and C co-supplied sediments in Well 4; sources A and B supplied together in wells 1-2), creating overlapping sedimentary records. These simulation results quantitatively capture how every source’s contribution ratio varies with time, revealing the dynamic mechanisms of competition, cooperation, and alternation among sources in a complex multi-source system. This provides important insights for understanding the evolution of depositional systems fed by multiple sources.
3.3. Analysis of sedimentary controls and SFMmethod applicability
The simulation results indicate that cyclic relative sea level fluctuations are not synchronous with changes in sediment thickness, and no fixed time lag is observed between the two. At the pseudo wells, sediment thickness increases markedly only during certain intervals, whereas accumulation is subdued during most of the simulation, suggesting a weak overall correlation between relative sea-level change and sedimentation rates. This implies that relative sea level was not the primary control on sedimentation rate and thickness in the study area; the stratigraphic response to sea-level fluctuation is complex and non-linear. On the contrary, the combined influence of factors such as sediment supply rate, flow regime, and shelf-break width is likely more critical to the spatiotemporal distribution of sediment thickness in the deepwater environment [28,41]. Previous studies have pointed out that the correspondence between deepwater sand deposition and sea-level changes is far lower than traditionally assumed, with sediment transport and accumulation processes being controlled more by the stability and continuity of sediment supply pathways [42].
Compared with base-level changes, tectonic subsidence exerted a more enduring and direct influence on the depositional system. Basin subsidence dictates the rate and pattern of accommodation creation and thereby fundamentally controls sediment thickness and facies distribution. The simulated thickness trends closely match observations (Fig. 6), indicating that the evolution of accommodation under tectonic subsidence has been the key factor reshaping the regional depositional pattern. Accordingly, we infer that areas with high subsidence rates are more prone to long-term accumulation of thick sequences, whereas areas of tectonic uplift or reduced subsidence are likely to experience depositional hiatuses or thinning of sequences. The model qualitatively reproduces this pattern of depositional response to differential subsidence — in contrast to sea-level fluctuations, the tectonic subsidence backdrop more directly controlled the deposition of the Enping Formation.
Climate change affects the sedimentary record indirectly by influencing the erosion rates in source areas and sediment supply. In our simulation, climatic factors (such as rainfall and weathering) did not explicitly vary over time, but implicitly kept within relatively stable supply conditions. However, geological evidence indicates that climate fluctuations can alter the sediment yield and grain sizes in source areas, leaving identifiable signals in strata [12], and can cause reciprocal changes in the source supply rates in a multi-source system [13]. Therefore, future analyses of the sedimentary record should consider the regulatory role of climate change on sediment supply and depositional processes and incorporate relevant climate parameters into the model to fully evaluate the depositional system’s response to external drivers.
Compared with traditional methods that rely on limited static geological records to infer depositional processes, the process-based SFM approach can continuously reproduce the complete evolution from source-area erosion and sediment transport to sink-area deposition (including the dynamic changes of sediment transport pathways over time). This provides a continuous spatiotemporal filling for incomplete stratigraphic records, greatly improving the spatiotemporal resolution of source-to-sink process characterization. By using forward simulation, many high-frequency depositional variations that are difficult to discern with traditional methods can be captured [19]. This detailed spatiotemporal characterization enables us to recognize subtle processes that would be imperceptible based on the limited control points of traditional observations.
For a complex multi-source system, the SFM model’s built-in “spatiotemporal provenance tagging” mechanism assigns a unique label to sediments from every source, enabling explicit tracking of the sediment transport route and final depositional location from any source area. The model can directly output the spatial distribution of sediments across the basin and their contribution from any source area through time, allowing high-resolution quantitative identification of multi-source sediment contributions in a complex system. This advantage effectively overcomes the uncertainty and subjectivity of traditional source tracing methods, which arise due to sparse outcrop/drilling data and non-unique indicators. In this study, the multi-provenance tagging technique successfully clarified the differences in how every source contributed to filling different parts of the Baiyun Sag, providing a reliable basis for analyzing depositional processes in areas with complex provenance.
Furthermore, stratigraphic forward modeling can integrate external drivers like tectonics, base-level changes, and climate fluctuations within a unified framework. This allows researchers to adjust various driving parameters flexibly and observe the resulting depositional responses, thereby effectively identifying the primary controls on sedimentary evolution — a feat difficult to achieve with traditional static analysis. More importantly, the three-dimensional depositional data generated by SFM are internally highly self-consistent: all stratigraphic thickness and facies distributions are produced by a unified physical process simulation, avoiding the contradictions that can arise from piecing scattered evidence in traditional methods.
Of course, the forward modeling approach used in this study still has certain limitations in dynamic source-to- sink analysis. The model mainly focuses on sediment transport and deposition within the basin and represents source-area erosion processes in a relatively simplified way. This means that if a source area’s erosion rate or sediment supply undergoes substantial fluctuations while the model input remains constant, the simulation may underestimate the impact of those changes on depositional patterns. To compensate for this, one could consider coupling SFM with a topographic evolution model — for example, incorporating pyBadlands to explicitly simulate rainfall-driven erosion and river incision in the source area [36-37] — to more realistically reproduce the complete source-to-sink evolution from erosion to deposition. Building on this, the accuracy and applicability of model predictions could be further enhanced, allowing this approach to play a greater role in source-to-sink analysis and reservoir prediction in other deepwater basins.
3.4. Deepwater oil and gas exploration insights and SFM application prospect
First, the forward model successfully recreated the depositional system during each Enping Formation deposition stage, providing a basis for predicting sand bodies distribution in deepwater areas. In the late Enping stage in particular, the model reconstruction shows that after the far northern source became active, the major depocenter shifted northward into the northern deepwater part of the Baiyun Sag, and large-scale progradational deltaic sand bodies developed to a significantly expanding extent. This result is consistent with previous findings that large deltas developed during the late Enping Formation [31], implying that the northern deepwater area of the sag (far from the sediment sources) could contain extensive high-quality reservoir sand bodies, which would be key potential targets for future exploration.
Second, the model-revealed pattern of alternating contributions from multiple sources has implications for identifying subtle hydrocarbon reservoirs. The simulation shows that at different locations and times in the basin; a secondary source can dominate deposition during certain intervals. For example, around Well 5, which is far from main Source B, the initial deposits were fed entirely by minor Source D, forming a set of small, isolated sand bodies. Traditional analyses that assume a single dominant source might overlook such sand bodies contributed by secondary sources. However, given suitable trapping conditions (e.g., structural blockage or stratigraphic pinch-out), these sand bodies could still turn into effective lithologic-stratigraphic hydrocarbon reservoirs [25].
Additionally, the model highlights how source “competition” and alternation affect reservoir development: during periods when one dominant source continuously prevails, sediment composition and facies distribution are largely controlled by that single source, and the resulting sand bodies tend to have high connectivity and continuity. In contrast, during stages of interaction among multiple sources, sediments from different sources are interlayered, often forming composite sand layers of irregular thickness and distribution. Therefore, in practical exploration, the depositional areas near sources should focus on the continuous, thick sand bodies formed by long-term supply from a single source, whereas the areas far from sources should, through high-resolution stratigraphic subdivision, pay attention to composite reservoirs formed by the alternating stacking of sand bodies from different sources. When evaluating reservoir properties, one should consider differences in source, which lead to differences in sediment composition and grain sizes and thus impact reservoir porosity and permeability. The quantitative source-specific depositional information provided by the model is helpful for assessing the heterogeneity of reservoirs composed of depositional units from different sources.
Finally, the multi-source SFM forward modeling approach established in this study has important application prospect for exploration deployment in deepwater areas with sparse well data. In underexplored deepwater regions, due to limited drilling data and low resolution of deep seismic imaging, traditional facies analysis and reservoir prediction carry high uncertainty [3]. Stratigraphic forward modeling, by integrating limited seismic and well data to calibrate the model, can fill data gaps and provide quantitative or semi-quantitative predictions of depositional processes. The model-predicted 3D distribution of depositional systems and their evolution over time also compensates for the scarcity of measured data, offering a new technical means to evaluate subtle hydrocarbon traps in deepwater settings. For example, in an undrilled deepwater block, exploration wells can be preferentially deployed in locations where the model predicts greater sediment thickness or sand bodies concentration, thereby improving exploration efficiency and reducing risk. Meanwhile, the model outputs detailing every source’s sediment contribution over time provide clues for analyzing the temporal and spatial configuration of source rocks and reservoirs in deepwater areas: changes in the source supply pattern are often accompanied by a shift from sand-rich to mud-rich depositional environments, implying different hydrocarbon generation potentials and reservoir development in different stages.
4. Conclusions
This study developed and validated a new dynamic quantitative analysis method for source-to-sink systems based on stratigraphic forward modeling (SFM). Under the constraints of paleotopography, tectonic subsidence, base-level changes, and multiple sediment sources, a 3D SFM model was constructed, which reasonably reproduced the thickness distribution and depositional patterns during Enping deposition stages after being calibrated with seismic and well data. Using the model’s built-in spatiotemporal provenance tagging function, unique labels were assigned to sediments from different sources to enable precise tracking of their contributions, thus establishing a quantitative framework for analyzing the dynamic evolution of the source-to-sink system.
The simulation results reveal the spatiotemporal evolution of the Enping depositional system: during the early stage, deposition was controlled mainly by multiple proximal sources around the Baiyun Sag margins; in the middle stage, significantly increasing sediment input from northern and northwestern sources expanded the depositional extent; in the late stage, a large-scale influx from a distal northern paleo-Pearl River source into the sag formed widely distributed progradational deltaic sand bodies. This evolutionary process reflects a gradual shift in sediment supply from numerous dispersed proximal sources to a single dominant distal northern source. Quantitative source-tagging results further indicate that each source’s contribution varied markedly across different periods and locations, providing a quantitative basis for understanding the distribution of Enping sand bodies in time and space.
The extensive deltaic sand bodies developed during the late Enping stage suggest that high-quality reservoir sandstones are likely widespread in the deepwater area of Baiyun Sag. These sands are thick and well-connected, representing potential major reservoir units. Local sand bodies formed by alternating contributions from primary and secondary sources could be subtle lithologic hydrocarbon reservoirs that warrant special attention. Model analysis further reveals the main controls on Enping sand bodies development: tectonic subsidence and paleotopography primarily governed the basin’s accommodation space and depositional extent; sediment supply determined sand bodies scale and properties; and base-level fluctuations served only as a secondary modulating influence. Source tags show that the depositional areas near sources typically received deposits from a single long-lasting source, whereas the areas far from sources received deposits from alternating multiple sources, resulting in composite reservoirs. In summary, the SFM-based dynamic quantitative framework established in this study provides a process-based quantitative characterization and constraint on the deep-time evolution of source-to-sink systems. This framework offers a new technical approach for reservoir prediction in analogous underexplored deepwater basins.