

Introduction
China remains highly dependent on imported oil and gas, and the “dual-carbon” targets are promoting a transition toward green, efficient, and intelligent oil and gas development. Unconventional resources (e.g., shale oil and gas, coalbed methane and heavy oil) are characterized by large reserves but generally poor quality, wide dispersion, and difficult development, driving drilling and completion from “single-well” execution to “multi- well” coordinated operations [1-5].
The “well factory” mode, characterized by three-dimensional (3D) cluster wells, is essentially a strongly coupled two-layer system of surface platforms and multiple downhole trajectories. It is constrained by surface (e.g., feasible platform deployment area and platform size), subsurface (e.g., formation heterogeneity, faults and obstacles), and engineering (e.g. drilling extension limits, kickoff point, underground target points distribution, collision risk between wellbores, trajectory smoothness, and artificial-lift methods and related equipment placement). Platform layout and multi-trajectory optimal design interact and restrict each other, so the traditional stepwise workflow of “platform first, trajectory second” should be upgraded to a collaborative optimization scheme. How to fully capture the impact of changes in the platform-target assignment and then jointly optimize platform locations and wellbore trajectory parameters still requires further researching.
Platform planning can be represented as a mixed-integer nonlinear programming mathematical model, which is optimized by developing an appropriate solution algorithm with drilling cost, field construction investment and drilling footage minimization or production capacity maximization as objective functions, and platform location/number and platform-target assignment relationship as optimization variables. Existing methods such as graph theory, alternating location-allocation, genetic algorithms (GA), and binary linear programming have been widely studied [6-10], which are effective for small-scale and weakly coupled cases; for large-scale candidate platforms (multi-target and dynamic 3D trajectory optimization), however, challenges remain due to high dimensionality, strongly coupled constraints and uncertainty handling difficulty.
Wellbore trajectory optimization aims at determining the optimal well profile focusing on design variables such as kickoff point, reservoir section length and inclination/azimuth, in combination of directional survey calculations. The existing optimization methods such as unconstrained minimization, sequential gradient storage, and particle swarm optimization (PSO) [11-13] are well used for single-well optimization or sequential optimization of multiple wells. However, effective coordination remains difficult when multi-trajectory, multi-parameter, and multi-constraint information interactions are involved.
In this paper, a collaborative design optimization model of platform location and well trajectory was developed for the planning and design of complex-structure well factory, using platform-target matching deviation, anti-collision difficulty, total drilling footage, and trajectory complexity as objectives. A hybrid heuristic algorithm was proposed by combining an improved sparrow search algorithm (ISSA) with a directed artificial bee colony algorithm (DABC). The alternating iteration of two algorithms solves the coordinated optimization. Additionally, algorithm optimization performance, robustness, and overall search efficiency were tested and analyzed to provide a technical support for the 3D design and construction of complex-structure well factory.
1. Mathematical model
1.1. Problem formulation
The collaborative optimization of platform location and wellbore trajectory for a complex-structure well factory includes platform location/number, platform-target allocation, multi-trajectory parameters and other design variables, under the constraint of platform layout area, drilling extension limits, underground target distribution, and trajectory anti-collision difficulty, involving multiple drilling-mechanics models, such as trajectory design, trajectory complexity, collision risk and drilling extension limits.
Using a multi-objective optimization approach, this paper normalized four engineering objectives of platform-target matching deviation (f1), anti-collision difficulty (f2), total drilling footage (f3), and trajectory complexity (f4) to dimensionless indices F1, F2, F3 and F4. These indices were then weighted by coefficients ω1, ω2, ω3, and ω4 to form the system objective function F, thereby obtaining an optimal solution among all objectives. The model is given as:
1.2. Objective functions
1.2.1. Platform-target matching deviation
Platform-target matching deviation evaluates the coordination between platform control coverage and the number of assigned wells, and reflects the match between platform space utilization and well allocation strategy. Theoretically, a platform with a larger control range should be deployed with more wells to fully leverage its deployment value. However, if only the control range is considered, it may result in uneven target distribution and intersecting trajectories, reducing platform efficiency and construction flexibility. Conversely, if only the number of wells is considered, some platforms may fail to cover targets, thus increasing construction costs by requiring additional platforms. Therefore, a variance minimization based model was established to quantify the match between platform control capability and cluster well scale, thereby improving well distribution uniformity and overall deployment quality, namely:
where
1.2.2. Anti-collision risk
Anti-collision difficulty between wells is essential to safe drilling in a dense well pattern of well factory. Smaller inter-well spacing implies higher trajectory collision risk and stronger interlayer interference, resulting in higher collision-avoidance difficulty; conversely, larger spacing is beneficial to the reduction of inter-well interference, improving trajectory design feasibility and operational safety. Using the directional separation factor method [14], the anti-collision difficulty is evaluated by calculating the minimum directional separation factor of the i-th trajectory relative to other trajectories, namely:
1.2.3. Total drilling footage
Reducing drilling footage helps shorten drilling time and cost. Using the 3D trajectory design model of Sawaryn et al. [15], trajectory design variable-related data between each platform and its assigned targets can be obtained. The total drilling footage is given by the expression in Eq. (4), where Di,j is a function of , , , and :
1.2.4. Trajectory complexity
Trajectory complexity is a key indicator of drilling difficulty and depends on the tortuosity of the 3D well profile: higher tortuosity corresponds to higher drilling difficulty. Based on the trajectory potential energy principle [16], the complexity of all planned trajectories can be calculated as:
where
1.3. Constraint conditions
Constraints are divided into three categories: constraints on platform-planning variables, constraints on trajectory design variables, and constraints on the objective functions.
1.3.1. Constraints on platform-planning variables
Platform locations are constrained by surface terrain, platform area, platform control range and well allocation, ensuring that each well is uniquely assigned and avoiding duplicate allocation to the same platform. The constraints are given as:
Constraint variables include αi,j, P, (Xj, Yj), nj and Vj. (Xj, Yj) can be generated by clustering analysis methods such as k-means and Gaussian mixture model (GMM) [6], and Vj can be obtained from the trajectory design model and the drilling extension limits model. When using GMM, the center distance between the platform location (Xj, Yj) and the targets should fall within the target interval to avoid a fishhook-shaped well profile after trajectory optimization.
1.3.2. Constraints on trajectory design variables
Range limits are imposed on trajectory design variables according to platform location and geological conditions, ensuring that all assigned trajectory design variables satisfy the specified bounds. The constraints are given as:
1.3.3. Constraints on objective functions
Conditional limits are imposed on each objective function to ensure that the optimization results satisfy the specified engineering indices. The constraints are given as:
As described above, the objective functions of collaborative optimization present the characteristics of multi- constraint, multi-objective, nonlinearity, discontinuity, non-differentiability and conflicting sub-objectives, which limits the effective application of conventional optimization methods in well factory operations.
Different from conventional multi-objective optimization, collaborative optimization emphasizes information exchange, objective coordination, and algorithm interaction between platform planning and multi-trajectory optimization. During solution, all optimization variables are iteratively updated so that trajectory parameters adapt promptly to platform changes, and trajectory optimization results feed back to the platform distribution strategy to accommodate different drilling models.
2. Solution algorithm
A hybrid heuristic algorithm that combines an improved sparrow search algorithm (ISSA) and a directed artificial bee colony algorithm (DABC) was developed to solve the collaborative optimization of platform location and trajectory parameters. To enhance global search capability, a Levy flight strategy is used to replace the sentinels update in SSA, and nectar source directional information is introduced to improve the employed bee and scout bee update in DABC. On this basis, ISSA serves as the outer framework to optimize platform-target assignment, while DABC updates trajectory design parameters in the inner loop. In addition, dynamic penalty factors for anti-collision difficulty, total drilling footage, and trajectory complexity are introduced to prevent unconstrained search and promote convergence toward the optimum.
2.1. Platform planning optimization using ISSA
For platform planning, ISSA is applied as follows: (1) Each platform-target assignment scheme is encoded as a sparrow individual. Individuals are randomly initialized and extended to a high-dimensional representation to form a large dataset, which constitutes the sparrow population; (2) Each individual is substituted into the objective function to compute the fitness value; (3) Three update strategies, namely producer, follower, and sentinel strategies [17], are used to update individual positions in the population, corresponding to global search, local search, and random search in the solution space of platform-target assignments; (4) During iteration, sparrow individuals continuously adjust position parameters and share the current high-quality solutions (assignment schemes), thereby refining the assignment relationship and driving the population to converge toward the optimal region (best fitness); (5) The individual with the best fitness and its corresponding assignment scheme is taken as the optimization result.
Here, each sparrow represents an assignment scheme. Based on the assumption that the dimension of the platform-planning variables is d1 and the number of sparrows is Npop, the assignment scheme of the u-th sparrow is given as:
$\boldsymbol{G}_{u}=\left[\begin{array}{llllllll} X_{u, 1} & X_{u, 2} & \cdots & X_{u, p} & y_{u, 1} & y_{u, 2} & \cdots & y_{u, q} \end{array}\right]$
where
The elements of each sparrow are randomly permuted. Substituting Eq. (18) into Eq. (1) yields the fitness function f(Gu) for each sparrow. The producer, follower, and sentinel strategies are then applied to iteratively update Eq. (18), and the best fitness can be obtained.
Due to the randomness of the initial population, candidate solutions may become overly clustered in the later iterations, which weakens global search capability. This is mainly caused by randomness of the step-size control parameters Δβ and Δρ in the sentinel strategy. Levy flight is a special random walk that combines long range jumps and short moves, enabling natural switching between global and local search spaces and facilitating sufficient exploration toward a global optimum [18]. The improved formulation is given as:
where
$\sigma=\left\{\frac{\Gamma(1+\Delta \beta) \sin (\pi \Delta \beta / 2)}{2^{(\Delta \beta-1) / 2} \Gamma[(1+\Delta \beta) / 2] \Delta \beta}\right\}^{1 / \Delta \beta}$
2.2. Trajectory optimization using DABC
DABC adopts a data-driven strategy and uses nectar source directional information to guide decision variable updates. For trajectory optimization, design variables such as kickoff point, build-up rate, inclination/azimuth, and reservoir section length are treated as a candidate solution set, encoded as nectar sources and initialized; then employed bee local adjustment, onlooker bee following of high-quality solutions, and scout bee global search are used to adjust nectar source information [19]. During iteration, this information is continuously shared and updated to gradually improve the solutions and yield the optimal trajectory design scheme.
Setting the variable dimension as d2, and the number of nectar-sources as Nsn, the initialization of the s-th design variable hm,s in the m-th nectar-source $H_{m}=\left[\begin{array}{llllll} h_{m, 1} & h_{m, 2} & \cdots & h_{m, s} & \cdots & h_{m, d_{2}} \end{array}\right]$ is given as:
In the traditional artificial bee colony algorithm, each employed bee selects a nectar source and updates design variables by replacing r1 in Eq. (20) with rm,s (a random number in [−1, 1]). However, this update ignores nectar source directional information, which can drive the algorithm search toward worse directions and slow convergence. Therefore, following Zhu et al. [20], the current global best term hs,best is introduced to guide Hm toward a better direction, namely:
Onlooker bees select according to the employed bee strategy and retain the high fitness Gu, namely:
If the current Hm is not improved within the maximum trial limit, the conventional scout bee strategy randomly reinitializes its position using Eq. (20) to replace the local optimum. However, random reinitialization may disrupt the current convergence state and reduce search efficiency. Therefore, considering search directionality, a new scout bee strategy is given as:
2.3. Platform-trajectory collaborative optimization using ISSA-DABC
ISSA-DABC adopts a two-layer framework of “outer layer platform and inner layer trajectory”. In the outer layer, ISSA performs global search on platform planning variables. At each iteration, the geological information matched to the current assignment scheme is passed to the inner layer to obtain the allowable ranges of trajectory parameters. The inner layer takes the outer layer output as input and uses DABC to conduct guided search on trajectory design variables. Feasible solutions and threshold matching information are then returned to the outer layer to update platform-target matching deviation and platform control range. This feedback guides ISSA to adjust the search direction quickly in subsequent iterations and obtain more reasonable platform planning variables. During algorithm runs, platform planning and trajectory design variables are dynamically coordinated through information exchange to solve the well factory collaborative optimization problem.
To address persistent unconstrained conditions during optimization, after ISSA updates, the assignment scheme is first screened using constraints on platform control range and capacity. If constraints are violated, the fitness is assigned a very large value to avoid ineffective selections in subsequent iterations. After DABC updates, subobjectives including anti-collision difficulty, drilling footage, and trajectory complexity are checked again. If constraints are still violated, penalty terms are added to the corresponding subobjectives to guide candidate solutions toward correct directions. Accordingly, Eq. (1) is rewritten as:
where
Fig. 1 shows the required steps of the ISSA-DABC algorithm, including variable initialization, fitness calculation, platform-target assignment optimization, trajectory design variable update, and information feedback, as follows: (1) Parameter Input. Load model constraint parameters (Eq. (6) to Eq. (17)), optimization variables (platform planning parameter Gu, trajectory design parameter Hm) and algorithm parameters (ISSA, DABC, iteration, etc.). (2) Outer layer initialization. Use GMM clustering analysis to determine potential platform locations, and based on platform and target coordinates, generate multiple platform-target assignment sets Gu using Eq. (18). (3) Inner layer initialization. For each outer layer assignment, the geological conditions corresponding to the platform are obtained, and the constraints for trajectory design variables are defined. Generate Hm using Eq. (20), and calculate the fitness f(Gu) using the drilling models (Eq. (2) to Eq. (5)) and Eq. (1). (4) Ranking. Sort the initial population (Gu, Hm) by fitness f(Gu). Take the minimum as the current global best candidate set, and record the corresponding best objective value , best platform-target assignment , and best trajectory design variables . (5) Outer layer ISSA update. Update the platform assignment Gu using producer, follower, sentinel, and Levy flight strategies (Eq. (19)). Update the constraints on trajectory design variables using the geological information corresponding to the new assignment, and provide optimization direction for inner layer DABC. (6) Inner layer DABC update. Update all trajectory optimization variables using the employed bee strategy (Eq. (21)), and carry out constraint checking in time. Use the onlooker bee strategy (Eq. (22)) to select the current high-quality trajectories and the corresponding platform assignments . Use the scout bee strategy (Eq. (23)) to prevent the fitness from becoming stagnated during iteration (local optimum). (7) Feedback and constraint adjustment. Feed the inner layer trajectory optimization results back to outer layer constraints such as compatibility and control range, to guide ISSA to adjust the search direction and update the platform assignment. (8) Iteration. Repeat steps (5)-(7). The outer and inner layers optimize alternately and exchange information until the maximum iteration number (t=T) is reached, then terminate the calculation. (9) Output. Return the final optimal platform-target assignment Gbest, optimal trajectory design variables Hbest, and the corresponding objective values .
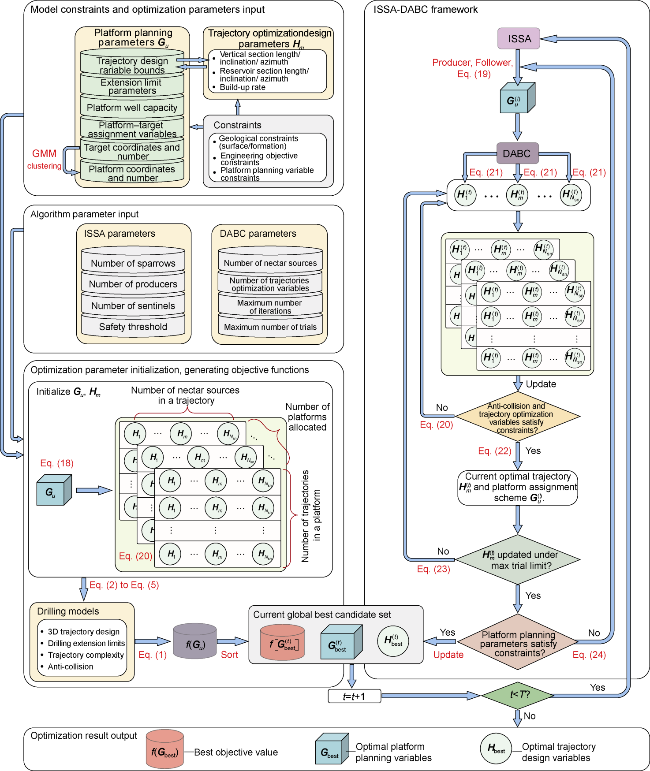
Fig. 1. Collaborative optimization framework for well factory platform location and wellbore trajectories. |
3. Case study
The S block of shale gas in southern Sichuan, China, is located in the southern Sichuan Basin. The target formation is the Upper Ordovician Wufeng Formation to the Silurian Longmaxi Formation, with a thickness of 20-80 m. The reservoir is primarily composed of organic-rich shale with good continuity. The fault orientation is generally northeast, with north-south and northwestward faults developed locally in the southern part. The maximum principal stress direction is from 295° northwest to 145° southeast. The formation dip is about 30°, and the strike is 50°-70°. Based on the target locations and reservoir azimuth from the development plan, 48 wells are planned on 6 platforms. Each well uses a double-arc trajectory design (Si=2). The on-site design scheme (pre-optimization plan) is shown in Fig. 2.
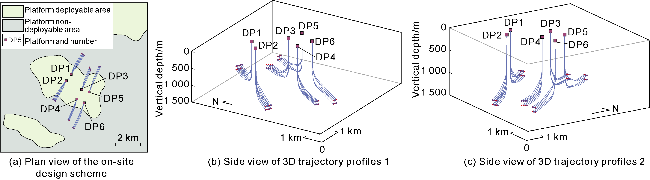
Fig. 2. On-site design scheme of the well factory in Block S. |
Based on target distribution in Fig. 2, the potential platform locations are searched using GMM clustering (Fig. 3). In this process, platform locations are required to fall within the deployable area. The horizontal section azimuth of each target should be as consistent as possible with the formation strike and perpendicular to the maximum principal stress direction. The horizontal section length of each target is 1 000-1 400 m. Algorithm parameter settings are shown in Table 1.
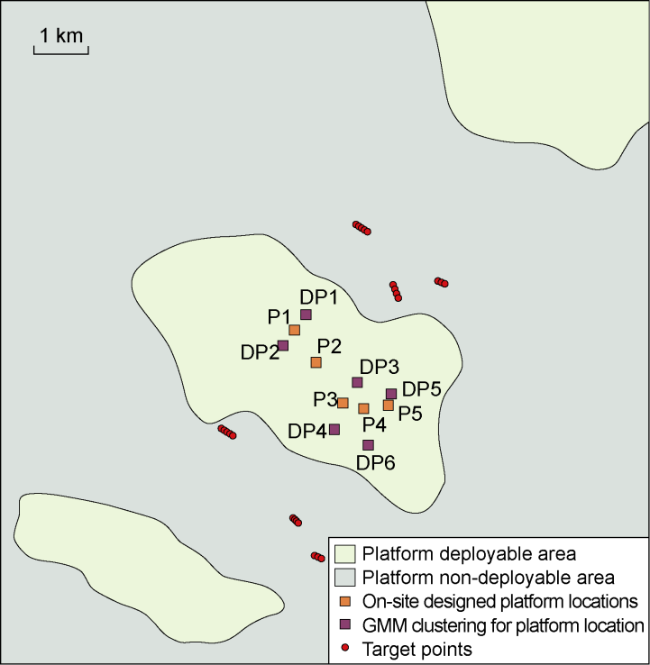
Fig. 3. GMM clustering results. |
Table 1. ISSA-DABC parameter settings |
| Parameters | Values | Parameters | Values |
|---|---|---|---|
| Number of sparrows | 1 000 | Maximum number Of iterations | 100 |
| Number of producers | 200 | Number of nectar sources | 50 |
| Number of sentinels | 200 | Number of trajectories optimization variables | 8 |
| Safety threshold | 0.6 | Maximum number of trials | 10 |
3.1. Constraint settings
Considering uncertainties across different formation intervals (e.g., faults, dip, heterogeneity, and strike), this study, based on candidate platform locations in Fig. 3 and on-site design scheme in Fig. 2b and Fig. 2c, incorporated the intervals to be avoided and sections unfavorable for trajectory adjustment into the constraints, determining the allowable ranges of trajectory design variables. This allows the deployable area and search direction to be directly constrained during optimization. For the constraint set, several parameter values are identical for Platforms P1-P5, namely: (1) Trajectory design variable constraints: target section length 1 000-1 400 m, build-up rate 2°-6°/30 m, inclination angle of kickoff points 0°-5°, inclination angle of target section 86°-92°, azimuth angle of target section 50°-70° and 210°-230°. (2) Engineering objective constraints: maximum drilling footage 4 500 m, maximum trajectory complexity 100, minimum directional separation factor is required to be greater than 1.5. The values of the other parameters are different (Table 2).
Table 2. Constraint conditions |
| Platform | Trajectory design variable constraints | Platform planning variable constraints | ||
|---|---|---|---|---|
| Vertical section length/m | Azimuth angle of kickoff point/(°) | Maximum well number | Maximum platform control range/ 1010 m3 | |
| P1 | 600-850 | 18-22 198-202 | 30 | 5.84 |
| P2 | 600-850 | 23-27 203-207 | 48 | 5.73 |
| P3 | 750-950 | 28-32 208-212 | 30 | 6.16 |
| P4 | 750-950 | 26-30 207-210 | 40 | 5.86 |
| P5 | 750-950 | 25-29 205-210 | 30 | 6.11 |
During optimization, conflicts may arise between sub-objectives, and it is necessary to first determine the weights for each sub-objective. In this study, the analytic hierarchy process (AHP) method [11] was adopted, with pairwise comparison by experts and consistency checking, to obtain a more reasonable weighting of the four sub-objectives. The calculated weighting coefficients ω1, ω2, ω3, and ω4 in Eq. (1) are 0.35, 0.40, 0.10, and 0.15, respectively.
3.2. Comparison of optimization results
Simulation tests were conducted for the collaborative optimization of platform locations and wellbore trajectories in Block S using GA, PSO, SSA and ISSA-DABC (Fig. 4). The optimization results of ISSA-DABC outperform the other three algorithms, achieving the best results in the number of platforms, well allocation balance, well depth, trajectory complexity, and anti-collision performance.
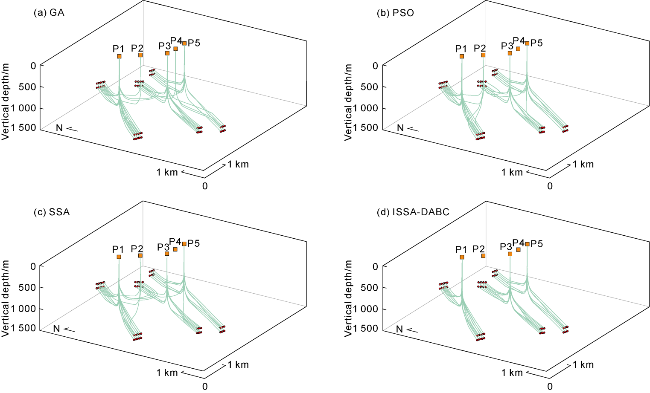
Fig. 4. Collaborative optimization results of different algorithms. |
3.3. Global optimization capability
Fig. 5 shows that GA, PSO, and SSA tend to suffer from prolonged infeasibility and become trapped in local optima during updates, whereas ISSA-DABC provides better coordination between objectives and constraints to carry out the search. To further compare the four algorithms and identify premature convergence (local optima), the objective function convergence curves (Fig. 5a), drilling footage and trajectory complexity before and after optimization (Fig. 5b, 5c), and collision risk (Fig. 5d) were analyzed. Note that collaborative optimization requires matching between parameter transfer among drilling models and the algorithm update mechanism.
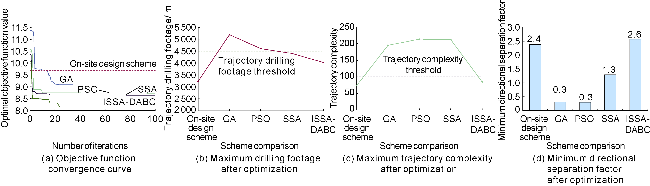
Fig. 5. Collaborative optimization performance of different algorithms. |
Fig. 5a shows that the optimized objective values of all four algorithms are lower than the initial (pre-optimization) value. ISSA-DABC reaches a stable state after approximately 25 iterations and gives the lowest objective value, improving by 15.93% compared with the on-site design plan. In contrast, the other three algorithms prematurely cluster into a local optimum or suboptimal region. The objective value shows little further improvement in the subsequent iterations, and the local optimum remains after 100 iterations. This is consistent with the unconstrained and local optimum phenomenon observed for GA, PSO, and SSA in Fig. 4, indicating that ISSA- DABC has the strongest global search capability under the problem settings and constraints of this study.
Fig. 5b and Fig. 5c show that among four optimized algorithms, ISSA-DABC is the only algorithm that satisfies both the total trajectory footage and complexity constraints, achieving the minimum values for both. SSA is the second best, while PSO and GA perform the worst. Fig. 5d shows that the minimum directional separation factor of the well group optimized by ISSA-DABC meets the constraint, and the collision risk is reduced by 7.89% compared with the on-site design scheme. In contrast, GA, PSO, and SSA show higher collision risk (with the minimum directional separation factor below 1.5). Overall, Fig. 5b-5d correspond to the convergence behavior in Fig. 5a, confirming that ISSA-DABC provides a better balance among total drilling footage, trajectory complexity, and anti-collision difficulty.
3.4. Stability evaluation
Stability and search efficiency are also important criteria for algorithm evaluation. Stability is assessed by the magnitude of the correction cost for the objective function (Eq. (24)) during search; a smaller correction cost indicates that stable solutions are easier to obtain. Search efficiency is described by computation time; a shorter time indicates faster convergence.
Table 3 records the correction cost and computational time during the search in Fig. 5a. The results show that ISSA-DABC has the lowest mean, minimum, and maximum correction costs, as well as the lowest standard deviation among the four methods, with computational efficiency comparable to that of the other algorithms. The overall performance ranking, from the best to the worst, is ISSA-DABC, SSA, PSO, GA.
Table 3. Algorithm performance evaluation |
| Algorithm | Mean | Standard deviation | Maximum | Minimum | Time/s |
|---|---|---|---|---|---|
| GA | 1.897 7 | 1.439 0 | 2.537 4 | 2.133 1 | 1 511.853 2 |
| PSO | 1.291 3 | 1.225 2 | 2.182 5 | 1.826 2 | 1 478.310 1 |
| SSA | 1.251 2 | 0.929 7 | 2.099 6 | 1.837 1 | 1 361.114 4 |
| ISSA-DABC | 0.893 1 | 0.309 8 | 1.311 0 | 0.779 3 | 2 489.790 1 |
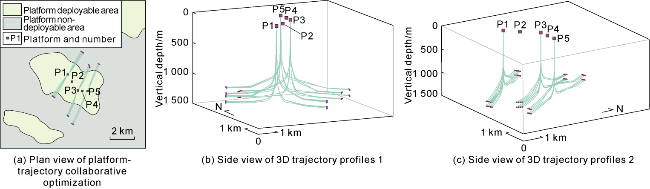
Combined with the above analysis, Table 4 presents the final optimized decision variables obtained by ISSA- DABC. After optimization, only three platforms (P1, P3 and P5) are required to deploy 48 wells successfully. This solution satisfies all the set constraints and effectively overcomes the local optimum issues commonly encountered in the traditional “platform first, trajectory second” stepwise optimization, such as “few platforms but complex trajectories” or “optimal trajectories but excessive platforms”. It balances platform layout, trajectory optimization, and engineering-geological constraints, and automatically generates a constraint satisfying global optimal platform-trajectory combination without manual intervention (Fig. 6).
Table 4. Final optimized parameters from ISSA-DABC |
| Platform | Trajectory design variables | Platform planning variables | Engineering objectives | |||||||||
|---|---|---|---|---|---|---|---|---|---|---|---|---|
| Vertical section length/ m | Target section length/ m | Build-up rate/ ((°)·(30 m)−1) | Azimuth angle of kickoff point/(°) | Azimuth angle of target section/(°) | Inclination angle of kickoff point/(°) | Inclination angle of target section/(°) | Well number | Platform control range/ 1010 m3 | Drilling footage/ m | Trajectory complexity | Minimum directional separation factor | |
| P1 | 656- 828 | 1 018- 1 052 | 2.53-4.86 | 1.9-2.5 | 88.5-89.6 | 19.1-20.7 199.4-200.5 | 56.3-58.2 226.6-227.4 | 20 | 3.83 | 3 008- 3 218 | 46-72 | >3.0 |
| P3 | 760- 914 | 1 276- 1 328 | 2.47-4.83 | 2.0-2.5 | 87.7-89.1 | 29.3-30.4 209.8-210.5 | 66.6-67.3 217.5-218.2 | 16 | 5.16 | 2 979- 3 331 | 40-70 | >2.7 |
| P5 | 768- 865 | 1 300- 1 347 | 3.21-5.08 | 2.2-2.7 | 88.3-88.7 | 26.8-27.4 206.5-207.6 | 64.3-65.7 213.8-214.5 | 12 | 4.72 | 3 226- 4 025 | 59-74 | >2.5 |
Fig. 6. Platform-trajectory collaborative optimization results. |
4. Conclusions
The ISSA-DABC hybrid algorithm applies hierarchical decomposition with “outer layer platform, inner layer trajectory” and cross layer coordination, forming a multilevel collaboration mechanism across “variables-objectives-algorithms”. It enables effective solution of the platform-trajectory collaborative optimization problem for complex-structure well factories, and mitigates the local optimum and mismatch issues often produced by the stepwise “platform first, trajectory second” workflow.
ISSA-DABC outperforms GA, PSO, and SSA in global search, convergence efficiency, and robustness. It satisfies engineering constraints on drilling footage, trajectory complexity, and anti-collision difficulty simultaneously, and automatically generates a global optimal platform- trajectory combination scheme in the whole process that satisfies all constraints, without manual intervention.
Field application confirms that ISSA-DABC reduces the objective value and collision risk significantly, while producing more reasonable number of wells on a platform, wellhead-target assignment, and 3D wellbore trajectories.
Nomenclature
Ci,j—trajectory complexity of well i assigned to platform j, dimensionless;
Cmax—upper limit of Ci,j, dimensionless;
d1, d2—dimensions of platform planning parameters and trajectory design parameters;
Di,j—drilling footage of well i assigned to platform j, m;
Dmax—upper limit of Di,j, m;
f1—platform-target matching deviation, m−6;
f2—anti-collision difficulty of the platform, dimensionless;
f3—total drilling footage, m;
f4—total trajectory complexity, dimensionless;
f(Gu), f(Gc)—fitness value of uth sparrow (candidate solution) and cth nectar source, dimensionless;
, , —fitness values at tth iteration for uth sparrow, global best, and global worst in the algorithm, dimensionless;
F—multi-objective comprehensive value, dimensionless;
F1, F2, F3, F4—normalized platform- target matching deviation, anti-collision difficulty, total drilling footage, and trajectory complexity, dimensionless;
Fs—minimum directional separation coefficient safety threshold, taken as 1.5, dimensionless;
Fs,i,j—minimum directional separation factor of well i assigned to platform j, dimensionless;
Fs,min—lower limit of Fs,i,j, dimensionless;
Gbest—global best candidate solution in ISSA;
Gc—candidate solution for the platform assignment scheme corresponding to cth trajectory;
Gu—candidate solution for the uth sparrow in ISSA;
Gworst—global worst candidate solution in ISSA;
hm,s, hc,s—s-th trajectory design variable candidate solution in the m-th and c-th trajectories of DABC;
hs,max, hs,min, hs,best—maximum, minimum, and global best candidates for the s-th trajectory design variable in DABC optimization;
—hm,s updated by employed bee and scout bee;
—hm,s after directed reset;
Hm—mth nectar source in DABC (candidate solution set for mth trajectory);
, —m-th trajectory candidate solution at tth iteration, and current global best trajectory candidate solution in DABC;
Kk,i,j—wellbore curvature of the k-th arc section for well i assigned to platform j, rad/30 m;
Kk, max, Kk, min—upper and lower bounds of Kk,i,j, rad/30 m;
lk,i,j—length of the k-th arc section for well i assigned to platform j, m;
—length of the well section (vertical section, target section) corresponding to marker point Θ for well i assigned to platform j, m;
, —upper and lower bounds of , m;
M—intermediate variable;
nj—number of wells assigned to platform j;
nj,max—upper limit of nj;
—average number of wells within the control range of selected platforms, dimensionless;
N—number of wellheads;
Npop, Nsn—numbers of sparrows and nectar sources;
P—number of selected platforms;
Pmax—upper limit of P;
r1—random numbers in [0,1];
r2, r3—normally distributed random numbers, used to construct the Levy flight step size;
rm,s—random number for the s-th candidate solution of the m-th nectar source, in [−1, 1];
R—platform deployable area;
R1(H), R2(H), R3(H)—dynamic penalty factors for anti-collision difficulty, drilling footage, and trajectory complexity, dimensionless;
Si—number of trajectory arc segments for ith well;
t—current number of iterations, t=1, 2,…, T;
T—maximum number of iterations;
Vj—control range of platform j, m³;
Vmax,j—upper limit of Vj, m³;
—average control range of selected platforms, m³;
xu,p, yu,q—target coordinates data of the u-th sparrow at the p-th position and platform data at the q-th position (constraints on potential platform coordinates, effective usable area, extension limit parameters, and trajectory design variables);
Xj, Yj—coordinates of platform j, m;
αi,j—assignment variable, αi,j=1 if well i is assigned to platform j, otherwise αi,j=0, dimensionless;
β—platform selection flag, β=1 if selected; otherwise β=0, dimensionless;
Δβ—step size distribution index adjustment, used to adjust the shape of the Levy flight step size distribution, dimensionless;
Δρ—step size scaling factor increment, used to adjust the step size for ISSA sentinel position updates, dimensionless;
ε—minimal positive number (numerical stability term, preventing the denominator from being 0 in algorithm optimization);
Γ(∙)—gamma function (Levy step size control function, enhancing global exploration);
—probability that the onlooker bee selects assignment scheme u;
τk,i,j—torsion of the k-th arc section for well i assigned to platform j, rad/30 m;
γ(t)—dynamic penalty coefficient for trajectory complexity at iteration t, dimensionless;
γ0—initial value of γ, γ0=5;
λLevy—random step size following a Levy stable distribution, dimensionless;
λ—step size adjustment factor, λ=0.3;
σ—standard different of normal random variable generated from Levy flight step size;
ξ, ς—dynamic penalty coefficients for anti-collision difficulty and drilling footage, ξ=5, ς=10;
—inclination angle of marker point Θ for well i assigned to platform j, rad;
, —upper and lower bounds of , rad;
—azimuth angle of marker point Θ for well i assigned to platform j, rad;
, —upper and lower bounds of , rad;
ω1, ω2, ω3, ω4—weight coefficients for objective functions F1, F2, F3, F4, dimensionless.
Subscripts:
c—index of a nectar source randomly selected in DABC during current search, c∈{1,2,…,N}, c≠m;
i—well number, i∈{1,2,…,N};
j—platform number, j∈{1,2,…,P};
k—arc section number of a trajectory, k∈{1,2,…,Si};
m—nectar source (m-th optimization scheme of a trajectory) number, m∈{1,2,…,Nsn};
p, q—target index and potential platform index under a platform planning scheme, p∈{1,2,…,N}, q∈{1,2,…,P};
s—candidate solution number in nectar source (component index of trajectory optimization design variables), s=1, 2, …, d2;
u—sparrow index (the u-th platform planning scheme), u∈{1,2,…, Npop};
Θ—wellbore trajectory marker point, Θ=a for kickoff point; Θ=b for target point.