

Introduction
Shale gas is an unconventional natural gas resource characterized by vast resource potential, high development difficulty, and environmentally friendly production, and it is gradually reshaping the global natural gas supply landscape [1-3]. Staged hydraulic fracturing in horizontal wells generates complex fracture networks, creating “artificial high-permeability zones and reconstructing seepage fields,” so it has become the dominant technology for the economic development of shale gas [4]. During depletion production, the dynamic closure of fracture networks results in reducing productivity and rapid production decline [5]. In contrast, pressure-controlled production is a crucial measure for production maintenance and well performance enhancement by effectively delaying fracture closure, maintaining gas transport capacity, and extending stable production [6-7].
A hydraulic fracture network typically consists of propped fractures filled with proppants and fracturing fluid near the wellbore, self-supporting fractures filled solely with fracturing fluid, and natural fractures connected at the distal ends. Self-supporting fractures usually generate during the fracturing process, but late slip and dislocate under shear effect, consequently exhibiting the self-supporting characteristics under closed stress [8]. For propped fractures, proppant type, closure stress, and proppant concentration are the primary factors influencing fracture conductivity [9-10]. The addition of proppants significantly enhances the flow capacity of induced fractures in shale and markedly reduces stress sensitivity: when effective stress was less than 15-20 MPa, fracture permeability decreased sharply by 60.16%-82.21% [11]. At 30 MPa effective stress, the permeability of propped fractures in the Changning Block declined by 40%-63.14%, whereas that of self-supporting fractures decreased by 90.0%-94.7% [12-13]. At 35 MPa, the permeability of self-supporting fractures in transitional shales at the eastern margin of the Ordos Basin was reduced by 97.1% [14]. At 55 MPa, propped fractures in the Longmaxi Formation in Fuling gas field experienced stress-induced permeability damage by 47%, while self-supporting fractures suffered as much as 87% [15]. The conductivity of self-supporting fractures increases with shear slip displacement, and is positively correlated with the fractal dimension of fracture width and inversely correlated with fracture tortuosity [16]. Lu et al. demonstrated through 3D morphology simulation that high fracture surface roughness, large shear slip displacement, and high Young’s modulus play positive roles in resisting stress-induced closure of self- supporting fractures [17]. These findings clearly indicate that, under increasing effective stress, self-supporting fractures are more sensitive than propped fractures, shown by closing faster and severer, thus exerting a greater influence on fracture network conductivity during production [18]. However, during hydraulic fracturing, tens of thousands of cubic meters of fracturing fluid is injected into the formation, and gas-water two-phase flow is universally present in the fracture network throughout the production. Previous studies have primarily focused on evaluating the conductivity of self-supporting fractures, with limited attention to the gas-water flow behavior during fracture closure. Yang et al. conducted gas-water flow experiments on shale self-supporting fractures parallel and perpendicular to bedding under different confining stresses [19], and preliminarily revealed the linear flow in micron-scale self-supporting fractures, fracture surface roughness and width, and gas-water flow ratio on two-phase relative permeability curves. Nonetheless, the intrinsic mechanisms remain unclear.
Using the deep shale cores (taken at 3 500-4 500 m) from the Luzhou Block in southern Sichuan Basin, this study conducted experiments to investigate the stress sensitivity of self-supporting fractures under reservoir temperature and pressure, and visually observed the microscopic gas-water flow within fractures in a 3D-printed shale fracture model, with the intent to elucidate the gas-water flow laws when self-supporting fractures close and propose optimal measures for pressure-controlled production plan of shale gas wells.
1. Experimental design
A series of stress-sensitivity experiments were designed at reservoir conditions to investigate the closure behavior of self-supporting fractures under effective stress. In addition, gas-water two-phase flow visualization experiments were conducted on self-supporting fractures of varying widths to examine the flow characteristics during the fracture closure process.
1.1. Stress-sensitivity experiments
The samples were collected from the deep Longmaxi Formation shale in the Luzhou Block in the southern Sichuan Basin at 3 583 m to 3 862 m. The shale composition is dominated by quartz (56.0%), with a clay mineral content of 15.5% (Table 1). Among the clay minerals, illite accounts for the largest proportion, 80.2%, illite/montmorillonite interlayers, kaolinite and chlorite are 9.4%, 5.3%, and 5.1% respectively. The original samples were cut into experiment ones (each 2.5 cm in diameter) using a wire-cutting device and a Brazilian splitting apparatus. To simulate the shear displacement associated with hydraulic fracturing-induced self-supporting fractures, metallic shims were attached to both ends of the specimen to prevent slippage during experiment (Fig. 1), ensuring long-term stability of the displacement. The designed shear offsets for this experiment were 0, 0.25, 0.5, 0.75 and 1 mm.
Table 1. Whole-rock mineral composition of the experimental shale samples |
| Minerals | Content/% | Minerals | Content/% |
|---|---|---|---|
| Quartz | 56.0 | Plagioclase | 2.7 |
| Ankerite | 14.7 | K-Feldspar | 0.2 |
| Calcite | 8.5 | Clay minerals | 15.5 |
| Pyrite | 2.4 |
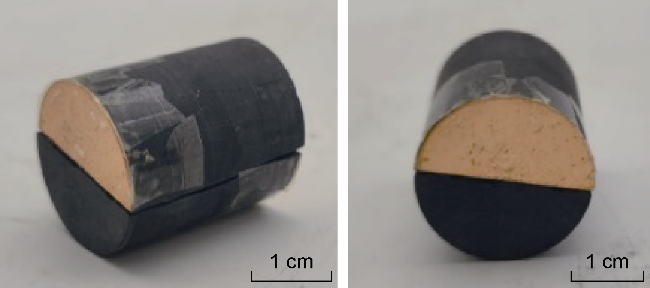
Fig. 1. Experiment shale samples. |
To reproduce the process in which fracture fluid pressure gradually decreases and fractures progressively close during production, high-temperature (120 °C), high-confining-pressure (65 MPa), and high-backpressure (60 MPa) conditions were established to simulate the reservoir temperature and pressure. Based on the characteristics of constant-pressure production decline, a stepwise backpressure reduction method was employed to simulate the effective stress variation leading to fracture closure. Moreover, considering the impact of water-rock interactions on the stress sensitivity of self-supporting fractures, the experimental cores were pretreated with saturated brine, and fracture conductivity was characterized by liquid-flow measurements. The detailed experimental procedures are as follows: (1) Cores were vacuum-saturated with 3% KCl solution; (2) The saturated cores were placed into a core holder, and heated to 120 °C in an oven; (3) Using a constant-pressure pump, both confining pressure and backpressure at the core holder were simultaneously increased. The inlet pressure was equal to the backpressure, and the confining pressure kept 5 MPa higher than the backpressure, until the backpressure reached 60 MPa; (4) After stabilizing the inlet pressure under constant confining pressure, the backpressure was reduced to 0 MPa by increments of 5, 10, 15 and 20 MPa, respectively, each drop holding 30 min. At each stage, the liquid permeability was measured and the equivalent fracture width was calculated [20].
1.2. Visualized experiment
Generally, fracture conductivity is controlled by fracture width, surface morphology (roughness), and fracture cavity geometry [21]. Considering that a large volume of fracturing fluid often remains in the reservoir, inducing prevalent water-rock interactions [22], and that stress sensitivity experiments cause damage to asperities on fracture surfaces, it is not feasible to repeatedly perform single-factor analyses on the same self-supporting fracture. To the end, this study employed 3D-printed self-supporting shale fractures to enable visual characterization of microscale gas-water flow behavior under different fracture morphologies. The specific 3D-printing workflow is illustrated as follows: (1) Model design: Embedded the three-dimensional scanning data of shale self-supporting fracture surfaces into a 3D model through Boolean operations in SpaceClaim software to generate a solid model, and exported it as an STL file. (2) Project setup: Imported the STL file into PreFoam software, set printing parameters, orientation, model support, and layout. A model layer was 25 μm thick (thinner layers mean higher printing resolution). Clear V5 transparent photosensitive resin was selected as the printing material whose wettability (55.5° ± 3°) closely approximates that of the fracture surfaces (53.83°) in the shale sample used in the experiment. The generated.form file was subsequently uploaded to the printer. (3) Printing: Loaded resin material into the printer, and printed the fracture model layer by layer, with a layer 25 μm thick (thinner layers yield higher printing accuracy). (4) Post-processing: The printed models were cleaned, cured, and then assembled into self-supporting fracture specimens.
Considering the influence of different fracture types, widths, surface roughness, and gas-water flow ratios on flow behavior, four transparent 3D-printed self-supporting fracture specimens were prepared, and numbered P1, DP1, V1, and DV1 respectively. The fractures were set as parallel bedding (samples P1 and DP1) and vertical bedding (samples V1 and DV1). The roughness coefficients of the fracture surfaces (JRC) were 5.60 (samples P1 and DP1) and 10.13 (samples V1 and DV1). The fracture misalignment was 0 mm (samples P1 and V1) and 0.5 mm (samples DP1 and DV1). The widths were 50, 200, 300 and 500 μm. The gas phase flow accounted for 10%, 20%, 30%, 40%, 50%, 60%, 70%, 80%, and 90%, respectively, during the experiments.
Visualization experiments were conducted on the apparatus shown in Fig. 2, by following the steps below: (1) Turn on the power, computer, high-speed camera, and light source. Launch the high-speed camera monitoring software on the computer and connect the camera to the computer for data acquisition. (2) Connect the peristaltic pump and the syringe pump to the water and gas inlets of the fracture specimen, respectively, and ensure proper sealing. (3) Position the fracture specimen on the optical platform and at the optimal observation angle. (4) Inject water and air into the fracture by controlling the peristaltic pump and the syringe pump, respectively, to check the sealing performance of the apparatus. (5) Inject deionized water at a high rate to fully saturate the fracture. Adjust the total gas-water flow rate to 30 mL/min at the inlet. Observe and record the flow regime within the fracture. (6) Adjust the fracture width using the stop screws. Repeat steps (4)-(5).
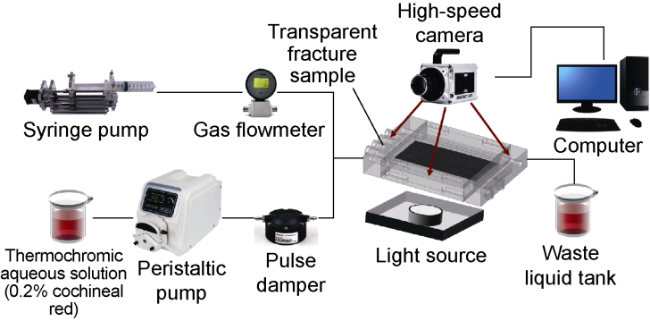
Fig. 2. Experimental setup for visualizing gas-water flow in self-supporting shale fracture. |
2. Results
2.1. Stress-induced closure characteristics of shale self-supporting fractures
As shown in Fig. 3a, with the increase of effective stress from 5 MPa to 60 MPa, the dimensionless fracture width, which is the ratio of the instantaneous width to the initial fracture width, kept decreasing, even by 70.0%-87.2%, at different shear displacements (0.25-1.0 mm). The fracture width reduction curves exhibit two distinct linear stages, with an inflection point occurring at an effective stress of 32-35 MPa. Stage I (before the inflection point) shows the fracture width reduction with further increase in effective stress. Stage II (after the inflection point) shows that the fracture width reduction rate (the slope of the curve) decreased more significantly than Stage I, and became gradually stable. For the fracture with the maximum shear displacement of 1.0 mm, the dimensionless width at the inflection point (35 MPa) is 0.53 and the associated fracture closure is 47%. For the fracture with the minimum shear displacement of 0.25 mm, the dimensionless width is 0.24 at the inflection point (32 MPa) and the associated fracture closure is 76%. Obviously, a larger shear displacement means weaker stress-sensitivity-induced damage to the dimensionless width and a lower degree of closure under the same stress.
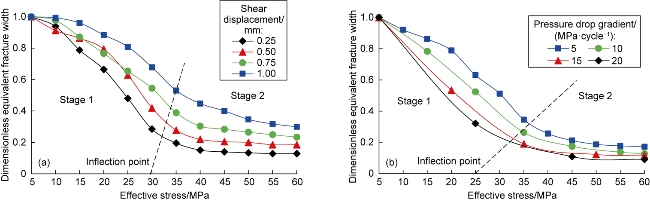
Fig. 3. Variation of fracture width with effective stress. (a) At different shear displacements; (b) At different backpressure drop gradients. |
Fig. 3b illustrates that the dimensionless fracture width is positively correlated with the effective stress at a shear displacement of 0.5 mm. When dropping by 5 Mpa, the dimensionless width reduced by 67.0%, and the maximum to 83.8% at the inflection point (37 MPa). When dropping by 20 MPa, the dimensionless width reduced by 80.0%, and the maximum to 91.0% at the inflection point (32 MPa), which increased by 19.4% and 8.6%, respectively, on the 5 MPa case. An increase in the effective stress results in a steeper slope in Stage I, indicating accelerated fracture closure. Furthermore, the earlier occurrence of the inflection point further demonstrates aggravated stress-sensitivity-induced damage to the fracture. Obviously, the closure is positively correlated with the increasing rate of effective stress.
2.2. Gas-water flow law in self-supporting fractures
As shown in Fig. 4, increasing the gas-phase flow rate facilitates the stabilization of a gas-dominated gas-water flow regime. At the same gas-phase flow rate, the reduction in fracture width leads to the destruction to the gas-dominated flow structure and increases the resistance to continuous gas flow. Shear slip within self-supporting fractures alters the flow channel (fracture space and volume) [23], thereby causing differences in gas-water flow structures at the same gas-phase flow rate. Specifically, shear slip enhances gas-dominated flow within self-supporting fractures, as reflected by the higher gas saturation at the same gas-phase flow rate (Fig. 5a, 5b).
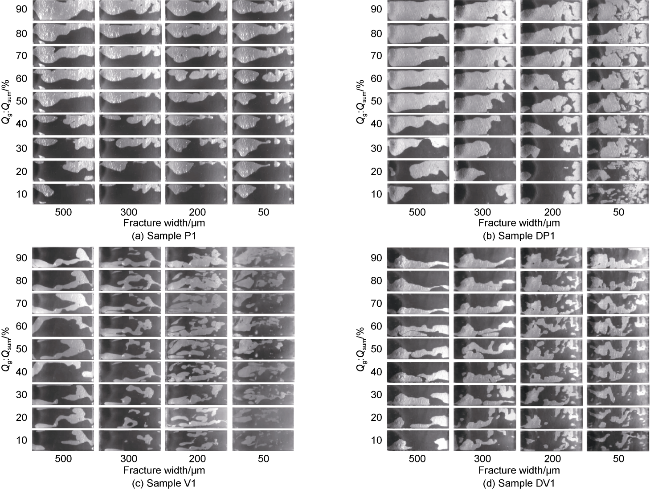
Fig. 4. Visualization of microscopic gas-water flow variations in different types of self-supporting fractures. Water phase in dark gray, gas phase in bright white; flowing from left to right. |
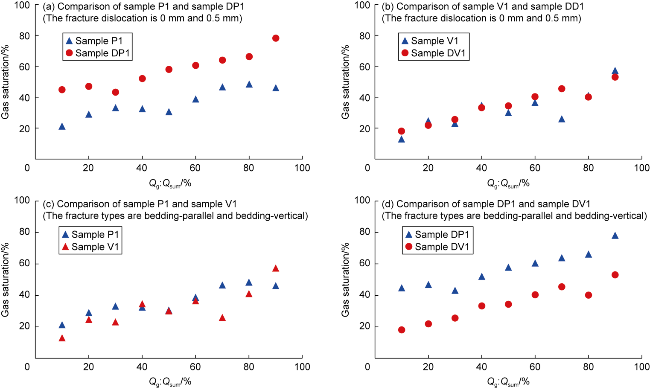
Fig. 5. Gas saturation variation within self-supporting fractures at different gas-water flow ratios (fracture width = 50 μm). |
A comparison between Fig. 4a and 4c (as well as Fig. 4b and 4d) indicates that, compared with fractures perpendicular to bedding (JRC = 10.13), fractures parallel to bedding (JRC = 5.60) more readily establish and maintain a gas-dominated flow regime. This is manifested in the fact that parallel-to-bedding fractures maintain gas dominance at smaller fracture widths and lower critical gas-phase flow rates. Increase of fracture roughness and tortuosity results in a reduction of the continuity of gas flow [24]. With increasing fracture roughness, water is more likely to form independent continuous flow channels, while the establishment of continuous gas channels becomes more difficult, resulting in a continuous decrease in gas saturation at the same gas-phase flow rate (Fig. 5c, 5d).
3. Discussion
3.1. Why self-supporting fractures close during depletion production
According to the Darcy’s law, the positive pressure difference between reservoir pressure and bottom-hole flowing pressure drives gas to flow from reservoir through fractures into wellbore. To maintain gas production, both bottom-hole pressure and reservoir pressure may decrease with production. As fracture fluid pressure continues to decline, the original stress equilibrium within the fracture will be disrupted, leading to a continuous increase in the effective stress that drives the fracture to close. The conventional view attributes the rapid production decline of a shale gas well to stress-sensitive damage to the fracture network [25]. Eq. 1 shows a predictive model for fracture width during formation pressure depletion, which reveals that the higher the stress sensitivity coefficient, the greater the degree of fracture closure under the same effective stress (Fig. 6). This finding indicates that in Fig. 3b, under the same effective stress, the smaller dimensionless fracture width observed prior to the inflection point at a higher backpressure depletion gradient may be related to the dynamic variation of the stress sensitivity coefficient.
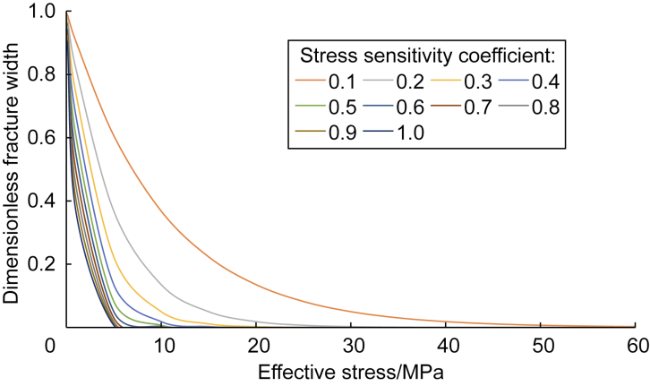
Fig. 6. Closure characteristics of self-supporting fractures at different stress sensitivity coefficient. |
In the equations: W is the fracture width at a moment, μm; W0 is the fracture width under the initial formation pressure, μm; γ is the stress sensitivity coefficient, dimensionless; Δσ1 is the change in effective stress, MPa.
The essence of fracture stress sensitivity lies in the deformation of micro-protrusions on the fracture surface under the action of effective stress, which is primarily controlled by the magnitude of effective stress, fracture surface morphology, and rock mechanical properties [26]. From the perspective of mechanics of materials, when applied effective stress, fracture surfaces undergo both elastic and plastic deformation [27]. Elastic deformation can fully recover from stress release, but plastic deformation cannot, which explains the partial recovery of fracture permeability after stress release [14]. On the other hand, gas-bearing shale is rich in clay minerals and organic matter, and their contents are positively correlated with fracture surface creep [28]. Deformation caused by creep is irreversible because creep strain is related to material’s viscosity, and jointly controlled by stress duration and stress loading rate [6]. Kang et al. tested shale self-supporting fracture permeability under different stress durations and confirmed that both effective stress and its acting time are key external factors controlling fracture deformation [27]. Under the same stress, a higher stress loading rate results in smaller instantaneous strain (associated with elastic and plastic deformation) and larger incremental decay of creep strain [29]. Additionally, with increasing water cut and stress, the nonlinearity of stress-strain behavior in mud shale increases. Higher water cut increases creep deformation, prolongs stable creep, and reduces long-term rock strength [30]. It suggests that the complex mineral composition of shale causes superimposed “elastic + plastic + viscous” effects on fracture surfaces, and consequently synergistic damage from “stress sensitivity + creep effect” on the fracture under the combined influence of stress and time [31]. Therefore, the dynamic variation of the stress sensitivity coefficient can be attributed to creep of fracture surfaces under effective stress [7]. At a field scale, permanent retention of some fracturing fluid further exacerbates fracture surface creep and stress-sensitive damage [26], shown by increasing production pressure differential, effective stress and stress sensitivity coefficient, and quickly decreasing fracture network conductivity over production time.
3.2. Gas-water flow regime in self-supporting fractures
The permeability of each phase within a fracture is primarily governed by the fracture geometry and the distribution of gas and water. The gas-water flow structure is a key indicator describing the spatial distribution of the phases within flow channels. Based on the experimental results shown in Fig. 4, the evolution of gas-water flow structures within self-supporting fractures can be classified into three types: continuous gas flow, discontinuous gas-water flow, and discontinuous gas flow (Fig. 7), which further allows the construction of schematic diagrams illustrating microscopic gas-water flow evolution in self-supporting fractures (Fig. 8).
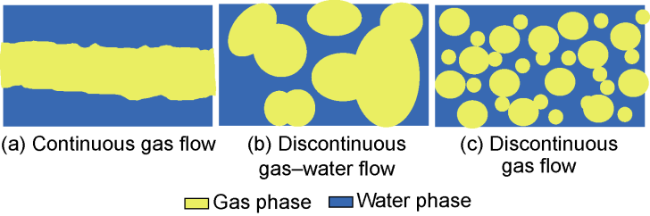
Fig. 7. Schematic of three types of microscopic gas-water flow in self-supporting fractures. |
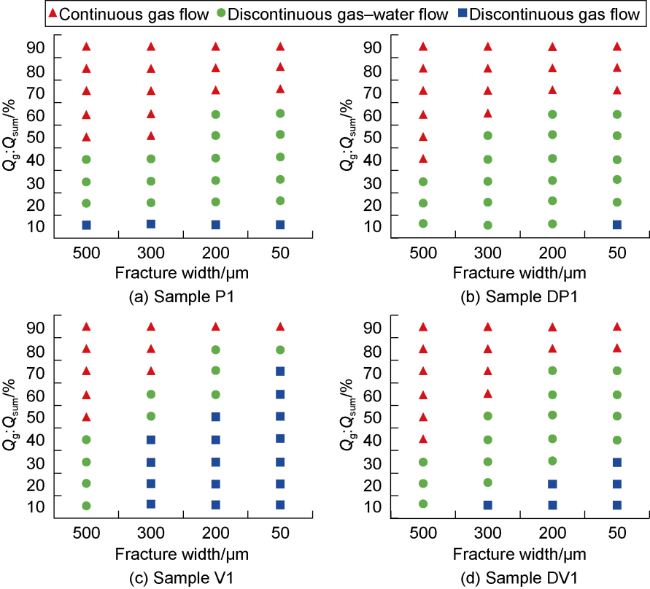
Fig. 8. Variation of microscopic gas-water flow structures in different types of self-supporting fractures. |
As the fracture width decreases from 500 μm to 50 μm, the flow transitions from continuous gas flow to discontinuous flow, and the critical gas volumetric fraction required to sustain continuous gas flow increases. Compared with the fracture parallel to bedding (Fig. 8a, 8b), the fracture perpendicular to bedding (Fig. 8c, 8d) requires an even higher critical gas fraction to sustain continuous gas flow. When the fracture width is 50 μm and the roughness (JRC) increases from 5.60 to 10.13, the critical gas fraction for continuous flow increases from 70% to over 90% (Fig. 8a, 8c). Increasing fracture surface roughness generates more discrete gas bubbles and higher resistance to gas flow, which promotes the transition from continuous gas flow to discontinuous flow, making continuous gas pathways increasingly difficult to sustain. It indicates that, during fracture closing, the early stage of continuous gas flow (fracture width greater than 300 μm) is mainly controlled by fracture width. The larger the fracture width, the smaller the critical gas- phase flow rate to maintain continuous gas-phase flow. In the later stage (fracture width less than 300 μm), fracture width and surface roughness jointly control the gas-water flow structure. As the fracture narrows further, the influence of roughness becomes increasingly dominant, resulting in a progressively higher critical gas fraction required to maintain continuous gas flow.
By considering the stress sensitivity (Fig. 3b) and the evolution of gas-water flow structures in different types of self-supporting fractures (Fig. 8), a gas-water flow chart was constructed (Fig. 9). In Stage I (effective stress below the inflection point of 32 MPa), stress sensitivity is relatively high. However, the larger the fracture width, the lower the critical gas volumetric fraction required to maintain continuous gas flow. In Stage II (effective stress above the inflection point of 32 MPa), stress sensitivity decreases, but the overall fracture closure is more pronounced, and the critical gas fraction needed to sustain continuous gas flow is higher.
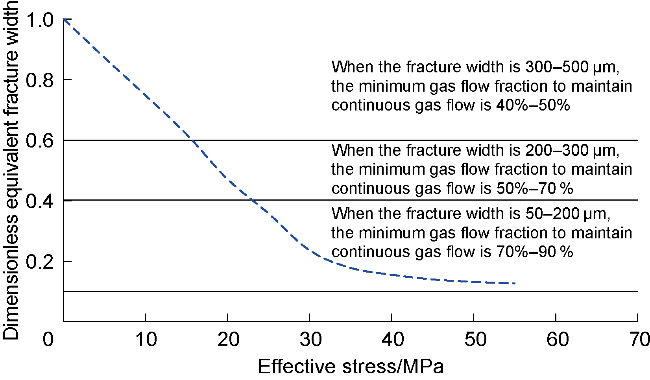
Fig. 9. Evolution of gas-water flow structures in self-supporting fractures (initial fracture width of 500 μm). |
3.3. Optimization of pressure-controlled production
Shale gas production relies on hydraulic fracture network. Self-supporting fractures that act as the key connectors between near-wellbore fractures filled with proppants and distal natural fractures (Fig. 10) govern the effective SRV. However, they are more sensitive to stress than propped fractures, so they are more likely to close before the pressure funnel goes from near to far. This results in low permeability near self-supporting fractures, interrupts gas supply from distal natural fractures, reduces the fracture-controlled effective SRV. Consequently, under high production pressure differential, rapid production decline and decreasing cumulative gas production occur [5,18]. Therefore, excessive production pressure differential must be avoided to prevent rapid closure of self-supporting fractures and severe obstruction to gas-phase transportation.
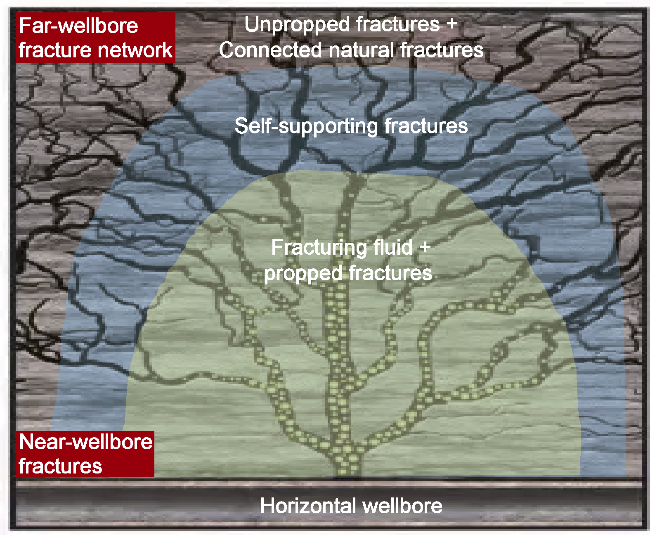
Fig. 10. Schematic distribution of fracture network after hydraulic fracturing in a shale gas well. |
Haynesville shale gas reservoirs at high pressure and very sensitive stress in North America have increased high single-well EUR by 28% through pressure-controlled production [32-33]. Similarly, for the mid-deep shale gas reservoir in the Changning block in the Sichuan Basin, moderately reducing early production prolonged stable production, slowed pressure decline, and significantly increased cumulative gas production [34]. During production, the self-supporting fractures gradually close, raising the critical gas fraction required to maintain continuous gas flow. Enhancing the gas fraction to sustain production usually makes the production pressure differential inevitably increase, but increasing the gas flow rate leads to a higher pressure gradient and a greater pressure drop [19], accelerating reservoir energy loss. Therefore, early high production does not necessarily yield higher EUR. It indicates that in the early stage, stress-sensitive damage is higher, and precise pressure control is needed to protect fracture width and maintain continuous gas flow at a low pressure drop gradient. In the later stage, stress-sensitive damage decreases, but as fracture width significantly reduces, the pressure gradient required to sustain continuous gas flow sharply increases, reducing reservoir energy efficiency and highlighting the necessity of early pressure-controlled production.
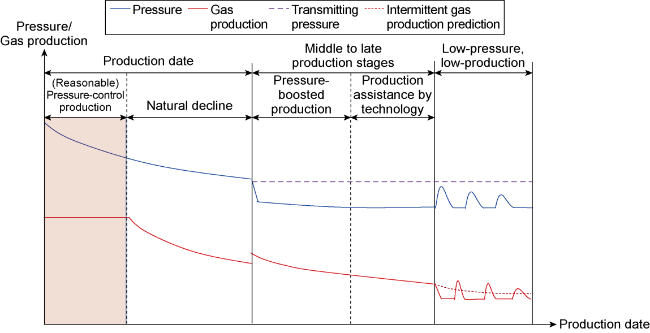
Early pressure-controlled production maintains a gas- dominated gas-water flow structure while optimizing unit pressure-drop gas production (higher reservoir energy utilization efficiency). A shale gas well must go through a flowback process to establish gas-dominated flow channels, and the production performance typically shows a peak in wellhead pressure, which means the gas well has the highest gas production per unit pressure drop at this point. Therefore, the starting point for early pressure-controlled production is recommended after the peak flowback pressure. The purpose is to maintain the current high unit-pressure-drop gas production as much as possible through pressure control. Statistics from 185 deep shale gas wells in different blocks in the Sichuan Basin indicate that the wellhead pressure drop from peak flowback pressure to pipeline pressure is 36-40 MPa. Considering the production performances (Fig. 11), it is recommended that during the early stage of pressure-controlled stable production (when the wellhead pressure drop less than 32 MPa), an optimal pressure drop plan should be established to control the daily pressure drop through reasonabe production allocation. This is helpful to reducing the closing rate and degree of self-supporting fractures at the far end, delaying the inflection point, enlarging the effective SRV and enhancing gas supply from far fractures. As a result, the reservoir energy will be fully used and the EUR will be higher.
Fig. 11. Production performance of a deep shale gas well (burial depth at 3 500 m) in south Sichuan Basin. |
4. Conclusions
The closing of self-supporting fractures exhibits a two- stage pattern which is “first fast and then slow”. As the effective stress gradually increased from 5 MPa to 60 MPa by an increment of 5 MPa, a stress-sensitive inflection point appeared at 32-35 MPa where the fracture closed by 47%-76%. The larger the shear displacement, the lower the stress sensitivity is. The faster the stress increases, the more severe the stress-sensitive damage.
As the self-supporting fracture width decreased from 500 μm to 50 μm, the micro-scale gas-water flow within the fracture transitioned from continuous to discontinuous gas flow, and the critical gas fraction required to maintain continuous gas flow increased significantly.
In the early stage (fracture width greater than 300 μm), a larger fracture width corresponds to a lower critical gas fraction for maintaining continuous gas flow. In the later stage (fracture width less than 300 μm), fracture surface roughness becomes dominant, so the critical gas fraction exceeds 70%.
Early pressure-controlled stable production (when wellhead pressure drop less than 32 MPa) can delay self-supporting fracture closure, improve reservoir energy utilization, and support sustainable gas production.