


A global satellite survey of density plumes at river mouths and at other environments: Plume configurations, external controls, and implications for deep-water sedimentation
[SHANMUGAM G*  ]
]
]
|
|


The U. S. National Aeronautics and Space Administration (NASA) has archived thousands of satellite images of density plumes in its online publishing outlet called 'Earth Observatory' since 1999. Although these images are in the public domain, there has not been any systematic compilation of configurations of density plumes associated with various sedimentary environments and processes. This article, based on 45 case studies covering 21 major rivers (e.g., Amazon, Betsiboka, Congo [Zaire], Copper, Hugli [Ganges], Mackenzie, Mississippi, Niger, Nile, Rhone, Rio de la Plata, Yellow, Yangtze, Zambezi, etc.) and six different depositional environments (i.e., marine, lacustrine, estuarine, lagoon, bay, and reef), is the first attempt in illustrating natural variability of configurations of density plumes in modern environments. There are, at least, 24 configurations of density plumes. An important finding of this study is that density plumes are controlled by a plethora of 18 oceanographic, meteorological, and other external factors. Examples are: 1) Yellow River in China by tidal shear front and by a change in river course; 2) Yangtze River in China by shelf currents and vertical mixing by tides in winter months; 3) Rio de la Plata Estuary in Argentina and Uruguay by Ocean currents; 4) San Francisco Bay in California by tidal currents; 5) Gulf of Manner in the Indian Ocean by monsoonal currents; 6) Egypt in Red Sea by Eolian dust; 7) U.S. Atlantic margin by cyclones; 8) Sri Lanka by tsunamis; 9) Copper River in Alaska by high-gradient braid delta; 10) Lake Erie by seiche; 11) continental margin off Namibia by upwelling; 12) Bering Sea by phytoplankton; 13) the Great Bahama Bank in the Atlantic Ocean by fish activity; 14) Indonesia by volcanic activity; 15) Greenland by glacial melt; 16) South Pacific Ocean by coral reef; 17) Carolina continental Rise by pockmarks; and 18) Otsuchi Bay in Japan by internal bore. The prevailing trend in promoting a single type of river-flood triggered hyperpycnal flow is flawed because there are 16 types of hyperpycnal flows. River-flood derived hyperpycnal flows are muddy in texture and they occur close to the shoreline in inner shelf environments. Hyperpycnal flows are not viable transport mechanisms of sand and gravel across the shelf into the deep sea. The available field observations suggest that they do not form meter-thick sand layers in deep water settings. For the above reasons, river-flood triggered hyperpycnites are considered unsuitable for serving as petroleum reservoirs in deep-water environments until proven otherwise.
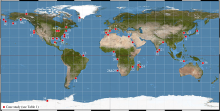
Density plumes and their various configurations seen on satellite images have been a source of curiosity to the geologic community as well as to the general public. The National Aeronautics and Space Administration (NASA, 2018)[1] has archived satellite images on density plumes in its online publishing outlet "Earth Observatory" since 1999. NASA has used a variety of satellites, such as Aqua, Terra and Topex/Poseidon. However, there has not been a systematic attempt to compile variations in natural configurations of density plumes in the world’ s oceans and lakes. This article is the first attempt to compile natural variability of density plumes in 45 case studies worldwide (Table 1, Fig. 1[2, 3, 4, 5, 6, 7, 8, 9, 10, 11, 12, 13, 14, 15, 16, 17, 18, 19, 20, 21, 22, 23, 24, 25, 26, 27, 28, 29, 30, 31, 32]). Forel (1885)[33] first reported the phenomenon of density plumes in the Lake Geneva (Loc Lé man), Switzerland. Following Forel's pioneering work, Bates (1953)[34] suggested three types of density plumes in river-mouth deltaic environments: 1) hypopycnal plume for floating river water that has lower density than basin water (Fig. 2a); 2) homopycnal plume for mixing river water that has equal density as basin water (Fig. 2b); and 3) hyperpycnal plume for sinking river water that has higher density than basin water (Fig. 2c). Although river-mouth hyperpycnal plumes have received much attention[35, 36], plumes in other environments are equally important, but are generally ignored.
| Table 1 Case studies showing various configurations of density plumes on satellite images in modern marine and lacustrine environments. |
 | Fig. 1. Location map of 45 case studies of marine and lacustrine environments (see Table 1). Note that Case study 42 represents the entire globe. |
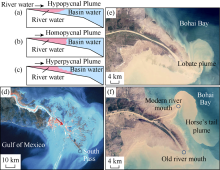
 | Fig. 2. Schematic diagrams showing three types of density variations in riverine plumes in deltaic environments based on concepts of Bates (1953)[34]. (a) Hypopycnal plume in which density of river water is less than density of basin water. (b) Homopycnal plume in which density of river water is equal to density of basin water. (c) Hyperpycnal plume in which density of river water is greater than density of basin water. Figure from Shanmugam (2012)[39]. (d) Image of the Mississippi River showing well-developed floating hypopycnal plumes. Note "deflecting" plumes. Red arrow shows river course for the South Pass. Blue Circle = River mouth. See Coleman and Prior (1982)[40] for river-dominated deltaic facies model. (e) Satellite image of the Yellow River (Huanghe) showing well-developed lobate plume at the old river mouth. (f) Satellite image of the Yellow River (Huanghe) showing horse's tail plume at the modern river mouth that was initiated in 1996. Two blue circles=Old and modern river mouths. Image credit: NASA Earth Observatory. |
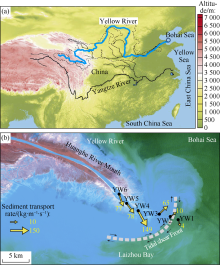
 | Fig. 3. Characteristics of the Yellow River, China. (a) Index map showing the location of Yellow River. (b) Satellite image showing the sediment dispersal pattern at the Yellow River (Huanghe) mouth and estimated mean depth-integrated sediment flux at six stations in 1995 cruise. Note a tidal shear front (white dashed line) in front of the old river mouth[46]. From Wang et al. (2010)[3]. |
The primary purpose of this compendium of satellite images is to document the natural variability and complexity of density plumes not only at river mouths but also at other settings. The knowledge gained by this compilation would hopefully help in understanding the implications for external controls, hyperpycnal flows, submarine fans, and deep-water petroleum reservoirs. This article, which is rich in empirical data from a variety of environments, should serve as a guideline for students in their future research. Although the primary dataset for this study is from NASA's satellite images, other published photographic images are also used.
In practice, there is a tendency to use the two terms "flow" and "plume" synonymously. However, these two terms are not one and the same. In hydrodynamics, the term plume describes a condition when a column of one fluid moves through another fluid. To accommodate natural variability in plume types, a broad definition of plume is adopted in this article. Accordingly, a plume is defined as a fluid enriched in sedi- ment, ash, biological or chemical matter that enters another fluid. As it would be demonstrated later, there is a multitude of plume types in nature. Among them, the river plume is the most popular. National Oceanic and Atmospheric Administration (NOAA) Fisheries Glossary (2006, p. 42)[37] defines a River Plume as "Turbid freshwater flowing from land and generally in the distal part of a river (mouth) outside the bounds of an estuary or river channel."
In fluid mechanics, the term "flow" is used for a continuous, irreversible deformation of sediment-water mixture that occurs in response to applied shear stress, which is gravity in most cases[38]. In other words, not all plumes are flows. For example, floating hypopycnal plumes are not driven by gravity (Fig. 2a). However, both terms "flow" and "plume" are applicable to hyperpycnal type.
Because the original concept of hyperpycnal flows is closely tied to river floods[34], density plumes at river mouths are considered using 21 rivers in this study (Table 1). They are:
1)Amazon River, Brazil, Equatorial Atlantic; 2)Betsiboka River, NW Madagascar, Bombetoka Bay; 3)Chignik River, Alaska, USA, Pacific Ocean; 4)Congo (Zaire) River, West Africa, South Atlantic Ocean; 5)Connecticut River, New England region, USA, Long Island Sound; 6)Copper River, USA, Gulf of Alaska; 7)Ebro River, Iberian Peninsula, Mediterranean Sea; 8)Eel River, California, USA, Pacific Ocean; 9)Guadalquivir River, Southern Spain, Gulf of Cá diz; 10)Hugli River (a distributary of the Ganges River), India, Bay of Bengal; 11)Mackenzie River, Canada, Beaufort Sea; 12)Mississippi River, USA, Gulf of Mexico; 13)Niger River, West Africa, North Atlantic Ocean; 14)Nile River Delta, Egypt, Mediterranean Sea; 15)Onibe River, Eastern Madagascar, Indian Ocean; 16)Rhone River, France, Gulf of Lions, Mediterranean Sea; 17)Rio de la Plata Estuary, Argentina and Uruguay, South Atlantic Ocean; 18)Rupert River, Quebec, Canada, Rupert Bay; 19)Yangtze River, China, East China Sea; 20)Yellow River, China, Bohai Bay, Bohai Sea; 21)Zambezi River, Central Mozambique, Indian Ocean.
In this article, most satellite images used were taken by the Moderate Resolution Imaging Spectroradiometer (MODIS), an earth-observing instrument of the Aqua satellite.
The 45 case studies worldwide (Table 1) used in this article represent not only conventional river-mouth plumes, but also estuarine, meltwater, eolian, volcanic, cyclonic, upwelling, and other environments. In the following discussion, I have selected only certain case studies to emphasize specific details dealing with controlling factors. Although I tried to describe plume types based on shapes, it is not always possible because shapes are too complex in some cases. For this reason, I used their origin in classifying plumes in selected cases (e.g., volcanic plume, meltwater plume, dust plume, etc). Additional case studies would help resolve this problem.
The Mississippi River is the second-largest drainage system on the North American continent, second only to the Hudson Bay system. Historically, the Mississippi River delta has been the "classic" type locality for deltas[40]. Satellite images of the Mississippi River show one of the best developed deflecting density plumes (Fig. 2d). Walker and Rouse (1993) [2] attributed the deflection of plumes to shelf currents in the Gulf of Mexico.
The Yellow River (Huanghe), which is regarded as the world’ s largest contributor of fluvial sediment load to the ocean (Yu et al., 2011)[41]. Historically, it contributed a sediment load of nearly 100 million tons per year[42]. The Huanghe’ s average annual suspended-load concentration of 25 000 mg/L and flood stage concentration of 220 000 mg/L are, by 1983, the largest in the world[43]. Recent empirical data gathered from the Yellow River have been reviewed by Shanmugam (2018a)[44].
The Yellow River has revealed two distinctive types of plumes, namely simple lobate and horse's tail (Fig. 2e, 2f). The horse’ s tail shape is related to local deflection of plumes. The Yellow River is a river-dominated delta with unidirectional river currents, and it develops river-mouth muddy lobes (Fig. 2e). However, the development of a tidal shear front prevents the transport of sediment seaward (Fig. 3). Li et al. (2001)[45] showed that the shear front is an important dynamic factor in controlling rapid accretion at the Yellow River mouth. Suspended sediment converges and is deposited rapidly along the shear front zone. This is because a low-velocity zone is formed between two inverse flow bodies.
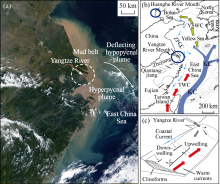
The Yangtze River (Changjiang) is the longest river in Asia (6 300 km). Satellite images show that the Yangtze River generates both hyperpycnal lobate and deflecting hypopycnal plumes (Fig. 4a). A distinction between hyperpycnal and hypopycnal plumes has been made on the basis of color. For example, hyperpycnal plumes are yellowish brown in color due to high sediment concentration, whereas hypopycnal plumes are bluish due to low sediment concentration (Fig. 4a).
 | Fig. 4. (a) Satellite image showing the Yangtze River plunging into the East China Sea. Note development of both hyperpycnal plume near the river mouth and hypopycnal plume on the seaward side. Note deflected hypopycnal flows that move southward (white arrow), possibly due to modulation by south-flowing shelf currents. Note sheet-like mud belt developed along the inner shelf due to contour-following shelf currents. White dashed circle = River mouth. River image credit: NASA Visible Earth, Jacques Descloitres, MODIS Land Science Team. Image acquired on September 16, 2000. (b) Map showing warm Kuroshio Current (KC) in the East China Sea and Yellow Sea. TWC=Taiwan Warm Current; YSWC=Yellow Sea Warm Current; ZFCC=Zhejiang Fujian Coastal Current. Blue circles: Yangtze and Yellow River mouths. From Liu et al. (2006)[4] with additional labels by G. Shanmugam. (c) Conceptual model of sedimentary and oceanographic processes affecting the sediment dispersal at both the subaqueous delta and alongshore deposits associated with the Yangtze River. From Liu et al. (2006)[4] with additional labels by G. Shanmuagm. |
The Yangtze River mouth is a complex setting in which both ocean currents and tidal currents are affecting sediment dispersal. Unlike the Yellow River that enters a protected Bohai Bay from major ocean currents, the Yangtze River enters the East China Sea affected by the warm, north-flowing, Kuroshio Current (Fig. 4b). As a consequence, muddy sediments brought by the Yangtze River are redistributed and deposited as a mud belt on the inner shelf[47].
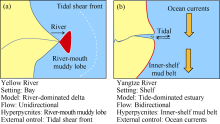
Although both Yellow and Yangtze rivers develop hyperpycnal plumes at their river mouths, transport of hyperpycnal sediments from the river mouth to the deep sea has been either blocked or diverted by different external controls, such as tidal shear front and ocean currents (Fig. 5).
 | Fig. 5. Comparison of conceptual diagrams showing differences in depositional models between the Yellow River (a) and the Yangtze River (b). Note external controls on the distribution of muddy hyperpycnites. In the Yellow River (a), a tidal shear front prevents seaward transport of sediment. In the Yangtze River (b), ocean currents deflect plumes and deposit them as inner-shelf mud belt. From Shanmugam (2018a)[44]. |
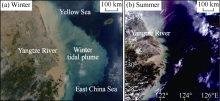
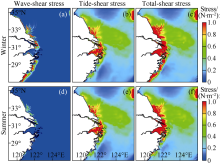
In a recent study, Luo et al. (2017)[5] recognized that extended density plumes tend to develop during winter months (Fig. 6a), which are absent during the summer months (Fig. 6b). In explaining the winter density plumes (Fig. 7), Luo et al. (2017)[5] make the case for vertical mixing of sediments by tides in the winter months using numerical modeling. Although the tides are active all year round, Luo et al. (2017)[5] suggest that their modeling shows that the sediment can only rise up to the surface in the winter, when temperatures and salinities at the sea surface and bottom are roughly the same. In the summer, however, an influx of fresh water from the Yangtze, combined with heating of the surface layers of the sea, prevents vertical mixing and keeps the resuspended sediment in the depths.
 | Fig. 6. Satellite images showing the difference in plume generation between winter and summer periods in the Yangtze River. (a) Satellite image of MODIS data on 9 November 2017 showing well-developed winter tidal plumes. Additional comments by G. Shanmugam. Image credit: NASA Earth Observatory. Image acquired on November 9, 2017. (b) Satellite image of MODIS data on 31 July 2015 showing no major extended summer plumes. From Luo et al. (2017)[5] with additional labels by G. Shanmuagam. |
 | Fig. 7. Model showing bottom shear stress (units: N· m-2) in the Yangtze River in winter (top) and summer (bottom). Note well-developed tide-induced bottom stress in the winter period. From Luo et al. (2017)[5] with additional labels by G. Shanmuagam. |
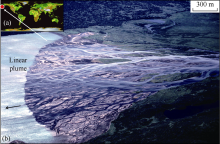
In the geologic and engineering literature, the focus of discussion on hyperpycnal flows is centered around fine-grained or common deltas. McPherson, Shanmugam, and Moiola (1987)[6] distinguished fine-grained deltas from coarse-grained deltas. The importance here is that braid deltas, a kind of coarse-grained deltas, are typical of high-gradient settings with high-velocity river flows. Because these braided rivers plunge into a standing body of water with multiple entry points, separated by braided bars, these rivers develop "linear" hyperpycnal plumes (Fig. 8). Distinguishing linear types is important because braid deltas are known to develop various types of sediment flows, including debris flows, in the subaqueous delta front[6].
 | Fig. 8. Braid delta and related density plumes, Alaska. Photograph showing multiple entry points with shooting "linear" hyperpycnal plumes into a standing body of water. Braid delta from Chignik Lake, southeastern coast, Alaska, From McPherson, Shanmugam, and Moiola (1987)[6]. GSA. Photo courtesy of R.D. Kreisa. |
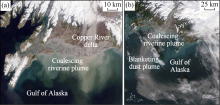
Galloway (1976)[48] originally classified the Copper River delta as a "fan delta". According to McPherson, Shanmugam, and Moiola (1987)[6], the Copper River delta fits the characteristics of coarse-grained braid delta. The importance here is that it develops both coalescing riverine plume (Fig. 9a) and blanketing dust plume (Fig. 9b). In cases like this, it is extremely difficult to distinguish the complex interaction be- tween riverine and eolian input that occurs during sedimentation in the ancient sedimentary record.
 | Fig. 9. Copper River delta and eolian input, Gulf of Alaska. (a) Satellite image showing a braid delta with coalescing plume from multiple river mouths of the Copper River braid delta, Gulf of Alaska. NASA Earth Observatory images by Robert Simmon and Jesse Allen. Image acquired on May 28, 2013. (b) Satellite image showing both coalescing riverine plume and blanketing eolian (dust) plume in the Copper River braid delta, Gulf of Alaska. NASA Earth Observatory image courtesy Jeff Schmaltz, MODIS Rapid Response Team at NASA GSFC. Image acquired on October 29, 2009. |
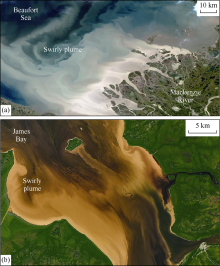
 | Fig. 10. Rivers in Canada. (a) Satellite image showing the Mackenzie River Delta with swirly plumes. NASA Earth Observatory image by Jesse Allen. Story by Mike Carlowicz. Image acquired on July 19, 2017. (b) Satellite image showing dark brown swirly plumes in the Rupert Bay, northern Quebec. NASA Earth Observatory images by Joshua Stevens. Caption by Adam Voiland. Image captured on July 30, 2016. |
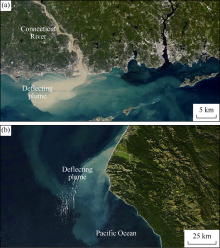
 | Fig. 11. Rivers on the east and west coasts of the United States. (a) Satellite image showing the Connecticut River in the Long Island Sound with a deflected lobate plumes. NASA Earth Observatory image by Robert Simmon. Image acquired on September 2, 2011. (b) Satellite image showing the Eel River in California with a deflected lobate plumes. NASA image courtesy Jeff Schmaltz, LANCE MODIS Rapid Response. Caption by Adam Voiland. Image acquired on December 9, 2012. |
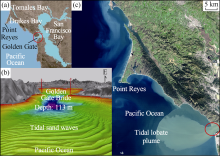
The Golden Gate Bridge is located at the mouth of the San Francisco Bay connecting the Pacific Ocean (Fig. 12a). Barnard et al. (2006)[8] reported a field of giant sand waves of tidal origin beneath the Golden Gate Bridge at the mouth of San Francisco Bay in California (Fig. 12b). Repeated surveys demonstrated that the sand waves are active and dynamic features that move in response to tidally generated currents. The significance of the tidal sand waves at the mouth of the San Francisco Bay is that muddy lobate sediment plumes have been imaged by NASA at this area (Fig. 12c), mimicking many river-mouth sediment plumes, such as the one observed at the mouth of the Yellow River (Fig. 2e).
 | Fig. 12. San Francisco Bay, California. (a) Location map showing the mouth of the San Francisco Bay with the Pacific Ocean at the Golden Gate Bridge (Circle). (b) Image showing a field of giant tidal sand waves and other bedforms at the mouth of San Francisco Bay. The view is from the northwest toward the Golden Gate Bridge (seen in the background), which is approximately 2 km long. More than 40 large (greater than 50 m wavelength) sand waves were mapped, with crest-to-crest lengths of as much as 220 m and heights of as much as 10 m. This computer-generated image by Patrick Barnard of sand waves is based on high-resolution multibeam imaging of the seafloor using research vessel VenTresca by the CSUMB Seafloor Mapping Laboratory. Vertical exaggeration: 3X. Geological details of the setting and sand waves are discussed by Barnard et al. (2006)[8]. The land was imaged using digital orthophotos draped over a U.S. Geological Survey digital elevation model. The Golden Gate Bridge model is courtesy of IVS 3D© . Image courtesy of USGS, accessed July 14, 2011. (c) Satellite image showing tidal lobate plume at the mouth (circle; Golden Gate Bridge) of the San Francisco Bay. Image credit: NASA. Image acquired on March 1, 2017. |
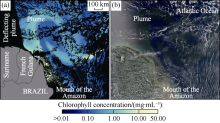
 | Fig. 13. Amazon River, the Equatorial Atlantic. (a) Satellite image showing concentrations of chlorophyll (the energy-producing pigment that give plants their green color) in the ocean surface waters. Note the deflected plumes by ocean currents. (b) Satellite image in natural color. Image was made from data collected by MODIS on September 30, 2006. NASA images created by Jesse Allen, Earth Observatory, using data provided courtesy of the Goddard Earth Sciences DAAC and the Ocean Color Science Team. |
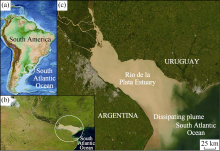
The Rí o de la Plata Estuary is located on the east coast of South America (Fig. 14a), bordering Argentina and Uruguay, is one of the largest estuaries in the world[50]. It is 280 km long and 220 km wide at its mouth, and its water depth does not exceed 10 m (Fig. 14b). It receives water and sediment from both the Paraná and Uruguay rivers with an annual mean discharge of 22 000 m3/s. The Rí o de la Plata Estuary shows dissipating plume with irregular front (Fig. 14c)[51, 52].
 | Fig. 14. Rio de la Plata Estuary, South America. (a) Index map showing the location of the Rio de la Plata Estuary (white circle). Image credit: ETOPO1 Global Relief Model[49]. With additional labels by G. Shanmugam. (b) Satellite image showing the Rio de la Plata Estuary. This image is used as an index map to provide a regional perspective. Image courtesy Jacques Descloitres, MODIS Land Group, NASA GSFC. Image acquired on April 24, 2000. (c) Satellite image showing the Rio de la Plata Estuary with hyperpycnal plumes that tend to move towards the Argentinian shelf to the south. Framiň an and Brown. (1996)[50] used the term "turbidity front" for this hyperpycnal plume. Note that the entire, 220-km wide, plume gets diluted and dissipated with an irregular front, which fails to advance into the South Atlantic. This dilution of plume is attributed to external controls, such as ocean currents operating on the shelf. The Paraná River, the second longest river in South America after the Amazon, supplies three-quarters of the fresh water that enters the estuary, with the remainder arriving from the Uruguay River. Image credit: NASA Earth Observatory, NASA image by Jeff Schmaltz, LANCE/EOSDIS MODIS Rapid Response. Image acquired on March 31, 2012. |
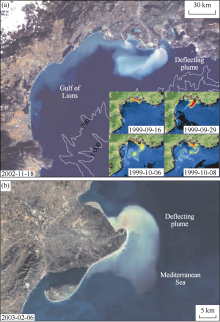
 | Fig. 15. Rivers flowing into the northern Mediterranean Sea. (a) Satellite image showing deflected plume of the Rhone River. The inset figure shows that, on occasion, Rhone River plumes reach the shelf edge and evolve toward the southwest. The four consecutive SeaWiFS images show chlorophyll concentration evolution on surface waters (red corresponds to maximum productivity waters). This sequence of images illustrates the generation (9/16/99), development (9/29/99), and spreading of the coastal plume led by the Liguro-Provenç al Current (LPC) and an anticyclonic gyre (10/6/99), which later moves toward the southeast (10/8/99). (b) Satellite image showing deflected plume of the Ebro River. Both images from Arnau et al. (2004)[11] with additional labels by G. Shanmuagm. |
Gonzalez-Silvera et al. (2006)[9] studied Ocean color (OCTS, SeaWiFS) and sea surface temperature (AVHRR) images and evaluated spatial and temporal variability of the Brazil-Malvinas Confluence and La Plata Plume (20° to 45° S and 40° to 65° W). The data set covered the period from January 1997 to June 2003. Chlorophyll and SST data were compiled and analyzed. The results show a gradual increase of the northward intrusion of the La Plata Plume throughout the period lasting from summer to winter; the summer shape of the La Plata Plume showed a stronger penetration over the shelf on the Argentinean side of the estuary mouth; and the seasonal migration of the Brazil-Malvinas Confluence.
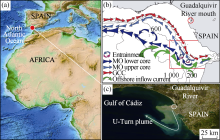
The Gulf of Cá diz is located in the north-eastern Atlantic Ocean (Fig. 16a). It is enclosed by the southern Iberian and northern Moroccan margins, west of Gibraltar Strait. Two major rivers, the Guadalquivir and the Guadiana, as well as smaller rivers, like the Odiel, the Tinto, and the Guadalete, reach the ocean here. In terms of ocean currents[12], it is one of the most complex oceanographic settings (Fig. 16b). Mimicking the current patterns, sediments that are emptied into the gulf by the Guadalquivir River exhibit a 'U-Turn' shape for the plume (Fig. 16c).
 | Fig. 16. Guadalquivir River, Southern Spain, Gulf of Cá diz. (a) Index map showing the location of Gulf of Cá diz (red dot). Image credit: ETOPO1 Global Relief Model[49]. With additional labels by G. Shanmugam. (b) Circulation patterns of ocean currents in the Gulf of Cá diz (Peliz et al., 2009)[12]. AGU. MO = Mediterranean outflow; GCC = Gulf of Cá diz slope current. (c) Satellite image showing sediment plumes with a U-Turn pattern. Note that the U-Turn pattern is mimicking the circulation of ocean currents. NASA image courtesy Jeff Schmaltz, LANCE MODIS Rapid Response Team at NASA GSFC. Image acquired on November 13. 2012. Symbols and labels by G. Shanmugam. |
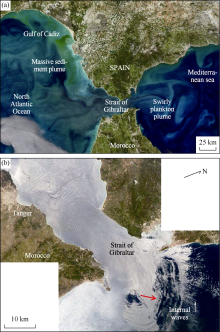
The Strait of Gibraltar is a narrow strait that connects the Atlantic Ocean to the Mediterranean Sea and it separates Spain from Morocco. On satellite images, we can see the difference between massive sediment plume in Gulf of Cá diz to the west of the strait and swirly plankton plume in the Mediterranean Sea to the east of the strait (Fig. 17a). Conceivably, the massive plume may be related to increased sediment input from nearby during flood stages. The origin of swirly plumes could be attributed to the currents and internal waves in the area (Fig. 17b).
 | Fig. 17. Strait of Gibraltar. (a) Satellite image showing massive sediment plume in the Gulf of Cadiz and Swirly plankton plume in the Mediterranean Sea. Image by Norman Kuring, NASA’ s Ocean Color web. Image acquired on March 8, 2017. (b) Satellite image showing propagation of internal waves (red arrow) in the Mediterranean Sea. NASA Earth Observatory. Image acquired June 21, 2004. |
The ocean water moving east from the North Atlantic into the Mediterranean Sea has created turbulence in the form of internal waves (Fig. 17b). These internal waves— sometimes with amplitudes up to 80 m and wavelength up to 0.8 km[13] — occur primarily deep within the ocean, with just a mere crest emerging out through the surface. In cases of both plankton plumes and internal waves observed on the Mediterranean Sea side, the key controlling factor is the movement of ocean water through the strait. Aspects of origin of internal waves and tides along oceanic pycnoclines have been reviewed by Shanmugam (2013)[13] (Fig. 18). The link between internal waves and sediment plumes is not commonly discussed in the sedimentological literature. An exception is the study of Otsuchi Bay in Japan by (Masunaga et al. (2015)[14]. However, the exact configurations of plumes generated by internal waves are poorly understood.
 | Fig. 18. Conceptual diagram showing internal waves and tides along oceanic pycnoclines. From Shanmugam (2013)[13]. |
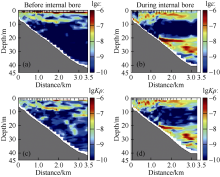
Masunaga et al. (2015)[14] made observations of the run-up of internal bores in a shallow bay with a tow-yo instrument and mooring arrays with high spatial and temporal resolution. Their observations showed that internal bores propagate along the slope, accompanied by strong turbulent mixing and strong sediment resuspension in a shallow bay (Fig. 19). The isothermal displacement due to the bores reached 20 m vertically in a water depth of 40 m. Turbidity measurements showed suspended particles transported from the sloping bottom and offshore above the thermocline, forming an intermediate nepheloid layer (INL). At the head of the bore (dense water), a vortex accompanied by strong vertical motion induced strong vertical sediment resuspension and a steep isothermal displacement.
 | Fig. 19. Model showing sediment mixing due to internal bore, Sanriku Coast and Otsuchi Bay, Japan. From Masunaga et al. (2015)[14] with additional labels by G. Shanmugam. |
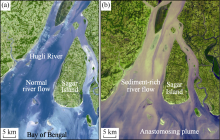
The Hugli River is a distributary of the Ganges River that empties its sediments into the Bay of Bengal. During monsoonal flood stages[53], the Hugli River develops anastomosing plumes at the mouth (Fig. 20). The Ganges River mouth is considered as a tide-dominated estuary[15]. The Bay of Bengal is known not only for severe monsoonal floods, but also for frequent cyclonic activity[21]. The origin of anastomosing plume type is not well understood. However, the Sagar Island and adjacent islands are rather permanent features that do control river flows and plume configurations.
 | Fig. 20. Ganges River. (a) Satellite image showing normal river flow (blue) at the mouth of the Hugli River, which is the westernmost distributary of the greater Ganges River. This site is popularly known as the “ Mouths of the Ganges” , where the Ganges empties its sediment into the Bay of Bengal. Note the river is blue in color because of poor sediment load. NASA images created by Jesse Allen, Earth Observatory. ASTER data provided courtesy of the NASA/GSFC/MITI/ERSDAC/JAROS, and U.S./ Japan. Image acquired on March 29, 2000. Additional labels by G. Shanmugam. (b) Satellite image showing sediment-rich river flow (tan color) and anastomosing plume at the mouth when the river is carrying full sediment load during periods of monsoonal floods. Image credit: NASA/METI/AIST/Japan Space Systems, and U.S./Japan ASTER Science Team. Image acquired on January 6, 2005. Additional labels by G. Shanmugam. |
The deep Gulf of Mannar (> 200 m bathymetry) and the shallow Palk Bay (< 7 m bathymetry), located between southeastern India and northern Sri Lanka, are in the northern Indian Ocean (Fig. 21a). This location provides an opportunity to understand the distribution of sediment plumes controlled by local bathymetry (Fig. 21d)[16], by reversal in monsoonal currents (Fig. 21b)[17], and by wave actions. Massive and swirly plumes are well developed in the shallow areas (Fig. 21b, 21c). Jagadeesan et al. (2013)[16] attributed the structuring of the mesozooplankton in this area to ocean currents. The significance of this case study is that plumes do not develop in the deep Gulf of Mannar.
 | Fig. 21. Gulf of Mannar, Indian Ocean. (a) Location map showing deep Gulf of Mannar (> 200 m) and shallow Palk Bay (< 7 m) in the Indian Ocean. From Jagadeesan et al. (2013)[16] with additional labels by G. Shanmugam. (b) MODIS-Terra satellite imagery showing massive and swirly sediment plumes in the Palk Bay in January (www.visibleearth.nasa.gov). The movement of sediment plumes from the Palk Bay to the Gulf of Mannar through the Pamban Pass (I) and Ramsethu (II) is evident (Two red arrows). From Jagadeesan et al. (2013)[16] with additional labels by G. Shanmugam. (c) Satellite image showing the position of Neduntivu and massive plume in the Palk Bay. Image Credit: Earth Snapshot. (d) Map of Northeast monsoon trend. Red circle = study area. WICC - West India coastal Current, LH - Lakshadweep High, WMC - Winter Monsoon Current, EICC - East India Coastal Currents. From Jagadeesan et al. (2013)[16]. |
The 0val-shaped island in the middle of the Palk Bay is called Nedunthivu (Tamil name meaning Long Island). The island’ s area is 50 km² , its length is 8 Km and its maximum width is about 6 km. Neduntivu, a flat island surrounded by shallow waters and beaches of coral chunks and sand, provides some of the sediment for the plume by wave actions.
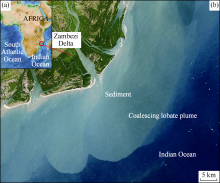
The Zambezi River in Central Mozambique is a wave- dominated delta. It has developed a coalescing lobate plume due to multiple river mouths (Fig. 22b). The importance of longshore currents in modifying the delta is discussed by Mikhailov et al. (2015)[18].
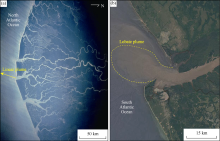
 | Fig. 22. Zambezi River Delta. (a) Index map showing the location of the Zambezi delta (red circle). Image credit: ETOPO1 Global Relief Model[49]. With additional labels by G. Shanmugam. (b) Satellite image showing coalescing lobate plume as a product of multiple river mouths of the Zambezi River, central Mozambique. Note the influence of wave actions and related beaches. NASA Earth Observatory images by Robert Simmon. Image acquired August 29, 2013. Additional labels by G. Shanmugam. |
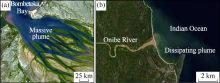
 | Fig. 23. Rivers in Madagascar. (a) Photographic image of the Betsiboka River showing massive plumes. Astronaut photograph ISS008-E-19233 was taken March 25, 2004. (b) Satellite image of the Onibe River showing dissipating plume with a sharp front. NASA Earth Observatory image created by Jesse Allen and Robert Simmon, using EO-1 ALI data provided courtesy of the NASA EO-1 team. Image acquired on February 19, 2012. |
 | Fig. 24. Rivers in West Africa. (a) NASA Space Shuttle Overflight photo of the Niger River showing linear plumes. Image acquired on September 19, 2005. (b) Satellite image of the Congo (Zaire) River showing lobate plume. Landsat 8 image acquired on March 2, 2015. |
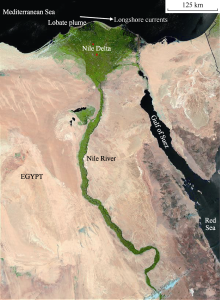
 | Fig. 25. Satellite image of the Nile Delta in Egypt showing lobate sediment plume. Note easterly longshore currents[32]. |
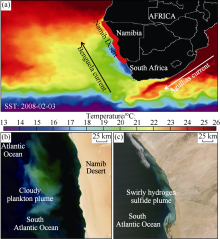
Southern African margin is characterized by the south- flowing Agulhas Current on the Indian Ocean side and the north-flowing Benguela Current on the Atlantic Ocean side (Fig. 26a). The nutrient-rich waters cause the Benguela Upwelling and related high chlorophyll concentrations on the southwestern Africa (Shillington et al., 1992)[20]. As a consequence, a well-developed cloudy plankton plume is visible in the waters off Namibia in early November 2007 on a NASA- MODIS satellite image (Fig. 26b). In a chemical process related to the demise of planktons and their consumption by bacteria also results in the release of toxic hydrogen sulfide plume (Fig. 26c). It is unclear as to how these chemical plumes will be reflected in the deposit.
 | Fig. 26. Continental margin off Namibia. (a) Sea Surface Temperature (SST) map showing the Agulhas Current and the Benguela Current. Note the long stretch of Namib Desert covering the entire country of Namibia. Image credit: SEOS. (b) Satellite image showing cloudy plankton plume off Namibia. Image credit: NASA Earth Observatory. NASA image courtesy the MODIS Rapid Response Team at NASA GSFC. Image acquired on November 8, 2007. (c) Satellite image showing swirly hydrogen sulfide plume off Namibia. Image credit: NASA Earth Observatory. Image courtesy Jacques Descloitres, MODIS Rapid Response Team at NASA GSFC. Image acquired on October 16, 2003. |
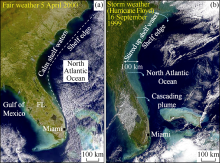
A wealth of satellite information is available on cyclone- induced sediment transport across the United States Atlantic shelf[21]. Category 4 Hurricane Floyd (September 7-17, 1999), for example, was nearly 933 km across. It affected the East Coast of the United States from Florida to Maine, with maximum damage to North Carolina. A comparison of satellite images of shelf waters shows a striking contrast in resuspended sediment between fair-weather and storm-weather periods (Fig. 27). During fair-weather periods, for example, shelf waters were calm and free of resuspended sediment along the Florida-Georgia-South Carolina-North Carolina coast (Fig. 27a). In contrast, during storm-weather periods, shelf waters contained abundant resuspended sediment as the tropical Hurricane Floyd passed over the East Coast on September 16, 1999. The power of Floyd was so intense that it stirred up the entire water column across the United States Atlantic continental shelf (Fig. 27b). In this area, the shelf is 100 km wide and 200 m deep at the shelf edge. These satellite images are the most convincing visual evidence for shelf-wide resuspension of sediment. These responded sediments that reach the shelf-slope break and cascade down the slope. Such plumes are labeled "cascading plume" (Fig. 27b).
 | Fig. 27. U.S. Atlantic Margin- (a) Satellite image showing calm shelf waters (dark blue) on a fair-weather day (April 5, 2000) along the Florida-Georgia-South Carolina-North Carolina coast. Note the influx of suspended sediments and organic matter (yellowish brown) from four rivers into the ocean along the coast. Dashed line indicates approximate position of the shelf edge. Image: NASA. (b) Satellite image showing stirred up shelf waters with resuspended sediments (cyan color) as Hurricane Floyd (storm weather) passed over these waters on September 16, 1999, along the Florida-Georgia-South Carolina-North Carolina coast. Note that the turbid zone is occupying the entire shelf width, which is approximately 100 km (62 mi) (double-headed arrow). The position of shelf edge (200 m) is revealed by the sudden change in water color from cyan (rich in suspended sediment above shallow shelf) to dark blue (poor in suspended sediment above deep slope). Three bent arrows show trends of sediment transport into the deep Atlantic Ocean. FL, Florida. Image credit: NASA. After Shanmugam (2008)[21]. |
Analogous to the 1999 Hurricane Floyd, which resuspended muddy sediments over the entire width of nearly 100 km shelf on the U.S. Atlantic margin (Fig. 27b), the 2009 Tropical Storm resuspended muddy sediments and caused a swirly cyclonic plume that is nearly 150 km in maximum width in the northern Gulf of Mexico (Fig. 28b).
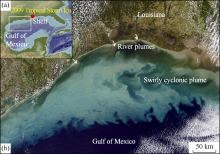
 | Fig. 28. Northern Gulf of Mexico. (a) Location map showing position of Tropical Storm Ida (red filled circle) that came ashore on November 10, 2009. (b) Satellite image showing cyclonic swirly plume occupying the entire shelf area in the northern Gulf of Mexico. NASA images courtesy Jeff Schmaltz, MODIS Rapid Response Team at NASA GSFC. Image acquired on November 10, 2009, just a few hours after the storm hit Alabama and Florida. Unlike riverine hyperpycnal plumes, transport of gravel, sand, and mud to deep-water environments by cyclone-related flows is possible. |
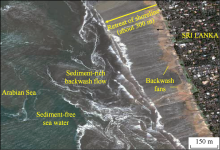
Tsunamis play a major role in both erosion and deposition of sediments. Shanmugam (2006)[22] explained tsunami-related deposition in deep-water environments in four progressive steps: (1) triggering stage, (2) tsunami stage, (3) transformation stage, and (4) depositional stage. The transformation stage is evident in sediment-rich backwash flows during the 2004 Indian Ocean tsunami at Kalutara Beach, southwestern Sri Lanka (Fig. 29). The incoming ocean waters are clearly blue in color (implying sediment free), but these waters transform into brown in color near the coast because of their incorporation of sediment. The transformation to brown color is the result of the wave breaking, These returning sediments are, both suspended and bedload components, are called "backwash plumes".
 | Fig. 29. 2004 Indian Ocean tsunami. An aerial image showing sediment-rich backwash flows (plumes) during the 2004 Indian Ocean tsunami. Note that position of shoreline has retreated seaward nearly 300 m (arrow) during the tsunami. Also note the development of backwash fans along the position of former shoreline, Kalutara Beach (south of Colombo), southwestern Sri Lanka. Image collected on December 26, 2004. Image credit: Courtesy of DigitalGlobe. Unlike riverine hyperpycnal plumes, transport of gravel, sand, and mud to deep-water environments by tsunami-related flows is possible. After Shanmugam (2006)[22], with permission from SEPM. |
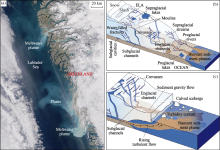
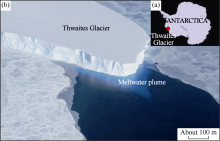
Meltwater sediment plumes from ice sheets of Greenland are common in the Labrador Sea (Fig. 30a). Chu (2014)[23] reviewed the elements of the Greenland ice sheet hydrologic system and proposed depositional models for the buoyant sediment plumes and turbidity currents (Fig. 30c). Mankoff et al (2016)[54] discussed structure and dynamics of a subglacial discharge plume in a Greenlandic fjord.
 | Fig. 30. Greenland. (a) Satellite image showing meltwater plumes in the Labrador Sea from Greenland. NASA Earth Observatory image by Jesse Allen, using data from the Level 1 and Atmospheres Active Distribution System(LAADS). Image acquired on October 1, 2014. (b) and (c) Elements of the Greenland ice sheet hydrologic system showing generation of buoyant sediment plumes and turbidity currents. Note that this author distinguished turbidity currents from meltwater plumes. From Chu (2014)[23], modified after Cuffey and Patterson (2010)[24]. |
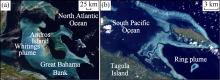
The most striking feature of the Great Bahama Bank is the swath of whitish blue waters west of the Andros Island (Fig. 32a). This swath of waters is nearly 350 km in length in the northwest-southeast direction and about 100 km in width, just west of the Andros Island. This swath is labeled as "whitings plume" (Fig. 32a). The reason is that the region west of Andros Island on the Great Bahama Bank is dominated by fine lime mud and pellet mud sediments[57]. The seas overlying these muds are well known for episodic, highly turbid events that produce milky white waters, historically referred to as “ whitings” [58]. The origin of whitings has been attributed to both direct precipitation of lime mud[58, 59] and by resuspension by fish activities[25], by wind[26], and by the Florida Current[27].
 | Fig. 32. Carbonate platforms and reefs. (a) Satellite image showing a large swath of whitings plume, just west of the Andros Island, Great Bahama Bank. NASA image created by Jeff Schmaltz, MODIS Rapid Response Team, Goddard Space Flight Center. Image acquired on February 12, 2009. (b) Satellite image showing ring plume in the South Pacific Ocean, near the Tagula Island. NASA image by Jesse Allen and Rob Simmon, using data provided by the United States Geological Survey. NASA caption by Rebecca Lindsey. Image acquired on January 13, 2002. |
In the South Pacific Ocean, coral reef environments have developed a ring plume (Fig. 32b). In the South Pacific, the dark blue waters of the Coral and Solomon Seas, the coral reefs and forested islands of the Louisiade Archipelago stretch southeastward from the tip of Papua New Guinea for over 350 kilometers. The lower left corner of the satellite image shows part of the northwestern coast of the largest island in the archipelago, Tagula Island (also called Vanatinai Island). The Louisiade Archipelago has reefs and islands that are in various stages of “ evolution” from fringing reef to coral atolls, which result in ring plumes (Fig. 32b). Khanna and Yadav (2008)[28] discussed reef development near the Tagula Island.
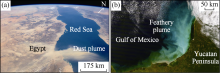
An astronaut photograph showing a dust plume surging out over the Red Sea and reaching most of the way to Saudi Arabia (Fig. 33a). The point source of this plume is the delta of the southern Egyptian river Khor Baraka. Invariably, dust plumes are highly variable in shapes. This is because at the time of contact of dust from air to water, local oceanographic factors, such as ocean currents coupled with waves, would determine plume shapes.
 | Fig. 33. Red Sea and southern Gulf of Mexico. (a) Satellite image showing dust plumes shooting off from Egypt into the Red Sea. Width of plume is about 150 km. Dust plumes exhibit complex configurations. NASA/JSC Gateway to Astronaut Photography of Earth. Astronaut photograph ISS036-E-11050 was acquired on June 22, 2013. (b) Satellite image showing feathery plume resulting from both sediment and plankton in the southern Gulf of Mexico off the Yucatan Peninsula. NASA image courtesy the MODIS Rapid Response Team at NASA GSFC. Image acquired on December 14, 2008. Caption by Holli Riebeek. |
Satellite images off the Yucatan Peninsula show feathery plume (Fig. 33b). The plume is a complex mix of both sediment and plankton. Both winds and waves are considered responsible for the generation of plumes. The blue-green cloud in this image roughly matches the extent of the shallow continental shelf west of the Yucatan Peninsula. A few days before the image was taken by NASA, strong winds churned the Gulf. The sediment was probably brought to the surface in shallow waters by strong waves.
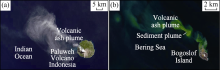
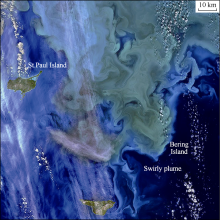
Volcanic ash plumes were reported from Bogoslof Island, Bering Sea in June 2017 (Fig. 34b). The challenge in studying volcanic ash plumes is that they travel hundreds to thousands of kilometers depending on the magnitude of eruptions, global atmospheric circulation patterns, and bulk density of ash[29]. Furthermore, analogous to dust plume, volcanic ash plumes are highly variable in shapes.
 | Fig. 34. Volcanic explosions. (a) Satellite image of ash plume from Paluweh volcano in Indonesia. Image credit: Robert Simmon, NASA Earth Observatory using data from USGS and NASA. Image acquired on April 29, 2013. (b) Satellite image showing volcanic ash plume, Bogoslof Island, Bering Sea. NASA Earth Observatory image by Joshua Stevens, using Landsat data from the U.S. Geological Survey. Image acquired on June 5, 2017. |
 | Fig. 35. Planktonic plumes. Satellite image of the Pribilof Islands in Bering Sea showing swirly and other complex shapes of phytoplankton blooms. NASA Earth Observatory images by Jesse Allen and Norman Kuring, using Landsat 8 data from the U.S. Geological Survey. Image acquired on September 22, 2014.2.25. Gas hydrate plume |
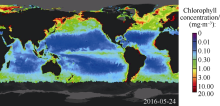
 | Fig. 36. Visualization of chlorophyll plumes over the entire globe. This visualization, derived using data from the Moderate Resolution Imaging Spectroradiometer (MODIS) instrument, shows a daily running weighted 31 day average of sea surface chlorophyll from January 2010 through May 2016. Date of image: May 24, 2016. NASA-MODIS used algorithms in their chlorophyll visualization. |
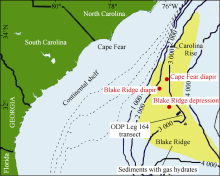
Paull et al. (1995)[30] reported that seafloor venting of microbial gases occurs at 2 167 m water depth over the Blake Ridge diapir on the Carolina Continental Rise. Gas-rich plumes were identified acoustically in the water column up to 320 m above a pockmarked sea floor associated with active chemosynthetic biological communities. In this area, plumes and venting fluids emanate from near a small fault that extends downward toward a dome in the bottom-simulating reflector (BSR), indicating that fluid and/or gas migration is associated with gas hydrate-bearing sediment below. These plumes might be caused by gas bubbles or buoyant clumps of gas hydrate that float upward from the seafloor. Distribution of gas hydrates has been mapped (Fig. 37).
 | Fig. 37. Map showing the area of sediments with gas hydrates (yellow). Note the location of the 1995 ODP (Ocean Drilling Program) 164 transect (Paull et al., 2000)[60]. This map area was the focus of NOAA’ s 2003 ‘ Windows to the Deep’ expedition (Co-Chief Scientist: Carolyn Ruppel). Map modified after: Accessed April 4, 2011. Figure from Shanmugam (2012)[39]. |
Ruppel and Kessler (2017)[61] discussed aspects of subglacial model gas hydrates in high latitude regions.
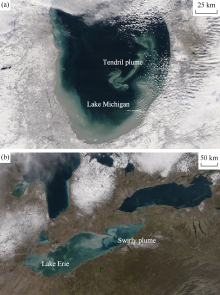
Satellite image shows tendril configuration of plumes in Lake Michigan (Fig. 38a). In this example, suspended sediments transformed the southern end of Lake Michigan. Ranging in color from brown to green, the sediment filled the surface waters along the southern coastline and formed a long, curving tendril extending toward the middle of the lake, induced by wind activity.
 | Fig. 38. Density plumes in Great Lakes, USA. (a) Satellite image showing a tendrill plume in Lake Michigan. NASA image courtesy MODIS Rapid Response Team at NASA GSFC. Image acquired on December 17, 2010. (b) Satellite image showing swirly plume induced by seiche in Lake Erie. NASA Earth Observatory image by Jesse Allen, using VIIRS data from the Suomi National Polar-orbiting Partnership. Suomi NPP is the result of a partnership between NASA, the National Oceanic and Atmospheric Administration, and the Department of Defense. Image acquired on November 25, 2015. |
Swirly plumes in Lake Erie (Fig. 38b), USA were attributed to seiche[1]. Seiche is a large standing wave that occurs when strong winds and a quick change in atmospheric pressure push water from one end of a body of water to the other. de Jong and Battjes (2004)[31] discussed the atmospheric origin of seiche.
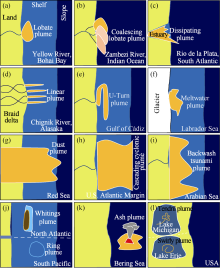
In this first attempt, 24 different configurations of density plumes have been recognized. They do not constitute a systematic classification based on a single unifying concept. For example, although most configurations are named after shape (e.g., lobate), other factors are also used, such as color (e.g., whitings), process (e.g., eolian), etc. The 24 types are broadly grouped into 14 general categories (Fig. 39). Given this complex variability, any attempt to advocate facies models for deposits of hyperpycnal flows, under the false assumption that river- mouths are the only type of hyperpycnal flows, is misleading.
 | Fig. 39. Summary diagram showing 14 general types of plumes that include 12 marine examples and two lacustrine examples. Note that there are 24 types (see Fig. 40). (a) Lobate plume developed by a single river channel. (b) Coalescing lobate plume developed by multiple river channels. (c) Dissipating plume with an irregular front developed within a major estuary. (d) Linear plume developed in a braid delta (McPherson et al., 1987)[6]. (e) U-Turn plume developed in response to influence by ocean currents. (f) Meltwater plume developed from glacier. (g) Dust plume from eolian processes that can transport dust beyond the shelf edge. (h) Cascading plume developed during cyclones that tend to transport sediment (gravel, sand, and mud) beyond the shelf break (Shanmugam, 2008[21]. (i) Backwash plume developed during tsunamis that tend to transport sediment (gravel, sand, and mud) beyond the shelf break (Shanmugam, 2006)[22]. (j) Whitings plume and ring plume developed in carbonate environments. (k) Ash plume developed during volcanic eruptions. (l) Tendril and swirly plumes developed in lakes. Note that with the exception of cyclones and tsunamis, none of the other plumes can transport sand and gravel to the deep sea by bedload mode. Although these different types can be recognized on modern systems usingsatellite or other photographic images, individual types cannot be distinguished in the ancient sedimentary record yet. From Shanmugam (2018a)[44]. |
This and other recent studies have revealed that there are major implications for understanding 1) external controls, 2) hyperpycnal flows, 3) submarine fans, and 4) deep-water petroleum reservoirs.
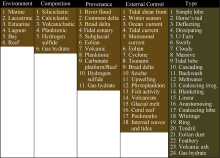
External controls are allogenic in nature, which are external to the depositional system, such as uplift, subsidence, climate, eustacy, etc. However, external controls of density plumes are much more variable and include some common depositional processes (e.g., tidal currents). At least, 18 external controls of plumes have been recognized in this review (Fig. 40): 1) Tidal shear front (Fig. 3): The Yellow River[3]; 2) Winter season (Fig. 6): The Yangtze River[5]; 3) Ocean currents (Fig. 14): Rio de la Plata Estuary[4, 51, 52]; 4) Tidal currents (Fig. 12): San Francisco Bay[1, 8]; 5) Monsoonal current (Fig. 21): Indian Ocean[16]; 6) Eolian (Fig. 33): Red Sea; 7) Cyclones (Fig. 27): Gulf of Mexico, U. S. Atlantic shelf[21]; 8) Tsunamis (Fig. 29): Sri Lanka, Arabian[22]; 9) Braid delta and related high gradients and coarse sediments (Fig. 8): Alaska, Pacific Ocean[6]; 10) Seiche in lakes (Fig. 38b): Lake Erie, USA[1]. Seiche is a large standing wave that occurs when strong winds and a quick change in atmospheric pressure push water from one end of a body of water to the other. de Jong and Battjes (2004)[31] discussed the atmospheric origin of seiche. 11) Upwelling (Fig. 26): Off Namibia[20]; 12) Phyoplankton (Fig. 26): Off Namibia; 13) Fish activity (Fig. 32): The Great Bahama Bank[25]; 14) Volcanic eruptions (Fig. 34b): Bering Sea)[1]; 15) Glacial melt (Fig. 30): Greenland[23]; 16) Coral reef (Fig. 32b): South Pacific Ocean[1]; 17) Pockmarks: Carolina Continental Rise (Fig. 37), North Atlantic Ocean[30]; 18) Internal waves and tides[13] and related internal bores (Fig. 19).
 | Fig. 40. Summary diagram showing complex natural variability of plumes in terms of their environmental settings, their composition, their source, their external control, and types. See Table 1 for specific case studies and related references. This compilation of factors should be considered preliminary. For example, gas hydrate is included in more than one category. Additional studies are needed. Modified after Shanmugam (2018a)[44]. |
I have discussed the importance of external controls, such as tidal shear front and ocean currents earlier. Future studies should consider external controls in developing meaningful depositional models.
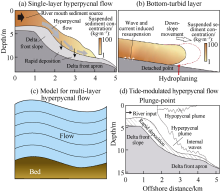
In discussing river-mouth processes, geologists, geophysicists, and hydraulic engineers use process terms to represent hyperpycnal flows that are not consistent in meaning with each other, such as single-layer and multi-layer hyperpycnal flows (Fig. 41). For example, the following 16 concepts and terms are used in the literature[3, 34, 35, 54, 62, 63, 64, 65, 66, 67, 68, 69, 70, 71, 72, 73, 74, 75]: 1) density flow[55], 2) underflow[34], 3) hyperpycnal flow[33, 56], 4) hyperpycnal underflow[34], 5) hyperconcentrated flow[57], 6) low-density hyperpycnal plume[34], 7) high-density hyperpycnal plume[34], 8) high-turbid mass flow[58], 9) supercritical hyperpycnal flow[59], 10) tide-modulated hyperpycnal flow (Fig. 41D)[3], 11) cyclone-induced hyperpycnal turbidity current[60], 12) buoyancy-dominated flow[61], 13) hyperpycnal turbidity current[62], 14) turbidity front[47], 15) turbidity current[34, 63, 64, 65, 66], 16) multi-layer hyperpycnal flows[67].
 | Fig. 41. Variable types of hyperpycnal flows. (a) Single-layer hyperpycnal flow, Yellow River, China. From Gao et al. (2015)[76]. (b) Bottom turbid layer with density and velocity stratification (i.e., debris flow with hydroplaning, red arrow added in this article, see text) Yellow River, China. The red line represents the downslope variation trend of the BTL. From Gao et al. (2015)[76]. Additional labels by G. Shanmugam. (c) Multi-layer hyperpycnal flow in numerical modeling (de Luna et al., 2017)[75]. Note that multi-layer numerical modeling was also applied to hypopycnal flows. (d) Tide-modulated hyperpycnal flow[3, 79], Yellow River (Wang et al., 2010; modified after Wright et al., 1988), with permission from John Wiley and Sons. Color labels by G. Shanmugam. Note internal waves. Internal waves occur only along pycnoclines (Shanmugam, 2013)[13], but there is no indication of pycnoclines in this diagram. |
In this context, Gao et al. (2015)[76] suggested that the Yellow River has undergone a regime shift in response to resuspension induced by tidal currents and waves. This shift has presumably resulted in the replacement of hyperpycnal flows by bottom-turbid layers. The difference between the two is that hyperpycnal flows behave as a single layer without vertical stratification in density or velocity (Fig. 41a), whereas bottom-turbid layers reveal vertical stratification in density and velocity (Fig. 41b). Clearly, there is no clarity on the fluid mechanics of hyperpycnal lows among various researchers. Amid this uncertainty, it is premature to apply genetic facies models of hyperpycnites to petroleum reservoirs (e.g., Yang et al., 2017b)[77, 78].
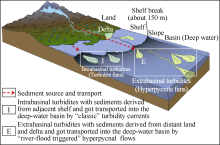
Conventionally, submarine fans were related to deposition from turbidity currents[80]. Recently, origin of submarine fans have been attributed to hyperpycnal flows[74, 82]). Zavala and Arcuri (2016)[74] proposed two types of hypothetical hyperpycnal flows, namely, sandy and muddy types. In this classification, the lofting plume (i.e., positively buoyant) in sandy hyperpycnal flows is of significance. Similar lofting models were also proposed by Steel et al. (2016)[82]. Zavala and Ar-curi (2016)[74] also used the classification of turbidity currents by Mutti et al. (1994)[83] into low-density turbidity currents and high-density turbidity currents. Despite our poor understanding[84, 85] of the behavior of high-density turbidity currents and hyperpycnal flows in deep-water environments (Shanmugam, 2016; 2018b), Zavala and Arcuri (2016)[74] proposed two types of hyperpycnal flows, namely, sandy and muddy types. Importantly, they proposed two types of turbidites, namely "intrabasinal turbidites" and "extrabasinal turbidites" (Fig. 42). Intrabasinal turbidites are those with sediments derived locally from adjacent shelf and got transported into the basin by “ classic” turbidity currents. In contrast, extrabasinal turbidites are those with sediments derived from distant land and delta and got transported into the basin by “ flood- triggered" turbidity currents or hyperpycnal flows (Fig. 42). However, there are major problems with these concepts (Shanmugam, 2018a)[44]:
1)The concept of lofting hyperpycnal flow is problematic because it defies basic principles of buoyancy. In discussing buoyancy effects in fluids, Turner (1980)[86] explained that positively buoyant plumes cannot be hyperpycnal (i.e., plume with excess density cannot loft). By definition, hyperpycnal flows are negatively buoyant due to their excess density.
 | Fig. 42. Conceptual block diagram of submarine fans showing the occurrence of intrabasinal and extrabasinal turbidites. Note that extrabasinal turbidites receive a direct supply from rivers in flood, and can accumulate shelfal or deep marine deposits. This model ignores external controls, such as tidal shear fronts and ocean currents, which prevent transport of hyperpycnal sediments from the river mouth to the deep sea. This model also ignores types of submarine canyons, which are critical for fan deposition (see text). Block diagram from Zavala and Arcuri, 2016[74], with dditional labels by G. Shanmugam. |
2) Zavala and Arcuri's (2016)[74] classified turbidity currents and fans based on provenance (internal source vs. external source), which is in conflict with the conventional definition of turbidity currents based on Newtonian rheology and turbulent state[87, 88].
3) The hypothetical model of extrabasinal turbidites and related hyperpycnite fans is untenable for two reasons. First, the concept of high-density turbidity currents, which serves as the basis, is not only theoretically flawed[89], but also empirically undocumented in the world's oceans[90]). Second, the model fails to take into account the most fundamental factor on developing submarine fans, which is submarine canyons[44].
4) Modern examples do not show development of submarine fans by hyperpycnal flows in modern settings. For example, hyperpycnal flows and related sediment plumes are totally absent in the deep Gulf of Mannar (Fig. 21b).
1)The river-flow triggered turbidity currents (i.e., hyperpycnal flows)[72] in experiments are purely muddy flows (Fig. 43).
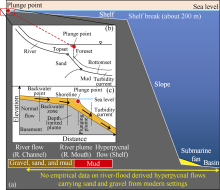
 | Fig. 43. Continental margin, flume experiments, and empirical data on hyperpycnal flows. (a) Conceptual diagram of a continental margin showing relative positions of plunge point (red filled circle) at river mouth and submarine fan at base-of-slope. Average shelf width = 80 km. Maximum shelf width = 1500 km. Note that all published data on river-flood derived hypepycnal flows are muddy in texture and they occur close to the shoreline in inner shelf environments. There has not been any study documenting transport of sand and gravel by river-flood triggered hyperpycnal lows across the entire continental shelf and into the deep-water basin in modern settings (double headed arrow). However, there are examples of plumes that reach the shelf edge and beyond. Such plumes are triggered by cyclones, tsunamis, eolian dust, volcanic explosions, chlorophyll, etc., but not by river floods. (b) Schematic diagram, based on flume experiments conducted using fresh water as standing body, showing transformation of river current into turbidity current at plunge point (red filled circle). Note that this experiment using fresh water is applicable to fresh water lakes, but not to marine settings (sea or ocean). From Kostic et al. (2002)[72] with additional labels by G. Shanmugam. SEPM. (c) Schematic diagram with backwater zone showing transformation of river plume into turbidity currents at plunge point (red filled circle). Note the close similarity between (b) and (c) on the initiation of turbidity currents at plunge point. In this study, the term "hyerpycnal flow" is used for flows seaward of the plunge point, instead of turbidity current (see text). From Lamb et al. (2010)[73], with additional symbols by G. Shanmugam. GSA. Modified after Shanmugam (2018a)[44]. |
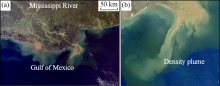
2) Published data on river-flood derived hypepycnal flows are muddy in texture and they occur close to the shoreline in inner shelf environments. There has not been any study documenting transport of sand and gravel by river-flood triggered hyperpycnal lows across the entire continental shelf and into the deep-water basin in modern settings (double headed arrow, Fig. 43a). Mississippi River generates some spectacular density plumes at its mouth in shallow-water shelf environments (Fig. 44). But we do not know whether these plumes reach the deep sea. Available data show that density plumes tend to dissipate and die out as they travel away from the shoreline within a few kilometers (Fig. 44b). However, there are examples of plumes that reach the shelf edge and beyond. Such plumes are triggered by cyclones, tsunamis, eolian dust, volcanic explosions, upwelling, etc., but they are unrelated to river floods.
 | Fig. 44. Mississippi River. (a) Satellite image of the Mississippi River showing well-developed density plumes at river mouths. Image courtesy Liam Gumley, Space Science and Engineering Center, University of Wisconsin-Madison and the MODIS science team. Image acquired on March 5, 2001. (b) An enhanced image of a dissipating density plume from the Mississippi River by Brian Romans published in his blog Clastic Detritus on April 20, 2009 using NASA's image. Additional labels by G. Shanmugam.. |
3) An important lesson learned from this study is that most river-mouth plumes are deflected or blocked by external controls. Therefore, hypypycnal flows are not viable transport mechanisms of sand and gravel across the shelf into the deep sea.
4) In a comprehensive review of hyperpycnal flows, Talling (2014, p. 179)[92] concluded that "Weak and dilute flows generated by plunging hyperpycnal flood discharges most likely deposits thin (mm to < 10 cm) and fine grained sediment layers, similar to those documented for hyperpycnal flows in lakes and reservoirs (Fig. 6d, 6e). The available field observations suggest that they do not form meter-thick sand layers in deep water settings, as has been previously proposed (Mulder et al., 2003)."
For the above reasons, river-flood triggered hyperpycnites are considered unsuitable for serving as petroleum reservoirs in deep-water environments until proven otherwise.
A global evaluation of density plumes suggests (Fig. 40): six different environments, six compositional material, 11 sources, 18 external controls, and 24 configurations. Despite their wide natural variability, individual density plumes have not been investigated to understand their depositional characteristics. The challenge in studying density plumes is that a single type (e.g., swirly) can be generated by different mechanisms (e.g., cyclone, seiche, upwelling, etc.). To date, no one has investigated how these different types of density plumes are preserved in the sedimentary record.
The results of this study raise some fundamental questions:
1) Are configurations of density plumes ephemeral or sustained for a period of time?
2) Does each configuration result in a unique depositional layer?
3) What is the relationship between depositional environment and plume configuration?
4) How external factors control plume configuration?
5) Can we distinguish deposit of a particular plume configuration from associated turbidites, contourites, or hemipelagites?
Amid these obstacles, opportunities do exist for future research projects.
I thank Dr. Huaixian Xu, Executive Chief Editor of Petroleum Exploration and Development (PED) for inviting me to contribute this article for the Special Issue of PED in celebrating the 60th anniversary of RIPED. 2018 also marks the 10th anniversary of my association with RIPED. I am grateful to NASA for their excellent collection of satellite and other images of density plumes triggered by rivers, tides, glaciers, volcanic eruptions, cyclones, etc. I also thank NASA, Jet Propulsion Laboratory, NOAA, Wikipedia, Clastic Detritus, SEOS, AAPG Bulletin, GSA Bulletin, Geology, Journal of Palaeogeography, Oceanography, Progress in Oceanography, Journal of Sedimentary Research, American Geophysical Union, Elsevier, Wiley, Butterworth-Heinemann, DigitalGlobe, and R. D. Kreisa for their images used in this article. As always, I am thankful to my wife Jean for her general comments.
The authors have declared that no competing interests exist.
| [1] |
|
| [2] |
|
| [3] |
|
| [4] |
|
| [5] |
|
| [6] |
|
| [7] |
|
| [8] |
|
| [9] |
|
| [10] |
|
| [11] |
|
| [12] |
|
| [13] |
|
| [14] |
|
| [15] |
|
| [16] |
|
| [17] |
|
| [18] |
|
| [19] |
|
| [20] |
|
| [21] |
|
| [22] |
|
| [23] |
|
| [24] |
|
| [25] |
|
| [26] |
|
| [27] |
|
| [28] |
|
| [29] |
|
| [30] |
|
| [31] |
|
| [32] |
|
| [33] |
|
| [34] |
|
| [35] |
|
| [36] |
|
| [37] |
|
| [38] |
|
| [39] |
|
| [40] |
|
| [41] |
|
| [42] |
|
| [43] |
|
| [44] |
|
| [45] |
|
| [46] |
|
| [47] |
|
| [48] |
|
| [49] |
|
| [50] |
|
| [51] |
|
| [52] |
|
| [53] |
|
| [54] |
|
| [55] |
|
| [56] |
|
| [57] |
|
| [58] |
|
| [59] |
|
| [60] |
|
| [61] |
|
| [62] |
|
| [63] |
|
| [64] |
|
| [65] |
|
| [66] |
|
| [67] |
|
| [68] |
|
| [69] |
|
| [70] |
|
| [71] |
|
| [72] |
|
| [73] |
|
| [74] |
|
| [75] |
|
| [76] |
|
| [77] |
|
| [78] |
|
| [79] |
|
| [80] |
|
| [81] |
|
| [82] |
|
| [83] |
|
| [84] |
|
| [85] |
|
| [86] |
|
| [87] |
|
| [88] |
|
| [89] |
|
| [90] |
|
| [91] |
|
| [92] |
|