Unconventional hydrocarbon resources in China and the prospect of exploration and development
1
2012
... With dramatically increasing global energy demands, the unconventional hydrocarbon resources have been regarded as a necessary alternative for the oil and gas resources exploration and development [1⇓-3]. The natural gas stored in low-permeability (tight) sandstone reservoirs is an important target for exploration and development of unconventional petroleum resources [4-5] and also serves as the national stratagic energy resource in China for reserve and production increase[6-7]. Evident differences have been reported in the accumulation characteristics and mechanisms of low-permeability (tight) sandstone gas reservoirs in comparison with conventional reservoirs [8⇓-10], of which primary gas migration from source rock to reservoir, namely, the charging process, is key for the accumultion of low-permeability (tight) sandstone gas reservoirs. The reasons for the differences lay in the space configuration of the interbedded source and reservoir rocks and the nano- to micro-meter pore system in these reserovirs [11⇓⇓-14]. The fluid flow mechanism in the charging process determines the charging behaviors, fluid occurrence states, and accumulation degree in low-permeability (tight) sandstone reservoir, which is critial for understanding the natural gas charging mechanism [11,15⇓ -17]. ...
Geological concepts, characteristics, resource potential and key techniques of unconventional hydrocarbon: On unconventional petroleum geology
1
2013
... With dramatically increasing global energy demands, the unconventional hydrocarbon resources have been regarded as a necessary alternative for the oil and gas resources exploration and development [1⇓-3]. The natural gas stored in low-permeability (tight) sandstone reservoirs is an important target for exploration and development of unconventional petroleum resources [4-5] and also serves as the national stratagic energy resource in China for reserve and production increase[6-7]. Evident differences have been reported in the accumulation characteristics and mechanisms of low-permeability (tight) sandstone gas reservoirs in comparison with conventional reservoirs [8⇓-10], of which primary gas migration from source rock to reservoir, namely, the charging process, is key for the accumultion of low-permeability (tight) sandstone gas reservoirs. The reasons for the differences lay in the space configuration of the interbedded source and reservoir rocks and the nano- to micro-meter pore system in these reserovirs [11⇓⇓-14]. The fluid flow mechanism in the charging process determines the charging behaviors, fluid occurrence states, and accumulation degree in low-permeability (tight) sandstone reservoir, which is critial for understanding the natural gas charging mechanism [11,15⇓ -17]. ...
Tight gas sands
1
2006
... With dramatically increasing global energy demands, the unconventional hydrocarbon resources have been regarded as a necessary alternative for the oil and gas resources exploration and development [1⇓-3]. The natural gas stored in low-permeability (tight) sandstone reservoirs is an important target for exploration and development of unconventional petroleum resources [4-5] and also serves as the national stratagic energy resource in China for reserve and production increase[6-7]. Evident differences have been reported in the accumulation characteristics and mechanisms of low-permeability (tight) sandstone gas reservoirs in comparison with conventional reservoirs [8⇓-10], of which primary gas migration from source rock to reservoir, namely, the charging process, is key for the accumultion of low-permeability (tight) sandstone gas reservoirs. The reasons for the differences lay in the space configuration of the interbedded source and reservoir rocks and the nano- to micro-meter pore system in these reserovirs [11⇓⇓-14]. The fluid flow mechanism in the charging process determines the charging behaviors, fluid occurrence states, and accumulation degree in low-permeability (tight) sandstone reservoir, which is critial for understanding the natural gas charging mechanism [11,15⇓ -17]. ...
Deep basin gas trap, western Canada
1
1979
... With dramatically increasing global energy demands, the unconventional hydrocarbon resources have been regarded as a necessary alternative for the oil and gas resources exploration and development [1⇓-3]. The natural gas stored in low-permeability (tight) sandstone reservoirs is an important target for exploration and development of unconventional petroleum resources [4-5] and also serves as the national stratagic energy resource in China for reserve and production increase[6-7]. Evident differences have been reported in the accumulation characteristics and mechanisms of low-permeability (tight) sandstone gas reservoirs in comparison with conventional reservoirs [8⇓-10], of which primary gas migration from source rock to reservoir, namely, the charging process, is key for the accumultion of low-permeability (tight) sandstone gas reservoirs. The reasons for the differences lay in the space configuration of the interbedded source and reservoir rocks and the nano- to micro-meter pore system in these reserovirs [11⇓⇓-14]. The fluid flow mechanism in the charging process determines the charging behaviors, fluid occurrence states, and accumulation degree in low-permeability (tight) sandstone reservoir, which is critial for understanding the natural gas charging mechanism [11,15⇓ -17]. ...
Method for assessing continuous-type (unconventional) hydrocarbon accumulations: GAUTIER D L, DOLTON G L, TAKAHASHI K I, et al. 1995 National assessment of united states oil and gas resources: Results, methodology, and supporting data
1
1995
... With dramatically increasing global energy demands, the unconventional hydrocarbon resources have been regarded as a necessary alternative for the oil and gas resources exploration and development [1⇓-3]. The natural gas stored in low-permeability (tight) sandstone reservoirs is an important target for exploration and development of unconventional petroleum resources [4-5] and also serves as the national stratagic energy resource in China for reserve and production increase[6-7]. Evident differences have been reported in the accumulation characteristics and mechanisms of low-permeability (tight) sandstone gas reservoirs in comparison with conventional reservoirs [8⇓-10], of which primary gas migration from source rock to reservoir, namely, the charging process, is key for the accumultion of low-permeability (tight) sandstone gas reservoirs. The reasons for the differences lay in the space configuration of the interbedded source and reservoir rocks and the nano- to micro-meter pore system in these reserovirs [11⇓⇓-14]. The fluid flow mechanism in the charging process determines the charging behaviors, fluid occurrence states, and accumulation degree in low-permeability (tight) sandstone reservoir, which is critial for understanding the natural gas charging mechanism [11,15⇓ -17]. ...
Development characteristics and orientation of tight oil and gas in China
1
2019
... With dramatically increasing global energy demands, the unconventional hydrocarbon resources have been regarded as a necessary alternative for the oil and gas resources exploration and development [1⇓-3]. The natural gas stored in low-permeability (tight) sandstone reservoirs is an important target for exploration and development of unconventional petroleum resources [4-5] and also serves as the national stratagic energy resource in China for reserve and production increase[6-7]. Evident differences have been reported in the accumulation characteristics and mechanisms of low-permeability (tight) sandstone gas reservoirs in comparison with conventional reservoirs [8⇓-10], of which primary gas migration from source rock to reservoir, namely, the charging process, is key for the accumultion of low-permeability (tight) sandstone gas reservoirs. The reasons for the differences lay in the space configuration of the interbedded source and reservoir rocks and the nano- to micro-meter pore system in these reserovirs [11⇓⇓-14]. The fluid flow mechanism in the charging process determines the charging behaviors, fluid occurrence states, and accumulation degree in low-permeability (tight) sandstone reservoir, which is critial for understanding the natural gas charging mechanism [11,15⇓ -17]. ...
Comparison study on accumulation & distribution of tight sandstone gas between China and the United States and its significance
1
2012
... With dramatically increasing global energy demands, the unconventional hydrocarbon resources have been regarded as a necessary alternative for the oil and gas resources exploration and development [1⇓-3]. The natural gas stored in low-permeability (tight) sandstone reservoirs is an important target for exploration and development of unconventional petroleum resources [4-5] and also serves as the national stratagic energy resource in China for reserve and production increase[6-7]. Evident differences have been reported in the accumulation characteristics and mechanisms of low-permeability (tight) sandstone gas reservoirs in comparison with conventional reservoirs [8⇓-10], of which primary gas migration from source rock to reservoir, namely, the charging process, is key for the accumultion of low-permeability (tight) sandstone gas reservoirs. The reasons for the differences lay in the space configuration of the interbedded source and reservoir rocks and the nano- to micro-meter pore system in these reserovirs [11⇓⇓-14]. The fluid flow mechanism in the charging process determines the charging behaviors, fluid occurrence states, and accumulation degree in low-permeability (tight) sandstone reservoir, which is critial for understanding the natural gas charging mechanism [11,15⇓ -17]. ...
geological survey assessment model for continuous (unconventional) oil and gas accumulations: The “FORSPAN” model: U.S. geological survey bulletin 2168
1
1999
... With dramatically increasing global energy demands, the unconventional hydrocarbon resources have been regarded as a necessary alternative for the oil and gas resources exploration and development [1⇓-3]. The natural gas stored in low-permeability (tight) sandstone reservoirs is an important target for exploration and development of unconventional petroleum resources [4-5] and also serves as the national stratagic energy resource in China for reserve and production increase[6-7]. Evident differences have been reported in the accumulation characteristics and mechanisms of low-permeability (tight) sandstone gas reservoirs in comparison with conventional reservoirs [8⇓-10], of which primary gas migration from source rock to reservoir, namely, the charging process, is key for the accumultion of low-permeability (tight) sandstone gas reservoirs. The reasons for the differences lay in the space configuration of the interbedded source and reservoir rocks and the nano- to micro-meter pore system in these reserovirs [11⇓⇓-14]. The fluid flow mechanism in the charging process determines the charging behaviors, fluid occurrence states, and accumulation degree in low-permeability (tight) sandstone reservoir, which is critial for understanding the natural gas charging mechanism [11,15⇓ -17]. ...
Hydrocarbon accumulation patterns of large tight oil and gas fields
1
2013
... With dramatically increasing global energy demands, the unconventional hydrocarbon resources have been regarded as a necessary alternative for the oil and gas resources exploration and development [1⇓-3]. The natural gas stored in low-permeability (tight) sandstone reservoirs is an important target for exploration and development of unconventional petroleum resources [4-5] and also serves as the national stratagic energy resource in China for reserve and production increase[6-7]. Evident differences have been reported in the accumulation characteristics and mechanisms of low-permeability (tight) sandstone gas reservoirs in comparison with conventional reservoirs [8⇓-10], of which primary gas migration from source rock to reservoir, namely, the charging process, is key for the accumultion of low-permeability (tight) sandstone gas reservoirs. The reasons for the differences lay in the space configuration of the interbedded source and reservoir rocks and the nano- to micro-meter pore system in these reserovirs [11⇓⇓-14]. The fluid flow mechanism in the charging process determines the charging behaviors, fluid occurrence states, and accumulation degree in low-permeability (tight) sandstone reservoir, which is critial for understanding the natural gas charging mechanism [11,15⇓ -17]. ...
Resource types, formation, distribution and prospects of coal-measure gas
1
2019
... With dramatically increasing global energy demands, the unconventional hydrocarbon resources have been regarded as a necessary alternative for the oil and gas resources exploration and development [1⇓-3]. The natural gas stored in low-permeability (tight) sandstone reservoirs is an important target for exploration and development of unconventional petroleum resources [4-5] and also serves as the national stratagic energy resource in China for reserve and production increase[6-7]. Evident differences have been reported in the accumulation characteristics and mechanisms of low-permeability (tight) sandstone gas reservoirs in comparison with conventional reservoirs [8⇓-10], of which primary gas migration from source rock to reservoir, namely, the charging process, is key for the accumultion of low-permeability (tight) sandstone gas reservoirs. The reasons for the differences lay in the space configuration of the interbedded source and reservoir rocks and the nano- to micro-meter pore system in these reserovirs [11⇓⇓-14]. The fluid flow mechanism in the charging process determines the charging behaviors, fluid occurrence states, and accumulation degree in low-permeability (tight) sandstone reservoir, which is critial for understanding the natural gas charging mechanism [11,15⇓ -17]. ...
Charging mechanism of tight sandstone gas reservoir and its pattern of accumulation and enrichment
2
2014
... With dramatically increasing global energy demands, the unconventional hydrocarbon resources have been regarded as a necessary alternative for the oil and gas resources exploration and development [1⇓-3]. The natural gas stored in low-permeability (tight) sandstone reservoirs is an important target for exploration and development of unconventional petroleum resources [4-5] and also serves as the national stratagic energy resource in China for reserve and production increase[6-7]. Evident differences have been reported in the accumulation characteristics and mechanisms of low-permeability (tight) sandstone gas reservoirs in comparison with conventional reservoirs [8⇓-10], of which primary gas migration from source rock to reservoir, namely, the charging process, is key for the accumultion of low-permeability (tight) sandstone gas reservoirs. The reasons for the differences lay in the space configuration of the interbedded source and reservoir rocks and the nano- to micro-meter pore system in these reserovirs [11⇓⇓-14]. The fluid flow mechanism in the charging process determines the charging behaviors, fluid occurrence states, and accumulation degree in low-permeability (tight) sandstone reservoir, which is critial for understanding the natural gas charging mechanism [11,15⇓ -17]. ...
... [11,15⇓ -17]. ...
Migration and accumulation impetus and two-dimension visual physical simulation research of coal-measure tight sandstone gas: A case study from tight sandstone gas in the Upper Triassic Xujiahe Formation, central Sichuan Basin, China
1
2016
... With dramatically increasing global energy demands, the unconventional hydrocarbon resources have been regarded as a necessary alternative for the oil and gas resources exploration and development [1⇓-3]. The natural gas stored in low-permeability (tight) sandstone reservoirs is an important target for exploration and development of unconventional petroleum resources [4-5] and also serves as the national stratagic energy resource in China for reserve and production increase[6-7]. Evident differences have been reported in the accumulation characteristics and mechanisms of low-permeability (tight) sandstone gas reservoirs in comparison with conventional reservoirs [8⇓-10], of which primary gas migration from source rock to reservoir, namely, the charging process, is key for the accumultion of low-permeability (tight) sandstone gas reservoirs. The reasons for the differences lay in the space configuration of the interbedded source and reservoir rocks and the nano- to micro-meter pore system in these reserovirs [11⇓⇓-14]. The fluid flow mechanism in the charging process determines the charging behaviors, fluid occurrence states, and accumulation degree in low-permeability (tight) sandstone reservoir, which is critial for understanding the natural gas charging mechanism [11,15⇓ -17]. ...
Pore-throat sizes in sandstones, tight sandstones, and shales
1
2009
... With dramatically increasing global energy demands, the unconventional hydrocarbon resources have been regarded as a necessary alternative for the oil and gas resources exploration and development [1⇓-3]. The natural gas stored in low-permeability (tight) sandstone reservoirs is an important target for exploration and development of unconventional petroleum resources [4-5] and also serves as the national stratagic energy resource in China for reserve and production increase[6-7]. Evident differences have been reported in the accumulation characteristics and mechanisms of low-permeability (tight) sandstone gas reservoirs in comparison with conventional reservoirs [8⇓-10], of which primary gas migration from source rock to reservoir, namely, the charging process, is key for the accumultion of low-permeability (tight) sandstone gas reservoirs. The reasons for the differences lay in the space configuration of the interbedded source and reservoir rocks and the nano- to micro-meter pore system in these reserovirs [11⇓⇓-14]. The fluid flow mechanism in the charging process determines the charging behaviors, fluid occurrence states, and accumulation degree in low-permeability (tight) sandstone reservoir, which is critial for understanding the natural gas charging mechanism [11,15⇓ -17]. ...
Heterogeneity of reservoir quality and gas accumulation in tight sandstone reservoirs revealed by pore structure characterization and physical simulation
4
2019
... With dramatically increasing global energy demands, the unconventional hydrocarbon resources have been regarded as a necessary alternative for the oil and gas resources exploration and development [1⇓-3]. The natural gas stored in low-permeability (tight) sandstone reservoirs is an important target for exploration and development of unconventional petroleum resources [4-5] and also serves as the national stratagic energy resource in China for reserve and production increase[6-7]. Evident differences have been reported in the accumulation characteristics and mechanisms of low-permeability (tight) sandstone gas reservoirs in comparison with conventional reservoirs [8⇓-10], of which primary gas migration from source rock to reservoir, namely, the charging process, is key for the accumultion of low-permeability (tight) sandstone gas reservoirs. The reasons for the differences lay in the space configuration of the interbedded source and reservoir rocks and the nano- to micro-meter pore system in these reserovirs [11⇓⇓-14]. The fluid flow mechanism in the charging process determines the charging behaviors, fluid occurrence states, and accumulation degree in low-permeability (tight) sandstone reservoir, which is critial for understanding the natural gas charging mechanism [11,15⇓ -17]. ...
... Numerous investigations, involving physical simulation, numerical simulation, and theoretical derivation, have been conducted to probe the fluid flow mechanisms in low-permeability (tight) sandstone reservoirs [15,18⇓⇓⇓ -22]. Sand box model, core flooding experiment, and pore-scale fluid flow physcial simulation are three major techniques employed in physical simulaiton [23⇓⇓⇓⇓⇓-29]. The fluid flow in hydrocarbon charging process has been investigated through the sand box model macroscopically in lab, but the results can hardly be used to describe the actual multiphase flow in the charging process in low-permeability (tight) reservoirs. Therefore, the core flooding experiments were introduced and performed on the actual low-permeability (tight) sandstone samples in China and abroad [16-17,29 -30], in which the non-Darcy flow behaviors with an evident threshold pressure gradient (TPG) were identified in hydrocarbon flow [15,26 -27]. Qiao et al. and Zeng et al. have reported a low-velocity non-linear flow in the charging and migration process during the hydrocarbon accumulation in low-permeability (tight) sandstone reservoirs [14,27,31]. The governing equations describing the low-velocity non-Darcy flow have been obtained by theoretical derivation. However, differences presented in these equations due to different influencing factors taken into account in the fluid flow [32⇓-34]. Recently, pore-scale visualized microscopic physical simulation for the multiphase flow in reservoirs has been widely performed by combining the fluid flow flux apparatus and micrometer X-ray computed tomography (X-μCT). The popular investigations tend to focus on the water flooding or imbibition process in the hydrocarbon development of conventional sandstone or carbonate rocks [35⇓⇓⇓⇓-40]. The multiphase flow for oil/gas displacing water in charging process of the hydrocarbon accumulation remains poorly investigated although Lin et al. have noticed the multiphase flow behaviors during the capillary drainage procedure of gas displacement in heterogeneous sandstones [38]. Based on the pore-scale research, other scholars have observed and studied the dynamic multiphase fluid flow in low-permeability (tight) reservoirs by Lattice Boltzmann, Monte Carlo, and other multi-field fluid flow numerical simulation methods [41]. ...
... As channels, the geometrical and topological features of pores in porous media govern the fluid flow and distribution characteristics [23-24,42⇓ -44]. The micro- to nano-meter pore system in low-permeability (tight) sandstone is responsible for the complex fluid flow and distribution law[22]. With progresses in pore-throat analysis techniques, especially the applications of scanning electron microscope (SEM), nuclear magnetic resonance (NMR), and X-μCT, explorations on the controlling factors for the fluid flow and distribution in the hydrocarbon reservoirs have emerged [14,29,45 -46]. Qiao et al. have discovered that the pore-throat configuration controls the fluid flow behaviors in tight gas charging process through X-μCT and core flooding experiments. Gong et al. have reported that the non-Darcy gas flow in low-permeability (tight) sandstone falls into four models, including composite, concave-up, concave-down, and linear models, under the control of the microscopic pore structures [29]. However, these results cannot directly reflect the fluid flow and distribution in the micro-nanometer pore system since they were based on the simple coupling of core flooding experiment and pore structure characterization. The statistically averaging of fluid flow and pore structure, and cross-scale coupling would result in more systematic errors [31], resulting in uncertainties in the fluid flow, distribution, and their controlling factors. As indicated, the key to uncovering the hydrocarbon charging mechanism in low-permeability (tight) sandstone lies in revealing the characteristics, law, and controlling factors of the fluid flow and distribution in the micro-nanometer pore system, which must rely on high-resolution pore-scale flow simulation [23⇓-25]. ...
... Gas phase apparent permeability, widely employed to describe the flow regime variation of the gas phase in two-phase fluid flow [14,27], can be calculated using Eq. (2). The gas apparent permeability variation in the charging process agrees with the changing patterns of gas flow and gas saturation, firstly increasing and then becoming stable ...
The experiment simulation study on gas percolation mechanisms of tight sandstone core in coal measure strata: A case study on coal-measure tight sandstone gas in the Upper Triassic Xujiahe Formation, Sichuan Basin, China
3
2016
... With dramatically increasing global energy demands, the unconventional hydrocarbon resources have been regarded as a necessary alternative for the oil and gas resources exploration and development [1⇓-3]. The natural gas stored in low-permeability (tight) sandstone reservoirs is an important target for exploration and development of unconventional petroleum resources [4-5] and also serves as the national stratagic energy resource in China for reserve and production increase[6-7]. Evident differences have been reported in the accumulation characteristics and mechanisms of low-permeability (tight) sandstone gas reservoirs in comparison with conventional reservoirs [8⇓-10], of which primary gas migration from source rock to reservoir, namely, the charging process, is key for the accumultion of low-permeability (tight) sandstone gas reservoirs. The reasons for the differences lay in the space configuration of the interbedded source and reservoir rocks and the nano- to micro-meter pore system in these reserovirs [11⇓⇓-14]. The fluid flow mechanism in the charging process determines the charging behaviors, fluid occurrence states, and accumulation degree in low-permeability (tight) sandstone reservoir, which is critial for understanding the natural gas charging mechanism [11,15⇓ -17]. ...
... Numerous investigations, involving physical simulation, numerical simulation, and theoretical derivation, have been conducted to probe the fluid flow mechanisms in low-permeability (tight) sandstone reservoirs [15,18⇓⇓⇓ -22]. Sand box model, core flooding experiment, and pore-scale fluid flow physcial simulation are three major techniques employed in physical simulaiton [23⇓⇓⇓⇓⇓-29]. The fluid flow in hydrocarbon charging process has been investigated through the sand box model macroscopically in lab, but the results can hardly be used to describe the actual multiphase flow in the charging process in low-permeability (tight) reservoirs. Therefore, the core flooding experiments were introduced and performed on the actual low-permeability (tight) sandstone samples in China and abroad [16-17,29 -30], in which the non-Darcy flow behaviors with an evident threshold pressure gradient (TPG) were identified in hydrocarbon flow [15,26 -27]. Qiao et al. and Zeng et al. have reported a low-velocity non-linear flow in the charging and migration process during the hydrocarbon accumulation in low-permeability (tight) sandstone reservoirs [14,27,31]. The governing equations describing the low-velocity non-Darcy flow have been obtained by theoretical derivation. However, differences presented in these equations due to different influencing factors taken into account in the fluid flow [32⇓-34]. Recently, pore-scale visualized microscopic physical simulation for the multiphase flow in reservoirs has been widely performed by combining the fluid flow flux apparatus and micrometer X-ray computed tomography (X-μCT). The popular investigations tend to focus on the water flooding or imbibition process in the hydrocarbon development of conventional sandstone or carbonate rocks [35⇓⇓⇓⇓-40]. The multiphase flow for oil/gas displacing water in charging process of the hydrocarbon accumulation remains poorly investigated although Lin et al. have noticed the multiphase flow behaviors during the capillary drainage procedure of gas displacement in heterogeneous sandstones [38]. Based on the pore-scale research, other scholars have observed and studied the dynamic multiphase fluid flow in low-permeability (tight) reservoirs by Lattice Boltzmann, Monte Carlo, and other multi-field fluid flow numerical simulation methods [41]. ...
... [15,26 -27]. Qiao et al. and Zeng et al. have reported a low-velocity non-linear flow in the charging and migration process during the hydrocarbon accumulation in low-permeability (tight) sandstone reservoirs [14,27,31]. The governing equations describing the low-velocity non-Darcy flow have been obtained by theoretical derivation. However, differences presented in these equations due to different influencing factors taken into account in the fluid flow [32⇓-34]. Recently, pore-scale visualized microscopic physical simulation for the multiphase flow in reservoirs has been widely performed by combining the fluid flow flux apparatus and micrometer X-ray computed tomography (X-μCT). The popular investigations tend to focus on the water flooding or imbibition process in the hydrocarbon development of conventional sandstone or carbonate rocks [35⇓⇓⇓⇓-40]. The multiphase flow for oil/gas displacing water in charging process of the hydrocarbon accumulation remains poorly investigated although Lin et al. have noticed the multiphase flow behaviors during the capillary drainage procedure of gas displacement in heterogeneous sandstones [38]. Based on the pore-scale research, other scholars have observed and studied the dynamic multiphase fluid flow in low-permeability (tight) reservoirs by Lattice Boltzmann, Monte Carlo, and other multi-field fluid flow numerical simulation methods [41]. ...
Experimental simulation of gas accumulation mechanism in sandstone reservoir: A case study of Sulige Gas Field, Ordos Basin
2
2017
... With dramatically increasing global energy demands, the unconventional hydrocarbon resources have been regarded as a necessary alternative for the oil and gas resources exploration and development [1⇓-3]. The natural gas stored in low-permeability (tight) sandstone reservoirs is an important target for exploration and development of unconventional petroleum resources [4-5] and also serves as the national stratagic energy resource in China for reserve and production increase[6-7]. Evident differences have been reported in the accumulation characteristics and mechanisms of low-permeability (tight) sandstone gas reservoirs in comparison with conventional reservoirs [8⇓-10], of which primary gas migration from source rock to reservoir, namely, the charging process, is key for the accumultion of low-permeability (tight) sandstone gas reservoirs. The reasons for the differences lay in the space configuration of the interbedded source and reservoir rocks and the nano- to micro-meter pore system in these reserovirs [11⇓⇓-14]. The fluid flow mechanism in the charging process determines the charging behaviors, fluid occurrence states, and accumulation degree in low-permeability (tight) sandstone reservoir, which is critial for understanding the natural gas charging mechanism [11,15⇓ -17]. ...
... Numerous investigations, involving physical simulation, numerical simulation, and theoretical derivation, have been conducted to probe the fluid flow mechanisms in low-permeability (tight) sandstone reservoirs [15,18⇓⇓⇓ -22]. Sand box model, core flooding experiment, and pore-scale fluid flow physcial simulation are three major techniques employed in physical simulaiton [23⇓⇓⇓⇓⇓-29]. The fluid flow in hydrocarbon charging process has been investigated through the sand box model macroscopically in lab, but the results can hardly be used to describe the actual multiphase flow in the charging process in low-permeability (tight) reservoirs. Therefore, the core flooding experiments were introduced and performed on the actual low-permeability (tight) sandstone samples in China and abroad [16-17,29 -30], in which the non-Darcy flow behaviors with an evident threshold pressure gradient (TPG) were identified in hydrocarbon flow [15,26 -27]. Qiao et al. and Zeng et al. have reported a low-velocity non-linear flow in the charging and migration process during the hydrocarbon accumulation in low-permeability (tight) sandstone reservoirs [14,27,31]. The governing equations describing the low-velocity non-Darcy flow have been obtained by theoretical derivation. However, differences presented in these equations due to different influencing factors taken into account in the fluid flow [32⇓-34]. Recently, pore-scale visualized microscopic physical simulation for the multiphase flow in reservoirs has been widely performed by combining the fluid flow flux apparatus and micrometer X-ray computed tomography (X-μCT). The popular investigations tend to focus on the water flooding or imbibition process in the hydrocarbon development of conventional sandstone or carbonate rocks [35⇓⇓⇓⇓-40]. The multiphase flow for oil/gas displacing water in charging process of the hydrocarbon accumulation remains poorly investigated although Lin et al. have noticed the multiphase flow behaviors during the capillary drainage procedure of gas displacement in heterogeneous sandstones [38]. Based on the pore-scale research, other scholars have observed and studied the dynamic multiphase fluid flow in low-permeability (tight) reservoirs by Lattice Boltzmann, Monte Carlo, and other multi-field fluid flow numerical simulation methods [41]. ...
Accumulation process analysis on tight sandstone gas based on charging simulation experiment: An example of Ordos Basin
2
2015
... With dramatically increasing global energy demands, the unconventional hydrocarbon resources have been regarded as a necessary alternative for the oil and gas resources exploration and development [1⇓-3]. The natural gas stored in low-permeability (tight) sandstone reservoirs is an important target for exploration and development of unconventional petroleum resources [4-5] and also serves as the national stratagic energy resource in China for reserve and production increase[6-7]. Evident differences have been reported in the accumulation characteristics and mechanisms of low-permeability (tight) sandstone gas reservoirs in comparison with conventional reservoirs [8⇓-10], of which primary gas migration from source rock to reservoir, namely, the charging process, is key for the accumultion of low-permeability (tight) sandstone gas reservoirs. The reasons for the differences lay in the space configuration of the interbedded source and reservoir rocks and the nano- to micro-meter pore system in these reserovirs [11⇓⇓-14]. The fluid flow mechanism in the charging process determines the charging behaviors, fluid occurrence states, and accumulation degree in low-permeability (tight) sandstone reservoir, which is critial for understanding the natural gas charging mechanism [11,15⇓ -17]. ...
... Numerous investigations, involving physical simulation, numerical simulation, and theoretical derivation, have been conducted to probe the fluid flow mechanisms in low-permeability (tight) sandstone reservoirs [15,18⇓⇓⇓ -22]. Sand box model, core flooding experiment, and pore-scale fluid flow physcial simulation are three major techniques employed in physical simulaiton [23⇓⇓⇓⇓⇓-29]. The fluid flow in hydrocarbon charging process has been investigated through the sand box model macroscopically in lab, but the results can hardly be used to describe the actual multiphase flow in the charging process in low-permeability (tight) reservoirs. Therefore, the core flooding experiments were introduced and performed on the actual low-permeability (tight) sandstone samples in China and abroad [16-17,29 -30], in which the non-Darcy flow behaviors with an evident threshold pressure gradient (TPG) were identified in hydrocarbon flow [15,26 -27]. Qiao et al. and Zeng et al. have reported a low-velocity non-linear flow in the charging and migration process during the hydrocarbon accumulation in low-permeability (tight) sandstone reservoirs [14,27,31]. The governing equations describing the low-velocity non-Darcy flow have been obtained by theoretical derivation. However, differences presented in these equations due to different influencing factors taken into account in the fluid flow [32⇓-34]. Recently, pore-scale visualized microscopic physical simulation for the multiphase flow in reservoirs has been widely performed by combining the fluid flow flux apparatus and micrometer X-ray computed tomography (X-μCT). The popular investigations tend to focus on the water flooding or imbibition process in the hydrocarbon development of conventional sandstone or carbonate rocks [35⇓⇓⇓⇓-40]. The multiphase flow for oil/gas displacing water in charging process of the hydrocarbon accumulation remains poorly investigated although Lin et al. have noticed the multiphase flow behaviors during the capillary drainage procedure of gas displacement in heterogeneous sandstones [38]. Based on the pore-scale research, other scholars have observed and studied the dynamic multiphase fluid flow in low-permeability (tight) reservoirs by Lattice Boltzmann, Monte Carlo, and other multi-field fluid flow numerical simulation methods [41]. ...
Numerical visualization of supercritical CO2 displacement in pore-scale porous and fractured media saturated with water
1
2020
... Numerous investigations, involving physical simulation, numerical simulation, and theoretical derivation, have been conducted to probe the fluid flow mechanisms in low-permeability (tight) sandstone reservoirs [15,18⇓⇓⇓ -22]. Sand box model, core flooding experiment, and pore-scale fluid flow physcial simulation are three major techniques employed in physical simulaiton [23⇓⇓⇓⇓⇓-29]. The fluid flow in hydrocarbon charging process has been investigated through the sand box model macroscopically in lab, but the results can hardly be used to describe the actual multiphase flow in the charging process in low-permeability (tight) reservoirs. Therefore, the core flooding experiments were introduced and performed on the actual low-permeability (tight) sandstone samples in China and abroad [16-17,29 -30], in which the non-Darcy flow behaviors with an evident threshold pressure gradient (TPG) were identified in hydrocarbon flow [15,26 -27]. Qiao et al. and Zeng et al. have reported a low-velocity non-linear flow in the charging and migration process during the hydrocarbon accumulation in low-permeability (tight) sandstone reservoirs [14,27,31]. The governing equations describing the low-velocity non-Darcy flow have been obtained by theoretical derivation. However, differences presented in these equations due to different influencing factors taken into account in the fluid flow [32⇓-34]. Recently, pore-scale visualized microscopic physical simulation for the multiphase flow in reservoirs has been widely performed by combining the fluid flow flux apparatus and micrometer X-ray computed tomography (X-μCT). The popular investigations tend to focus on the water flooding or imbibition process in the hydrocarbon development of conventional sandstone or carbonate rocks [35⇓⇓⇓⇓-40]. The multiphase flow for oil/gas displacing water in charging process of the hydrocarbon accumulation remains poorly investigated although Lin et al. have noticed the multiphase flow behaviors during the capillary drainage procedure of gas displacement in heterogeneous sandstones [38]. Based on the pore-scale research, other scholars have observed and studied the dynamic multiphase fluid flow in low-permeability (tight) reservoirs by Lattice Boltzmann, Monte Carlo, and other multi-field fluid flow numerical simulation methods [41]. ...
JIANG Yuxiang. Flow through porous media of packed spheres saturated with water
1
1994
... Numerous investigations, involving physical simulation, numerical simulation, and theoretical derivation, have been conducted to probe the fluid flow mechanisms in low-permeability (tight) sandstone reservoirs [15,18⇓⇓⇓ -22]. Sand box model, core flooding experiment, and pore-scale fluid flow physcial simulation are three major techniques employed in physical simulaiton [23⇓⇓⇓⇓⇓-29]. The fluid flow in hydrocarbon charging process has been investigated through the sand box model macroscopically in lab, but the results can hardly be used to describe the actual multiphase flow in the charging process in low-permeability (tight) reservoirs. Therefore, the core flooding experiments were introduced and performed on the actual low-permeability (tight) sandstone samples in China and abroad [16-17,29 -30], in which the non-Darcy flow behaviors with an evident threshold pressure gradient (TPG) were identified in hydrocarbon flow [15,26 -27]. Qiao et al. and Zeng et al. have reported a low-velocity non-linear flow in the charging and migration process during the hydrocarbon accumulation in low-permeability (tight) sandstone reservoirs [14,27,31]. The governing equations describing the low-velocity non-Darcy flow have been obtained by theoretical derivation. However, differences presented in these equations due to different influencing factors taken into account in the fluid flow [32⇓-34]. Recently, pore-scale visualized microscopic physical simulation for the multiphase flow in reservoirs has been widely performed by combining the fluid flow flux apparatus and micrometer X-ray computed tomography (X-μCT). The popular investigations tend to focus on the water flooding or imbibition process in the hydrocarbon development of conventional sandstone or carbonate rocks [35⇓⇓⇓⇓-40]. The multiphase flow for oil/gas displacing water in charging process of the hydrocarbon accumulation remains poorly investigated although Lin et al. have noticed the multiphase flow behaviors during the capillary drainage procedure of gas displacement in heterogeneous sandstones [38]. Based on the pore-scale research, other scholars have observed and studied the dynamic multiphase fluid flow in low-permeability (tight) reservoirs by Lattice Boltzmann, Monte Carlo, and other multi-field fluid flow numerical simulation methods [41]. ...
Pre-Darcy flow revisited under experimental investigation
1
2016
... Numerous investigations, involving physical simulation, numerical simulation, and theoretical derivation, have been conducted to probe the fluid flow mechanisms in low-permeability (tight) sandstone reservoirs [15,18⇓⇓⇓ -22]. Sand box model, core flooding experiment, and pore-scale fluid flow physcial simulation are three major techniques employed in physical simulaiton [23⇓⇓⇓⇓⇓-29]. The fluid flow in hydrocarbon charging process has been investigated through the sand box model macroscopically in lab, but the results can hardly be used to describe the actual multiphase flow in the charging process in low-permeability (tight) reservoirs. Therefore, the core flooding experiments were introduced and performed on the actual low-permeability (tight) sandstone samples in China and abroad [16-17,29 -30], in which the non-Darcy flow behaviors with an evident threshold pressure gradient (TPG) were identified in hydrocarbon flow [15,26 -27]. Qiao et al. and Zeng et al. have reported a low-velocity non-linear flow in the charging and migration process during the hydrocarbon accumulation in low-permeability (tight) sandstone reservoirs [14,27,31]. The governing equations describing the low-velocity non-Darcy flow have been obtained by theoretical derivation. However, differences presented in these equations due to different influencing factors taken into account in the fluid flow [32⇓-34]. Recently, pore-scale visualized microscopic physical simulation for the multiphase flow in reservoirs has been widely performed by combining the fluid flow flux apparatus and micrometer X-ray computed tomography (X-μCT). The popular investigations tend to focus on the water flooding or imbibition process in the hydrocarbon development of conventional sandstone or carbonate rocks [35⇓⇓⇓⇓-40]. The multiphase flow for oil/gas displacing water in charging process of the hydrocarbon accumulation remains poorly investigated although Lin et al. have noticed the multiphase flow behaviors during the capillary drainage procedure of gas displacement in heterogeneous sandstones [38]. Based on the pore-scale research, other scholars have observed and studied the dynamic multiphase fluid flow in low-permeability (tight) reservoirs by Lattice Boltzmann, Monte Carlo, and other multi-field fluid flow numerical simulation methods [41]. ...
Experimental study of nonlinear flow in micropores under low pressure gradient
1
2017
... Numerous investigations, involving physical simulation, numerical simulation, and theoretical derivation, have been conducted to probe the fluid flow mechanisms in low-permeability (tight) sandstone reservoirs [15,18⇓⇓⇓ -22]. Sand box model, core flooding experiment, and pore-scale fluid flow physcial simulation are three major techniques employed in physical simulaiton [23⇓⇓⇓⇓⇓-29]. The fluid flow in hydrocarbon charging process has been investigated through the sand box model macroscopically in lab, but the results can hardly be used to describe the actual multiphase flow in the charging process in low-permeability (tight) reservoirs. Therefore, the core flooding experiments were introduced and performed on the actual low-permeability (tight) sandstone samples in China and abroad [16-17,29 -30], in which the non-Darcy flow behaviors with an evident threshold pressure gradient (TPG) were identified in hydrocarbon flow [15,26 -27]. Qiao et al. and Zeng et al. have reported a low-velocity non-linear flow in the charging and migration process during the hydrocarbon accumulation in low-permeability (tight) sandstone reservoirs [14,27,31]. The governing equations describing the low-velocity non-Darcy flow have been obtained by theoretical derivation. However, differences presented in these equations due to different influencing factors taken into account in the fluid flow [32⇓-34]. Recently, pore-scale visualized microscopic physical simulation for the multiphase flow in reservoirs has been widely performed by combining the fluid flow flux apparatus and micrometer X-ray computed tomography (X-μCT). The popular investigations tend to focus on the water flooding or imbibition process in the hydrocarbon development of conventional sandstone or carbonate rocks [35⇓⇓⇓⇓-40]. The multiphase flow for oil/gas displacing water in charging process of the hydrocarbon accumulation remains poorly investigated although Lin et al. have noticed the multiphase flow behaviors during the capillary drainage procedure of gas displacement in heterogeneous sandstones [38]. Based on the pore-scale research, other scholars have observed and studied the dynamic multiphase fluid flow in low-permeability (tight) reservoirs by Lattice Boltzmann, Monte Carlo, and other multi-field fluid flow numerical simulation methods [41]. ...
Experimental study on natural gas migration and accumulation mechanism in sweet spots of tight sandstones
2
2016
... Numerous investigations, involving physical simulation, numerical simulation, and theoretical derivation, have been conducted to probe the fluid flow mechanisms in low-permeability (tight) sandstone reservoirs [15,18⇓⇓⇓ -22]. Sand box model, core flooding experiment, and pore-scale fluid flow physcial simulation are three major techniques employed in physical simulaiton [23⇓⇓⇓⇓⇓-29]. The fluid flow in hydrocarbon charging process has been investigated through the sand box model macroscopically in lab, but the results can hardly be used to describe the actual multiphase flow in the charging process in low-permeability (tight) reservoirs. Therefore, the core flooding experiments were introduced and performed on the actual low-permeability (tight) sandstone samples in China and abroad [16-17,29 -30], in which the non-Darcy flow behaviors with an evident threshold pressure gradient (TPG) were identified in hydrocarbon flow [15,26 -27]. Qiao et al. and Zeng et al. have reported a low-velocity non-linear flow in the charging and migration process during the hydrocarbon accumulation in low-permeability (tight) sandstone reservoirs [14,27,31]. The governing equations describing the low-velocity non-Darcy flow have been obtained by theoretical derivation. However, differences presented in these equations due to different influencing factors taken into account in the fluid flow [32⇓-34]. Recently, pore-scale visualized microscopic physical simulation for the multiphase flow in reservoirs has been widely performed by combining the fluid flow flux apparatus and micrometer X-ray computed tomography (X-μCT). The popular investigations tend to focus on the water flooding or imbibition process in the hydrocarbon development of conventional sandstone or carbonate rocks [35⇓⇓⇓⇓-40]. The multiphase flow for oil/gas displacing water in charging process of the hydrocarbon accumulation remains poorly investigated although Lin et al. have noticed the multiphase flow behaviors during the capillary drainage procedure of gas displacement in heterogeneous sandstones [38]. Based on the pore-scale research, other scholars have observed and studied the dynamic multiphase fluid flow in low-permeability (tight) reservoirs by Lattice Boltzmann, Monte Carlo, and other multi-field fluid flow numerical simulation methods [41]. ...
... As channels, the geometrical and topological features of pores in porous media govern the fluid flow and distribution characteristics [23-24,42⇓ -44]. The micro- to nano-meter pore system in low-permeability (tight) sandstone is responsible for the complex fluid flow and distribution law[22]. With progresses in pore-throat analysis techniques, especially the applications of scanning electron microscope (SEM), nuclear magnetic resonance (NMR), and X-μCT, explorations on the controlling factors for the fluid flow and distribution in the hydrocarbon reservoirs have emerged [14,29,45 -46]. Qiao et al. have discovered that the pore-throat configuration controls the fluid flow behaviors in tight gas charging process through X-μCT and core flooding experiments. Gong et al. have reported that the non-Darcy gas flow in low-permeability (tight) sandstone falls into four models, including composite, concave-up, concave-down, and linear models, under the control of the microscopic pore structures [29]. However, these results cannot directly reflect the fluid flow and distribution in the micro-nanometer pore system since they were based on the simple coupling of core flooding experiment and pore structure characterization. The statistically averaging of fluid flow and pore structure, and cross-scale coupling would result in more systematic errors [31], resulting in uncertainties in the fluid flow, distribution, and their controlling factors. As indicated, the key to uncovering the hydrocarbon charging mechanism in low-permeability (tight) sandstone lies in revealing the characteristics, law, and controlling factors of the fluid flow and distribution in the micro-nanometer pore system, which must rely on high-resolution pore-scale flow simulation [23⇓-25]. ...
Subsecond pore- scale displacement processes and relaxation dynamics in multiphase flow
4
2014
... Numerous investigations, involving physical simulation, numerical simulation, and theoretical derivation, have been conducted to probe the fluid flow mechanisms in low-permeability (tight) sandstone reservoirs [15,18⇓⇓⇓ -22]. Sand box model, core flooding experiment, and pore-scale fluid flow physcial simulation are three major techniques employed in physical simulaiton [23⇓⇓⇓⇓⇓-29]. The fluid flow in hydrocarbon charging process has been investigated through the sand box model macroscopically in lab, but the results can hardly be used to describe the actual multiphase flow in the charging process in low-permeability (tight) reservoirs. Therefore, the core flooding experiments were introduced and performed on the actual low-permeability (tight) sandstone samples in China and abroad [16-17,29 -30], in which the non-Darcy flow behaviors with an evident threshold pressure gradient (TPG) were identified in hydrocarbon flow [15,26 -27]. Qiao et al. and Zeng et al. have reported a low-velocity non-linear flow in the charging and migration process during the hydrocarbon accumulation in low-permeability (tight) sandstone reservoirs [14,27,31]. The governing equations describing the low-velocity non-Darcy flow have been obtained by theoretical derivation. However, differences presented in these equations due to different influencing factors taken into account in the fluid flow [32⇓-34]. Recently, pore-scale visualized microscopic physical simulation for the multiphase flow in reservoirs has been widely performed by combining the fluid flow flux apparatus and micrometer X-ray computed tomography (X-μCT). The popular investigations tend to focus on the water flooding or imbibition process in the hydrocarbon development of conventional sandstone or carbonate rocks [35⇓⇓⇓⇓-40]. The multiphase flow for oil/gas displacing water in charging process of the hydrocarbon accumulation remains poorly investigated although Lin et al. have noticed the multiphase flow behaviors during the capillary drainage procedure of gas displacement in heterogeneous sandstones [38]. Based on the pore-scale research, other scholars have observed and studied the dynamic multiphase fluid flow in low-permeability (tight) reservoirs by Lattice Boltzmann, Monte Carlo, and other multi-field fluid flow numerical simulation methods [41]. ...
... As channels, the geometrical and topological features of pores in porous media govern the fluid flow and distribution characteristics [23-24,42⇓ -44]. The micro- to nano-meter pore system in low-permeability (tight) sandstone is responsible for the complex fluid flow and distribution law[22]. With progresses in pore-throat analysis techniques, especially the applications of scanning electron microscope (SEM), nuclear magnetic resonance (NMR), and X-μCT, explorations on the controlling factors for the fluid flow and distribution in the hydrocarbon reservoirs have emerged [14,29,45 -46]. Qiao et al. have discovered that the pore-throat configuration controls the fluid flow behaviors in tight gas charging process through X-μCT and core flooding experiments. Gong et al. have reported that the non-Darcy gas flow in low-permeability (tight) sandstone falls into four models, including composite, concave-up, concave-down, and linear models, under the control of the microscopic pore structures [29]. However, these results cannot directly reflect the fluid flow and distribution in the micro-nanometer pore system since they were based on the simple coupling of core flooding experiment and pore structure characterization. The statistically averaging of fluid flow and pore structure, and cross-scale coupling would result in more systematic errors [31], resulting in uncertainties in the fluid flow, distribution, and their controlling factors. As indicated, the key to uncovering the hydrocarbon charging mechanism in low-permeability (tight) sandstone lies in revealing the characteristics, law, and controlling factors of the fluid flow and distribution in the micro-nanometer pore system, which must rely on high-resolution pore-scale flow simulation [23⇓-25]. ...
... [23⇓-25]. ...
... The 2D and 3D X-CT gray scale images under different charging pressures were acquired by choosing six featured nodes at four different charging states in the pore-scale gas charging physical simulation, including the original dry state, KI solution-saturated state, and states at charging pressures of 0.10, 0.15, 0.20, and 0.50 MPa (Fig. 7). On the grayscale images, the KI solution-saturated pores are bright white, the rock matrix is generally gray, while the part of pores will be complete black after gas intrusion. These imaging features are consistent with those in the pore-scale multiphase flow physical simulation conducted by Armstrong et al. and Khishvand et al. [23,36]. According to the grayscale differences among the rock matrix, gas, and aqueous solution, and considering the grayscale differences on the images of different nodes resulted from the gas-water distribution, the pore-scale spatial gas-water distributions at different charging pressures can be constructed by pore-scale in-situ computation and interactive threshold segmentation (Fig. 7g-7i). The pore-throat zones occupied by gas phase were extracted (Fig. 8a-8d), and then the pore- throat skeleton networks at different charging pressures were built by conducting PNM (Fig. 8e-8h). The pore structure parameters for the channels at corresponding nodes were calculated. ...
Pore-scale experimental investigation of two-phase flow through fractured porous media
3
2018
... Numerous investigations, involving physical simulation, numerical simulation, and theoretical derivation, have been conducted to probe the fluid flow mechanisms in low-permeability (tight) sandstone reservoirs [15,18⇓⇓⇓ -22]. Sand box model, core flooding experiment, and pore-scale fluid flow physcial simulation are three major techniques employed in physical simulaiton [23⇓⇓⇓⇓⇓-29]. The fluid flow in hydrocarbon charging process has been investigated through the sand box model macroscopically in lab, but the results can hardly be used to describe the actual multiphase flow in the charging process in low-permeability (tight) reservoirs. Therefore, the core flooding experiments were introduced and performed on the actual low-permeability (tight) sandstone samples in China and abroad [16-17,29 -30], in which the non-Darcy flow behaviors with an evident threshold pressure gradient (TPG) were identified in hydrocarbon flow [15,26 -27]. Qiao et al. and Zeng et al. have reported a low-velocity non-linear flow in the charging and migration process during the hydrocarbon accumulation in low-permeability (tight) sandstone reservoirs [14,27,31]. The governing equations describing the low-velocity non-Darcy flow have been obtained by theoretical derivation. However, differences presented in these equations due to different influencing factors taken into account in the fluid flow [32⇓-34]. Recently, pore-scale visualized microscopic physical simulation for the multiphase flow in reservoirs has been widely performed by combining the fluid flow flux apparatus and micrometer X-ray computed tomography (X-μCT). The popular investigations tend to focus on the water flooding or imbibition process in the hydrocarbon development of conventional sandstone or carbonate rocks [35⇓⇓⇓⇓-40]. The multiphase flow for oil/gas displacing water in charging process of the hydrocarbon accumulation remains poorly investigated although Lin et al. have noticed the multiphase flow behaviors during the capillary drainage procedure of gas displacement in heterogeneous sandstones [38]. Based on the pore-scale research, other scholars have observed and studied the dynamic multiphase fluid flow in low-permeability (tight) reservoirs by Lattice Boltzmann, Monte Carlo, and other multi-field fluid flow numerical simulation methods [41]. ...
... As channels, the geometrical and topological features of pores in porous media govern the fluid flow and distribution characteristics [23-24,42⇓ -44]. The micro- to nano-meter pore system in low-permeability (tight) sandstone is responsible for the complex fluid flow and distribution law[22]. With progresses in pore-throat analysis techniques, especially the applications of scanning electron microscope (SEM), nuclear magnetic resonance (NMR), and X-μCT, explorations on the controlling factors for the fluid flow and distribution in the hydrocarbon reservoirs have emerged [14,29,45 -46]. Qiao et al. have discovered that the pore-throat configuration controls the fluid flow behaviors in tight gas charging process through X-μCT and core flooding experiments. Gong et al. have reported that the non-Darcy gas flow in low-permeability (tight) sandstone falls into four models, including composite, concave-up, concave-down, and linear models, under the control of the microscopic pore structures [29]. However, these results cannot directly reflect the fluid flow and distribution in the micro-nanometer pore system since they were based on the simple coupling of core flooding experiment and pore structure characterization. The statistically averaging of fluid flow and pore structure, and cross-scale coupling would result in more systematic errors [31], resulting in uncertainties in the fluid flow, distribution, and their controlling factors. As indicated, the key to uncovering the hydrocarbon charging mechanism in low-permeability (tight) sandstone lies in revealing the characteristics, law, and controlling factors of the fluid flow and distribution in the micro-nanometer pore system, which must rely on high-resolution pore-scale flow simulation [23⇓-25]. ...
... ⇓-25]. ...
Imaging and image-based fluid transport modeling at the pore scale in geological materials: A practical introduction to the current state-of-the-art
2
2016
... Numerous investigations, involving physical simulation, numerical simulation, and theoretical derivation, have been conducted to probe the fluid flow mechanisms in low-permeability (tight) sandstone reservoirs [15,18⇓⇓⇓ -22]. Sand box model, core flooding experiment, and pore-scale fluid flow physcial simulation are three major techniques employed in physical simulaiton [23⇓⇓⇓⇓⇓-29]. The fluid flow in hydrocarbon charging process has been investigated through the sand box model macroscopically in lab, but the results can hardly be used to describe the actual multiphase flow in the charging process in low-permeability (tight) reservoirs. Therefore, the core flooding experiments were introduced and performed on the actual low-permeability (tight) sandstone samples in China and abroad [16-17,29 -30], in which the non-Darcy flow behaviors with an evident threshold pressure gradient (TPG) were identified in hydrocarbon flow [15,26 -27]. Qiao et al. and Zeng et al. have reported a low-velocity non-linear flow in the charging and migration process during the hydrocarbon accumulation in low-permeability (tight) sandstone reservoirs [14,27,31]. The governing equations describing the low-velocity non-Darcy flow have been obtained by theoretical derivation. However, differences presented in these equations due to different influencing factors taken into account in the fluid flow [32⇓-34]. Recently, pore-scale visualized microscopic physical simulation for the multiphase flow in reservoirs has been widely performed by combining the fluid flow flux apparatus and micrometer X-ray computed tomography (X-μCT). The popular investigations tend to focus on the water flooding or imbibition process in the hydrocarbon development of conventional sandstone or carbonate rocks [35⇓⇓⇓⇓-40]. The multiphase flow for oil/gas displacing water in charging process of the hydrocarbon accumulation remains poorly investigated although Lin et al. have noticed the multiphase flow behaviors during the capillary drainage procedure of gas displacement in heterogeneous sandstones [38]. Based on the pore-scale research, other scholars have observed and studied the dynamic multiphase fluid flow in low-permeability (tight) reservoirs by Lattice Boltzmann, Monte Carlo, and other multi-field fluid flow numerical simulation methods [41]. ...
... As channels, the geometrical and topological features of pores in porous media govern the fluid flow and distribution characteristics [23-24,42⇓ -44]. The micro- to nano-meter pore system in low-permeability (tight) sandstone is responsible for the complex fluid flow and distribution law[22]. With progresses in pore-throat analysis techniques, especially the applications of scanning electron microscope (SEM), nuclear magnetic resonance (NMR), and X-μCT, explorations on the controlling factors for the fluid flow and distribution in the hydrocarbon reservoirs have emerged [14,29,45 -46]. Qiao et al. have discovered that the pore-throat configuration controls the fluid flow behaviors in tight gas charging process through X-μCT and core flooding experiments. Gong et al. have reported that the non-Darcy gas flow in low-permeability (tight) sandstone falls into four models, including composite, concave-up, concave-down, and linear models, under the control of the microscopic pore structures [29]. However, these results cannot directly reflect the fluid flow and distribution in the micro-nanometer pore system since they were based on the simple coupling of core flooding experiment and pore structure characterization. The statistically averaging of fluid flow and pore structure, and cross-scale coupling would result in more systematic errors [31], resulting in uncertainties in the fluid flow, distribution, and their controlling factors. As indicated, the key to uncovering the hydrocarbon charging mechanism in low-permeability (tight) sandstone lies in revealing the characteristics, law, and controlling factors of the fluid flow and distribution in the micro-nanometer pore system, which must rely on high-resolution pore-scale flow simulation [23⇓-25]. ...
Non- Darcy flow in oil accumulation (oil displacing water) and relative permeability and oil saturation characteristics of low-permeability sandstones
2
2010
... Numerous investigations, involving physical simulation, numerical simulation, and theoretical derivation, have been conducted to probe the fluid flow mechanisms in low-permeability (tight) sandstone reservoirs [15,18⇓⇓⇓ -22]. Sand box model, core flooding experiment, and pore-scale fluid flow physcial simulation are three major techniques employed in physical simulaiton [23⇓⇓⇓⇓⇓-29]. The fluid flow in hydrocarbon charging process has been investigated through the sand box model macroscopically in lab, but the results can hardly be used to describe the actual multiphase flow in the charging process in low-permeability (tight) reservoirs. Therefore, the core flooding experiments were introduced and performed on the actual low-permeability (tight) sandstone samples in China and abroad [16-17,29 -30], in which the non-Darcy flow behaviors with an evident threshold pressure gradient (TPG) were identified in hydrocarbon flow [15,26 -27]. Qiao et al. and Zeng et al. have reported a low-velocity non-linear flow in the charging and migration process during the hydrocarbon accumulation in low-permeability (tight) sandstone reservoirs [14,27,31]. The governing equations describing the low-velocity non-Darcy flow have been obtained by theoretical derivation. However, differences presented in these equations due to different influencing factors taken into account in the fluid flow [32⇓-34]. Recently, pore-scale visualized microscopic physical simulation for the multiphase flow in reservoirs has been widely performed by combining the fluid flow flux apparatus and micrometer X-ray computed tomography (X-μCT). The popular investigations tend to focus on the water flooding or imbibition process in the hydrocarbon development of conventional sandstone or carbonate rocks [35⇓⇓⇓⇓-40]. The multiphase flow for oil/gas displacing water in charging process of the hydrocarbon accumulation remains poorly investigated although Lin et al. have noticed the multiphase flow behaviors during the capillary drainage procedure of gas displacement in heterogeneous sandstones [38]. Based on the pore-scale research, other scholars have observed and studied the dynamic multiphase fluid flow in low-permeability (tight) reservoirs by Lattice Boltzmann, Monte Carlo, and other multi-field fluid flow numerical simulation methods [41]. ...
... ,26 -27]. Qiao et al. and Zeng et al. have reported a low-velocity non-linear flow in the charging and migration process during the hydrocarbon accumulation in low-permeability (tight) sandstone reservoirs [14,27,31]. The governing equations describing the low-velocity non-Darcy flow have been obtained by theoretical derivation. However, differences presented in these equations due to different influencing factors taken into account in the fluid flow [32⇓-34]. Recently, pore-scale visualized microscopic physical simulation for the multiphase flow in reservoirs has been widely performed by combining the fluid flow flux apparatus and micrometer X-ray computed tomography (X-μCT). The popular investigations tend to focus on the water flooding or imbibition process in the hydrocarbon development of conventional sandstone or carbonate rocks [35⇓⇓⇓⇓-40]. The multiphase flow for oil/gas displacing water in charging process of the hydrocarbon accumulation remains poorly investigated although Lin et al. have noticed the multiphase flow behaviors during the capillary drainage procedure of gas displacement in heterogeneous sandstones [38]. Based on the pore-scale research, other scholars have observed and studied the dynamic multiphase fluid flow in low-permeability (tight) reservoirs by Lattice Boltzmann, Monte Carlo, and other multi-field fluid flow numerical simulation methods [41]. ...
Experimental and theoretical characterization of the natural gas migration and accumulation mechanism in low-permeability (tight) sandstone cores
4
2016
... Numerous investigations, involving physical simulation, numerical simulation, and theoretical derivation, have been conducted to probe the fluid flow mechanisms in low-permeability (tight) sandstone reservoirs [15,18⇓⇓⇓ -22]. Sand box model, core flooding experiment, and pore-scale fluid flow physcial simulation are three major techniques employed in physical simulaiton [23⇓⇓⇓⇓⇓-29]. The fluid flow in hydrocarbon charging process has been investigated through the sand box model macroscopically in lab, but the results can hardly be used to describe the actual multiphase flow in the charging process in low-permeability (tight) reservoirs. Therefore, the core flooding experiments were introduced and performed on the actual low-permeability (tight) sandstone samples in China and abroad [16-17,29 -30], in which the non-Darcy flow behaviors with an evident threshold pressure gradient (TPG) were identified in hydrocarbon flow [15,26 -27]. Qiao et al. and Zeng et al. have reported a low-velocity non-linear flow in the charging and migration process during the hydrocarbon accumulation in low-permeability (tight) sandstone reservoirs [14,27,31]. The governing equations describing the low-velocity non-Darcy flow have been obtained by theoretical derivation. However, differences presented in these equations due to different influencing factors taken into account in the fluid flow [32⇓-34]. Recently, pore-scale visualized microscopic physical simulation for the multiphase flow in reservoirs has been widely performed by combining the fluid flow flux apparatus and micrometer X-ray computed tomography (X-μCT). The popular investigations tend to focus on the water flooding or imbibition process in the hydrocarbon development of conventional sandstone or carbonate rocks [35⇓⇓⇓⇓-40]. The multiphase flow for oil/gas displacing water in charging process of the hydrocarbon accumulation remains poorly investigated although Lin et al. have noticed the multiphase flow behaviors during the capillary drainage procedure of gas displacement in heterogeneous sandstones [38]. Based on the pore-scale research, other scholars have observed and studied the dynamic multiphase fluid flow in low-permeability (tight) reservoirs by Lattice Boltzmann, Monte Carlo, and other multi-field fluid flow numerical simulation methods [41]. ...
... -27]. Qiao et al. and Zeng et al. have reported a low-velocity non-linear flow in the charging and migration process during the hydrocarbon accumulation in low-permeability (tight) sandstone reservoirs [14,27,31]. The governing equations describing the low-velocity non-Darcy flow have been obtained by theoretical derivation. However, differences presented in these equations due to different influencing factors taken into account in the fluid flow [32⇓-34]. Recently, pore-scale visualized microscopic physical simulation for the multiphase flow in reservoirs has been widely performed by combining the fluid flow flux apparatus and micrometer X-ray computed tomography (X-μCT). The popular investigations tend to focus on the water flooding or imbibition process in the hydrocarbon development of conventional sandstone or carbonate rocks [35⇓⇓⇓⇓-40]. The multiphase flow for oil/gas displacing water in charging process of the hydrocarbon accumulation remains poorly investigated although Lin et al. have noticed the multiphase flow behaviors during the capillary drainage procedure of gas displacement in heterogeneous sandstones [38]. Based on the pore-scale research, other scholars have observed and studied the dynamic multiphase fluid flow in low-permeability (tight) reservoirs by Lattice Boltzmann, Monte Carlo, and other multi-field fluid flow numerical simulation methods [41]. ...
... ,27,31]. The governing equations describing the low-velocity non-Darcy flow have been obtained by theoretical derivation. However, differences presented in these equations due to different influencing factors taken into account in the fluid flow [32⇓-34]. Recently, pore-scale visualized microscopic physical simulation for the multiphase flow in reservoirs has been widely performed by combining the fluid flow flux apparatus and micrometer X-ray computed tomography (X-μCT). The popular investigations tend to focus on the water flooding or imbibition process in the hydrocarbon development of conventional sandstone or carbonate rocks [35⇓⇓⇓⇓-40]. The multiphase flow for oil/gas displacing water in charging process of the hydrocarbon accumulation remains poorly investigated although Lin et al. have noticed the multiphase flow behaviors during the capillary drainage procedure of gas displacement in heterogeneous sandstones [38]. Based on the pore-scale research, other scholars have observed and studied the dynamic multiphase fluid flow in low-permeability (tight) reservoirs by Lattice Boltzmann, Monte Carlo, and other multi-field fluid flow numerical simulation methods [41]. ...
... Gas phase apparent permeability, widely employed to describe the flow regime variation of the gas phase in two-phase fluid flow [14,27], can be calculated using Eq. (2). The gas apparent permeability variation in the charging process agrees with the changing patterns of gas flow and gas saturation, firstly increasing and then becoming stable ...
Experimental simulation of impacts of vertical heterogeneity on oil migration and accumulation in fining upwards sands
1
2000
... Numerous investigations, involving physical simulation, numerical simulation, and theoretical derivation, have been conducted to probe the fluid flow mechanisms in low-permeability (tight) sandstone reservoirs [15,18⇓⇓⇓ -22]. Sand box model, core flooding experiment, and pore-scale fluid flow physcial simulation are three major techniques employed in physical simulaiton [23⇓⇓⇓⇓⇓-29]. The fluid flow in hydrocarbon charging process has been investigated through the sand box model macroscopically in lab, but the results can hardly be used to describe the actual multiphase flow in the charging process in low-permeability (tight) reservoirs. Therefore, the core flooding experiments were introduced and performed on the actual low-permeability (tight) sandstone samples in China and abroad [16-17,29 -30], in which the non-Darcy flow behaviors with an evident threshold pressure gradient (TPG) were identified in hydrocarbon flow [15,26 -27]. Qiao et al. and Zeng et al. have reported a low-velocity non-linear flow in the charging and migration process during the hydrocarbon accumulation in low-permeability (tight) sandstone reservoirs [14,27,31]. The governing equations describing the low-velocity non-Darcy flow have been obtained by theoretical derivation. However, differences presented in these equations due to different influencing factors taken into account in the fluid flow [32⇓-34]. Recently, pore-scale visualized microscopic physical simulation for the multiphase flow in reservoirs has been widely performed by combining the fluid flow flux apparatus and micrometer X-ray computed tomography (X-μCT). The popular investigations tend to focus on the water flooding or imbibition process in the hydrocarbon development of conventional sandstone or carbonate rocks [35⇓⇓⇓⇓-40]. The multiphase flow for oil/gas displacing water in charging process of the hydrocarbon accumulation remains poorly investigated although Lin et al. have noticed the multiphase flow behaviors during the capillary drainage procedure of gas displacement in heterogeneous sandstones [38]. Based on the pore-scale research, other scholars have observed and studied the dynamic multiphase fluid flow in low-permeability (tight) reservoirs by Lattice Boltzmann, Monte Carlo, and other multi-field fluid flow numerical simulation methods [41]. ...
Experimental study of seepage characteristic and mechanism in tight gas sands: A case from Xujiahe reservoir of Sichuan Basin
4
2014
... Numerous investigations, involving physical simulation, numerical simulation, and theoretical derivation, have been conducted to probe the fluid flow mechanisms in low-permeability (tight) sandstone reservoirs [15,18⇓⇓⇓ -22]. Sand box model, core flooding experiment, and pore-scale fluid flow physcial simulation are three major techniques employed in physical simulaiton [23⇓⇓⇓⇓⇓-29]. The fluid flow in hydrocarbon charging process has been investigated through the sand box model macroscopically in lab, but the results can hardly be used to describe the actual multiphase flow in the charging process in low-permeability (tight) reservoirs. Therefore, the core flooding experiments were introduced and performed on the actual low-permeability (tight) sandstone samples in China and abroad [16-17,29 -30], in which the non-Darcy flow behaviors with an evident threshold pressure gradient (TPG) were identified in hydrocarbon flow [15,26 -27]. Qiao et al. and Zeng et al. have reported a low-velocity non-linear flow in the charging and migration process during the hydrocarbon accumulation in low-permeability (tight) sandstone reservoirs [14,27,31]. The governing equations describing the low-velocity non-Darcy flow have been obtained by theoretical derivation. However, differences presented in these equations due to different influencing factors taken into account in the fluid flow [32⇓-34]. Recently, pore-scale visualized microscopic physical simulation for the multiphase flow in reservoirs has been widely performed by combining the fluid flow flux apparatus and micrometer X-ray computed tomography (X-μCT). The popular investigations tend to focus on the water flooding or imbibition process in the hydrocarbon development of conventional sandstone or carbonate rocks [35⇓⇓⇓⇓-40]. The multiphase flow for oil/gas displacing water in charging process of the hydrocarbon accumulation remains poorly investigated although Lin et al. have noticed the multiphase flow behaviors during the capillary drainage procedure of gas displacement in heterogeneous sandstones [38]. Based on the pore-scale research, other scholars have observed and studied the dynamic multiphase fluid flow in low-permeability (tight) reservoirs by Lattice Boltzmann, Monte Carlo, and other multi-field fluid flow numerical simulation methods [41]. ...
... ,29 -30], in which the non-Darcy flow behaviors with an evident threshold pressure gradient (TPG) were identified in hydrocarbon flow [15,26 -27]. Qiao et al. and Zeng et al. have reported a low-velocity non-linear flow in the charging and migration process during the hydrocarbon accumulation in low-permeability (tight) sandstone reservoirs [14,27,31]. The governing equations describing the low-velocity non-Darcy flow have been obtained by theoretical derivation. However, differences presented in these equations due to different influencing factors taken into account in the fluid flow [32⇓-34]. Recently, pore-scale visualized microscopic physical simulation for the multiphase flow in reservoirs has been widely performed by combining the fluid flow flux apparatus and micrometer X-ray computed tomography (X-μCT). The popular investigations tend to focus on the water flooding or imbibition process in the hydrocarbon development of conventional sandstone or carbonate rocks [35⇓⇓⇓⇓-40]. The multiphase flow for oil/gas displacing water in charging process of the hydrocarbon accumulation remains poorly investigated although Lin et al. have noticed the multiphase flow behaviors during the capillary drainage procedure of gas displacement in heterogeneous sandstones [38]. Based on the pore-scale research, other scholars have observed and studied the dynamic multiphase fluid flow in low-permeability (tight) reservoirs by Lattice Boltzmann, Monte Carlo, and other multi-field fluid flow numerical simulation methods [41]. ...
... As channels, the geometrical and topological features of pores in porous media govern the fluid flow and distribution characteristics [23-24,42⇓ -44]. The micro- to nano-meter pore system in low-permeability (tight) sandstone is responsible for the complex fluid flow and distribution law[22]. With progresses in pore-throat analysis techniques, especially the applications of scanning electron microscope (SEM), nuclear magnetic resonance (NMR), and X-μCT, explorations on the controlling factors for the fluid flow and distribution in the hydrocarbon reservoirs have emerged [14,29,45 -46]. Qiao et al. have discovered that the pore-throat configuration controls the fluid flow behaviors in tight gas charging process through X-μCT and core flooding experiments. Gong et al. have reported that the non-Darcy gas flow in low-permeability (tight) sandstone falls into four models, including composite, concave-up, concave-down, and linear models, under the control of the microscopic pore structures [29]. However, these results cannot directly reflect the fluid flow and distribution in the micro-nanometer pore system since they were based on the simple coupling of core flooding experiment and pore structure characterization. The statistically averaging of fluid flow and pore structure, and cross-scale coupling would result in more systematic errors [31], resulting in uncertainties in the fluid flow, distribution, and their controlling factors. As indicated, the key to uncovering the hydrocarbon charging mechanism in low-permeability (tight) sandstone lies in revealing the characteristics, law, and controlling factors of the fluid flow and distribution in the micro-nanometer pore system, which must rely on high-resolution pore-scale flow simulation [23⇓-25]. ...
... [29]. However, these results cannot directly reflect the fluid flow and distribution in the micro-nanometer pore system since they were based on the simple coupling of core flooding experiment and pore structure characterization. The statistically averaging of fluid flow and pore structure, and cross-scale coupling would result in more systematic errors [31], resulting in uncertainties in the fluid flow, distribution, and their controlling factors. As indicated, the key to uncovering the hydrocarbon charging mechanism in low-permeability (tight) sandstone lies in revealing the characteristics, law, and controlling factors of the fluid flow and distribution in the micro-nanometer pore system, which must rely on high-resolution pore-scale flow simulation [23⇓-25]. ...
The experimental study of characteristics of gas flow in tight formation
1
1997
... Numerous investigations, involving physical simulation, numerical simulation, and theoretical derivation, have been conducted to probe the fluid flow mechanisms in low-permeability (tight) sandstone reservoirs [15,18⇓⇓⇓ -22]. Sand box model, core flooding experiment, and pore-scale fluid flow physcial simulation are three major techniques employed in physical simulaiton [23⇓⇓⇓⇓⇓-29]. The fluid flow in hydrocarbon charging process has been investigated through the sand box model macroscopically in lab, but the results can hardly be used to describe the actual multiphase flow in the charging process in low-permeability (tight) reservoirs. Therefore, the core flooding experiments were introduced and performed on the actual low-permeability (tight) sandstone samples in China and abroad [16-17,29 -30], in which the non-Darcy flow behaviors with an evident threshold pressure gradient (TPG) were identified in hydrocarbon flow [15,26 -27]. Qiao et al. and Zeng et al. have reported a low-velocity non-linear flow in the charging and migration process during the hydrocarbon accumulation in low-permeability (tight) sandstone reservoirs [14,27,31]. The governing equations describing the low-velocity non-Darcy flow have been obtained by theoretical derivation. However, differences presented in these equations due to different influencing factors taken into account in the fluid flow [32⇓-34]. Recently, pore-scale visualized microscopic physical simulation for the multiphase flow in reservoirs has been widely performed by combining the fluid flow flux apparatus and micrometer X-ray computed tomography (X-μCT). The popular investigations tend to focus on the water flooding or imbibition process in the hydrocarbon development of conventional sandstone or carbonate rocks [35⇓⇓⇓⇓-40]. The multiphase flow for oil/gas displacing water in charging process of the hydrocarbon accumulation remains poorly investigated although Lin et al. have noticed the multiphase flow behaviors during the capillary drainage procedure of gas displacement in heterogeneous sandstones [38]. Based on the pore-scale research, other scholars have observed and studied the dynamic multiphase fluid flow in low-permeability (tight) reservoirs by Lattice Boltzmann, Monte Carlo, and other multi-field fluid flow numerical simulation methods [41]. ...
Study status and key scientific issue of tight reservoir oil and gas accumulation mechanism
2
2014
... Numerous investigations, involving physical simulation, numerical simulation, and theoretical derivation, have been conducted to probe the fluid flow mechanisms in low-permeability (tight) sandstone reservoirs [15,18⇓⇓⇓ -22]. Sand box model, core flooding experiment, and pore-scale fluid flow physcial simulation are three major techniques employed in physical simulaiton [23⇓⇓⇓⇓⇓-29]. The fluid flow in hydrocarbon charging process has been investigated through the sand box model macroscopically in lab, but the results can hardly be used to describe the actual multiphase flow in the charging process in low-permeability (tight) reservoirs. Therefore, the core flooding experiments were introduced and performed on the actual low-permeability (tight) sandstone samples in China and abroad [16-17,29 -30], in which the non-Darcy flow behaviors with an evident threshold pressure gradient (TPG) were identified in hydrocarbon flow [15,26 -27]. Qiao et al. and Zeng et al. have reported a low-velocity non-linear flow in the charging and migration process during the hydrocarbon accumulation in low-permeability (tight) sandstone reservoirs [14,27,31]. The governing equations describing the low-velocity non-Darcy flow have been obtained by theoretical derivation. However, differences presented in these equations due to different influencing factors taken into account in the fluid flow [32⇓-34]. Recently, pore-scale visualized microscopic physical simulation for the multiphase flow in reservoirs has been widely performed by combining the fluid flow flux apparatus and micrometer X-ray computed tomography (X-μCT). The popular investigations tend to focus on the water flooding or imbibition process in the hydrocarbon development of conventional sandstone or carbonate rocks [35⇓⇓⇓⇓-40]. The multiphase flow for oil/gas displacing water in charging process of the hydrocarbon accumulation remains poorly investigated although Lin et al. have noticed the multiphase flow behaviors during the capillary drainage procedure of gas displacement in heterogeneous sandstones [38]. Based on the pore-scale research, other scholars have observed and studied the dynamic multiphase fluid flow in low-permeability (tight) reservoirs by Lattice Boltzmann, Monte Carlo, and other multi-field fluid flow numerical simulation methods [41]. ...
... As channels, the geometrical and topological features of pores in porous media govern the fluid flow and distribution characteristics [23-24,42⇓ -44]. The micro- to nano-meter pore system in low-permeability (tight) sandstone is responsible for the complex fluid flow and distribution law[22]. With progresses in pore-throat analysis techniques, especially the applications of scanning electron microscope (SEM), nuclear magnetic resonance (NMR), and X-μCT, explorations on the controlling factors for the fluid flow and distribution in the hydrocarbon reservoirs have emerged [14,29,45 -46]. Qiao et al. have discovered that the pore-throat configuration controls the fluid flow behaviors in tight gas charging process through X-μCT and core flooding experiments. Gong et al. have reported that the non-Darcy gas flow in low-permeability (tight) sandstone falls into four models, including composite, concave-up, concave-down, and linear models, under the control of the microscopic pore structures [29]. However, these results cannot directly reflect the fluid flow and distribution in the micro-nanometer pore system since they were based on the simple coupling of core flooding experiment and pore structure characterization. The statistically averaging of fluid flow and pore structure, and cross-scale coupling would result in more systematic errors [31], resulting in uncertainties in the fluid flow, distribution, and their controlling factors. As indicated, the key to uncovering the hydrocarbon charging mechanism in low-permeability (tight) sandstone lies in revealing the characteristics, law, and controlling factors of the fluid flow and distribution in the micro-nanometer pore system, which must rely on high-resolution pore-scale flow simulation [23⇓-25]. ...
CHEN Zhangxin. Pre-Darcy flow in porous media
1
2017
... Numerous investigations, involving physical simulation, numerical simulation, and theoretical derivation, have been conducted to probe the fluid flow mechanisms in low-permeability (tight) sandstone reservoirs [15,18⇓⇓⇓ -22]. Sand box model, core flooding experiment, and pore-scale fluid flow physcial simulation are three major techniques employed in physical simulaiton [23⇓⇓⇓⇓⇓-29]. The fluid flow in hydrocarbon charging process has been investigated through the sand box model macroscopically in lab, but the results can hardly be used to describe the actual multiphase flow in the charging process in low-permeability (tight) reservoirs. Therefore, the core flooding experiments were introduced and performed on the actual low-permeability (tight) sandstone samples in China and abroad [16-17,29 -30], in which the non-Darcy flow behaviors with an evident threshold pressure gradient (TPG) were identified in hydrocarbon flow [15,26 -27]. Qiao et al. and Zeng et al. have reported a low-velocity non-linear flow in the charging and migration process during the hydrocarbon accumulation in low-permeability (tight) sandstone reservoirs [14,27,31]. The governing equations describing the low-velocity non-Darcy flow have been obtained by theoretical derivation. However, differences presented in these equations due to different influencing factors taken into account in the fluid flow [32⇓-34]. Recently, pore-scale visualized microscopic physical simulation for the multiphase flow in reservoirs has been widely performed by combining the fluid flow flux apparatus and micrometer X-ray computed tomography (X-μCT). The popular investigations tend to focus on the water flooding or imbibition process in the hydrocarbon development of conventional sandstone or carbonate rocks [35⇓⇓⇓⇓-40]. The multiphase flow for oil/gas displacing water in charging process of the hydrocarbon accumulation remains poorly investigated although Lin et al. have noticed the multiphase flow behaviors during the capillary drainage procedure of gas displacement in heterogeneous sandstones [38]. Based on the pore-scale research, other scholars have observed and studied the dynamic multiphase fluid flow in low-permeability (tight) reservoirs by Lattice Boltzmann, Monte Carlo, and other multi-field fluid flow numerical simulation methods [41]. ...
Pre- Darcy flow in tight and shale formations:Proceedings of the 70th Annual Meeting of the APS Division of Fluid Dynamics
1
2017
... Numerous investigations, involving physical simulation, numerical simulation, and theoretical derivation, have been conducted to probe the fluid flow mechanisms in low-permeability (tight) sandstone reservoirs [15,18⇓⇓⇓ -22]. Sand box model, core flooding experiment, and pore-scale fluid flow physcial simulation are three major techniques employed in physical simulaiton [23⇓⇓⇓⇓⇓-29]. The fluid flow in hydrocarbon charging process has been investigated through the sand box model macroscopically in lab, but the results can hardly be used to describe the actual multiphase flow in the charging process in low-permeability (tight) reservoirs. Therefore, the core flooding experiments were introduced and performed on the actual low-permeability (tight) sandstone samples in China and abroad [16-17,29 -30], in which the non-Darcy flow behaviors with an evident threshold pressure gradient (TPG) were identified in hydrocarbon flow [15,26 -27]. Qiao et al. and Zeng et al. have reported a low-velocity non-linear flow in the charging and migration process during the hydrocarbon accumulation in low-permeability (tight) sandstone reservoirs [14,27,31]. The governing equations describing the low-velocity non-Darcy flow have been obtained by theoretical derivation. However, differences presented in these equations due to different influencing factors taken into account in the fluid flow [32⇓-34]. Recently, pore-scale visualized microscopic physical simulation for the multiphase flow in reservoirs has been widely performed by combining the fluid flow flux apparatus and micrometer X-ray computed tomography (X-μCT). The popular investigations tend to focus on the water flooding or imbibition process in the hydrocarbon development of conventional sandstone or carbonate rocks [35⇓⇓⇓⇓-40]. The multiphase flow for oil/gas displacing water in charging process of the hydrocarbon accumulation remains poorly investigated although Lin et al. have noticed the multiphase flow behaviors during the capillary drainage procedure of gas displacement in heterogeneous sandstones [38]. Based on the pore-scale research, other scholars have observed and studied the dynamic multiphase fluid flow in low-permeability (tight) reservoirs by Lattice Boltzmann, Monte Carlo, and other multi-field fluid flow numerical simulation methods [41]. ...
A new non- Darcy flow model for low-velocity multiphase flow in tight reservoirs
1
2017
... Numerous investigations, involving physical simulation, numerical simulation, and theoretical derivation, have been conducted to probe the fluid flow mechanisms in low-permeability (tight) sandstone reservoirs [15,18⇓⇓⇓ -22]. Sand box model, core flooding experiment, and pore-scale fluid flow physcial simulation are three major techniques employed in physical simulaiton [23⇓⇓⇓⇓⇓-29]. The fluid flow in hydrocarbon charging process has been investigated through the sand box model macroscopically in lab, but the results can hardly be used to describe the actual multiphase flow in the charging process in low-permeability (tight) reservoirs. Therefore, the core flooding experiments were introduced and performed on the actual low-permeability (tight) sandstone samples in China and abroad [16-17,29 -30], in which the non-Darcy flow behaviors with an evident threshold pressure gradient (TPG) were identified in hydrocarbon flow [15,26 -27]. Qiao et al. and Zeng et al. have reported a low-velocity non-linear flow in the charging and migration process during the hydrocarbon accumulation in low-permeability (tight) sandstone reservoirs [14,27,31]. The governing equations describing the low-velocity non-Darcy flow have been obtained by theoretical derivation. However, differences presented in these equations due to different influencing factors taken into account in the fluid flow [32⇓-34]. Recently, pore-scale visualized microscopic physical simulation for the multiphase flow in reservoirs has been widely performed by combining the fluid flow flux apparatus and micrometer X-ray computed tomography (X-μCT). The popular investigations tend to focus on the water flooding or imbibition process in the hydrocarbon development of conventional sandstone or carbonate rocks [35⇓⇓⇓⇓-40]. The multiphase flow for oil/gas displacing water in charging process of the hydrocarbon accumulation remains poorly investigated although Lin et al. have noticed the multiphase flow behaviors during the capillary drainage procedure of gas displacement in heterogeneous sandstones [38]. Based on the pore-scale research, other scholars have observed and studied the dynamic multiphase fluid flow in low-permeability (tight) reservoirs by Lattice Boltzmann, Monte Carlo, and other multi-field fluid flow numerical simulation methods [41]. ...
Multi-scale experimental study of carbonated water injection: An effective process for mobilization and recovery of trapped oil
2
2014
... Numerous investigations, involving physical simulation, numerical simulation, and theoretical derivation, have been conducted to probe the fluid flow mechanisms in low-permeability (tight) sandstone reservoirs [15,18⇓⇓⇓ -22]. Sand box model, core flooding experiment, and pore-scale fluid flow physcial simulation are three major techniques employed in physical simulaiton [23⇓⇓⇓⇓⇓-29]. The fluid flow in hydrocarbon charging process has been investigated through the sand box model macroscopically in lab, but the results can hardly be used to describe the actual multiphase flow in the charging process in low-permeability (tight) reservoirs. Therefore, the core flooding experiments were introduced and performed on the actual low-permeability (tight) sandstone samples in China and abroad [16-17,29 -30], in which the non-Darcy flow behaviors with an evident threshold pressure gradient (TPG) were identified in hydrocarbon flow [15,26 -27]. Qiao et al. and Zeng et al. have reported a low-velocity non-linear flow in the charging and migration process during the hydrocarbon accumulation in low-permeability (tight) sandstone reservoirs [14,27,31]. The governing equations describing the low-velocity non-Darcy flow have been obtained by theoretical derivation. However, differences presented in these equations due to different influencing factors taken into account in the fluid flow [32⇓-34]. Recently, pore-scale visualized microscopic physical simulation for the multiphase flow in reservoirs has been widely performed by combining the fluid flow flux apparatus and micrometer X-ray computed tomography (X-μCT). The popular investigations tend to focus on the water flooding or imbibition process in the hydrocarbon development of conventional sandstone or carbonate rocks [35⇓⇓⇓⇓-40]. The multiphase flow for oil/gas displacing water in charging process of the hydrocarbon accumulation remains poorly investigated although Lin et al. have noticed the multiphase flow behaviors during the capillary drainage procedure of gas displacement in heterogeneous sandstones [38]. Based on the pore-scale research, other scholars have observed and studied the dynamic multiphase fluid flow in low-permeability (tight) reservoirs by Lattice Boltzmann, Monte Carlo, and other multi-field fluid flow numerical simulation methods [41]. ...
... Observations on the 2D and 3D original grayscale images and 3D gas-water distribution graphs suggest that natural gas firstly displaced the water in the center of large- sized intergranular pores from the satu rated state to the pressure node of 0.10 MPa (Figs. 7c, 9a, 9d). The gas phase shows a concentrated occurrence at the center of the large-sized pores, while the water phase exhibits a thin-film occurrence and adheres to the pore edges. This is similar to the phenomenon that nitrogen firstly displaced water in the large-sized pores of the heterogeneous sandstone, observed during the capillary drainage process in the X-CT imaging experiment conducted by Lin et al. [38-39]. It also agrees with the phenomenon that CO2 preferentially occupied the center of the pore-throats after precipitation during the carbonated water flooding in the X-CT imaging experiment performed by Alizadeh et al. [35]. However, there is still plenty of small-sized pores saturated with brine in this experiment. In space, both the gas phase and water phases are distributed as clusters in pore network (Fig. 7i), and the calculated gas saturation is 40%. The large intergranular pores filled with gas are connected by wide throats, constructing the primary framework of gas charging channels (Fig. 8a, 8e). The continuous gas flow and reduction of water saturation in the pore-throat system of primary framework resulted in an abrupt increase of apparent gas permeability (Fig. 6c). ...
In-situ characterization of wettability and pore-scale displacements during two- and three-phase flow in natural porous media
2
2016
... Numerous investigations, involving physical simulation, numerical simulation, and theoretical derivation, have been conducted to probe the fluid flow mechanisms in low-permeability (tight) sandstone reservoirs [15,18⇓⇓⇓ -22]. Sand box model, core flooding experiment, and pore-scale fluid flow physcial simulation are three major techniques employed in physical simulaiton [23⇓⇓⇓⇓⇓-29]. The fluid flow in hydrocarbon charging process has been investigated through the sand box model macroscopically in lab, but the results can hardly be used to describe the actual multiphase flow in the charging process in low-permeability (tight) reservoirs. Therefore, the core flooding experiments were introduced and performed on the actual low-permeability (tight) sandstone samples in China and abroad [16-17,29 -30], in which the non-Darcy flow behaviors with an evident threshold pressure gradient (TPG) were identified in hydrocarbon flow [15,26 -27]. Qiao et al. and Zeng et al. have reported a low-velocity non-linear flow in the charging and migration process during the hydrocarbon accumulation in low-permeability (tight) sandstone reservoirs [14,27,31]. The governing equations describing the low-velocity non-Darcy flow have been obtained by theoretical derivation. However, differences presented in these equations due to different influencing factors taken into account in the fluid flow [32⇓-34]. Recently, pore-scale visualized microscopic physical simulation for the multiphase flow in reservoirs has been widely performed by combining the fluid flow flux apparatus and micrometer X-ray computed tomography (X-μCT). The popular investigations tend to focus on the water flooding or imbibition process in the hydrocarbon development of conventional sandstone or carbonate rocks [35⇓⇓⇓⇓-40]. The multiphase flow for oil/gas displacing water in charging process of the hydrocarbon accumulation remains poorly investigated although Lin et al. have noticed the multiphase flow behaviors during the capillary drainage procedure of gas displacement in heterogeneous sandstones [38]. Based on the pore-scale research, other scholars have observed and studied the dynamic multiphase fluid flow in low-permeability (tight) reservoirs by Lattice Boltzmann, Monte Carlo, and other multi-field fluid flow numerical simulation methods [41]. ...
... The 2D and 3D X-CT gray scale images under different charging pressures were acquired by choosing six featured nodes at four different charging states in the pore-scale gas charging physical simulation, including the original dry state, KI solution-saturated state, and states at charging pressures of 0.10, 0.15, 0.20, and 0.50 MPa (Fig. 7). On the grayscale images, the KI solution-saturated pores are bright white, the rock matrix is generally gray, while the part of pores will be complete black after gas intrusion. These imaging features are consistent with those in the pore-scale multiphase flow physical simulation conducted by Armstrong et al. and Khishvand et al. [23,36]. According to the grayscale differences among the rock matrix, gas, and aqueous solution, and considering the grayscale differences on the images of different nodes resulted from the gas-water distribution, the pore-scale spatial gas-water distributions at different charging pressures can be constructed by pore-scale in-situ computation and interactive threshold segmentation (Fig. 7g-7i). The pore-throat zones occupied by gas phase were extracted (Fig. 8a-8d), and then the pore- throat skeleton networks at different charging pressures were built by conducting PNM (Fig. 8e-8h). The pore structure parameters for the channels at corresponding nodes were calculated. ...
Pore- scale imaging of displacement patterns in an altered- wettability carbonate
1
2021
... Numerous investigations, involving physical simulation, numerical simulation, and theoretical derivation, have been conducted to probe the fluid flow mechanisms in low-permeability (tight) sandstone reservoirs [15,18⇓⇓⇓ -22]. Sand box model, core flooding experiment, and pore-scale fluid flow physcial simulation are three major techniques employed in physical simulaiton [23⇓⇓⇓⇓⇓-29]. The fluid flow in hydrocarbon charging process has been investigated through the sand box model macroscopically in lab, but the results can hardly be used to describe the actual multiphase flow in the charging process in low-permeability (tight) reservoirs. Therefore, the core flooding experiments were introduced and performed on the actual low-permeability (tight) sandstone samples in China and abroad [16-17,29 -30], in which the non-Darcy flow behaviors with an evident threshold pressure gradient (TPG) were identified in hydrocarbon flow [15,26 -27]. Qiao et al. and Zeng et al. have reported a low-velocity non-linear flow in the charging and migration process during the hydrocarbon accumulation in low-permeability (tight) sandstone reservoirs [14,27,31]. The governing equations describing the low-velocity non-Darcy flow have been obtained by theoretical derivation. However, differences presented in these equations due to different influencing factors taken into account in the fluid flow [32⇓-34]. Recently, pore-scale visualized microscopic physical simulation for the multiphase flow in reservoirs has been widely performed by combining the fluid flow flux apparatus and micrometer X-ray computed tomography (X-μCT). The popular investigations tend to focus on the water flooding or imbibition process in the hydrocarbon development of conventional sandstone or carbonate rocks [35⇓⇓⇓⇓-40]. The multiphase flow for oil/gas displacing water in charging process of the hydrocarbon accumulation remains poorly investigated although Lin et al. have noticed the multiphase flow behaviors during the capillary drainage procedure of gas displacement in heterogeneous sandstones [38]. Based on the pore-scale research, other scholars have observed and studied the dynamic multiphase fluid flow in low-permeability (tight) reservoirs by Lattice Boltzmann, Monte Carlo, and other multi-field fluid flow numerical simulation methods [41]. ...
Drainage capillary pressure distribution and fluid displacement in a heterogeneous laminated sandstone
3
2021
... Numerous investigations, involving physical simulation, numerical simulation, and theoretical derivation, have been conducted to probe the fluid flow mechanisms in low-permeability (tight) sandstone reservoirs [15,18⇓⇓⇓ -22]. Sand box model, core flooding experiment, and pore-scale fluid flow physcial simulation are three major techniques employed in physical simulaiton [23⇓⇓⇓⇓⇓-29]. The fluid flow in hydrocarbon charging process has been investigated through the sand box model macroscopically in lab, but the results can hardly be used to describe the actual multiphase flow in the charging process in low-permeability (tight) reservoirs. Therefore, the core flooding experiments were introduced and performed on the actual low-permeability (tight) sandstone samples in China and abroad [16-17,29 -30], in which the non-Darcy flow behaviors with an evident threshold pressure gradient (TPG) were identified in hydrocarbon flow [15,26 -27]. Qiao et al. and Zeng et al. have reported a low-velocity non-linear flow in the charging and migration process during the hydrocarbon accumulation in low-permeability (tight) sandstone reservoirs [14,27,31]. The governing equations describing the low-velocity non-Darcy flow have been obtained by theoretical derivation. However, differences presented in these equations due to different influencing factors taken into account in the fluid flow [32⇓-34]. Recently, pore-scale visualized microscopic physical simulation for the multiphase flow in reservoirs has been widely performed by combining the fluid flow flux apparatus and micrometer X-ray computed tomography (X-μCT). The popular investigations tend to focus on the water flooding or imbibition process in the hydrocarbon development of conventional sandstone or carbonate rocks [35⇓⇓⇓⇓-40]. The multiphase flow for oil/gas displacing water in charging process of the hydrocarbon accumulation remains poorly investigated although Lin et al. have noticed the multiphase flow behaviors during the capillary drainage procedure of gas displacement in heterogeneous sandstones [38]. Based on the pore-scale research, other scholars have observed and studied the dynamic multiphase fluid flow in low-permeability (tight) reservoirs by Lattice Boltzmann, Monte Carlo, and other multi-field fluid flow numerical simulation methods [41]. ...
... [38]. Based on the pore-scale research, other scholars have observed and studied the dynamic multiphase fluid flow in low-permeability (tight) reservoirs by Lattice Boltzmann, Monte Carlo, and other multi-field fluid flow numerical simulation methods [41]. ...
... Observations on the 2D and 3D original grayscale images and 3D gas-water distribution graphs suggest that natural gas firstly displaced the water in the center of large- sized intergranular pores from the satu rated state to the pressure node of 0.10 MPa (Figs. 7c, 9a, 9d). The gas phase shows a concentrated occurrence at the center of the large-sized pores, while the water phase exhibits a thin-film occurrence and adheres to the pore edges. This is similar to the phenomenon that nitrogen firstly displaced water in the large-sized pores of the heterogeneous sandstone, observed during the capillary drainage process in the X-CT imaging experiment conducted by Lin et al. [38-39]. It also agrees with the phenomenon that CO2 preferentially occupied the center of the pore-throats after precipitation during the carbonated water flooding in the X-CT imaging experiment performed by Alizadeh et al. [35]. However, there is still plenty of small-sized pores saturated with brine in this experiment. In space, both the gas phase and water phases are distributed as clusters in pore network (Fig. 7i), and the calculated gas saturation is 40%. The large intergranular pores filled with gas are connected by wide throats, constructing the primary framework of gas charging channels (Fig. 8a, 8e). The continuous gas flow and reduction of water saturation in the pore-throat system of primary framework resulted in an abrupt increase of apparent gas permeability (Fig. 6c). ...
Visualization and quantification of capillary drainage in the pore space of laminated sandstone by a porous plate method using differential imaging X-ray microtomography
2
2017
... Numerous investigations, involving physical simulation, numerical simulation, and theoretical derivation, have been conducted to probe the fluid flow mechanisms in low-permeability (tight) sandstone reservoirs [15,18⇓⇓⇓ -22]. Sand box model, core flooding experiment, and pore-scale fluid flow physcial simulation are three major techniques employed in physical simulaiton [23⇓⇓⇓⇓⇓-29]. The fluid flow in hydrocarbon charging process has been investigated through the sand box model macroscopically in lab, but the results can hardly be used to describe the actual multiphase flow in the charging process in low-permeability (tight) reservoirs. Therefore, the core flooding experiments were introduced and performed on the actual low-permeability (tight) sandstone samples in China and abroad [16-17,29 -30], in which the non-Darcy flow behaviors with an evident threshold pressure gradient (TPG) were identified in hydrocarbon flow [15,26 -27]. Qiao et al. and Zeng et al. have reported a low-velocity non-linear flow in the charging and migration process during the hydrocarbon accumulation in low-permeability (tight) sandstone reservoirs [14,27,31]. The governing equations describing the low-velocity non-Darcy flow have been obtained by theoretical derivation. However, differences presented in these equations due to different influencing factors taken into account in the fluid flow [32⇓-34]. Recently, pore-scale visualized microscopic physical simulation for the multiphase flow in reservoirs has been widely performed by combining the fluid flow flux apparatus and micrometer X-ray computed tomography (X-μCT). The popular investigations tend to focus on the water flooding or imbibition process in the hydrocarbon development of conventional sandstone or carbonate rocks [35⇓⇓⇓⇓-40]. The multiphase flow for oil/gas displacing water in charging process of the hydrocarbon accumulation remains poorly investigated although Lin et al. have noticed the multiphase flow behaviors during the capillary drainage procedure of gas displacement in heterogeneous sandstones [38]. Based on the pore-scale research, other scholars have observed and studied the dynamic multiphase fluid flow in low-permeability (tight) reservoirs by Lattice Boltzmann, Monte Carlo, and other multi-field fluid flow numerical simulation methods [41]. ...
... Observations on the 2D and 3D original grayscale images and 3D gas-water distribution graphs suggest that natural gas firstly displaced the water in the center of large- sized intergranular pores from the satu rated state to the pressure node of 0.10 MPa (Figs. 7c, 9a, 9d). The gas phase shows a concentrated occurrence at the center of the large-sized pores, while the water phase exhibits a thin-film occurrence and adheres to the pore edges. This is similar to the phenomenon that nitrogen firstly displaced water in the large-sized pores of the heterogeneous sandstone, observed during the capillary drainage process in the X-CT imaging experiment conducted by Lin et al. [38-39]. It also agrees with the phenomenon that CO2 preferentially occupied the center of the pore-throats after precipitation during the carbonated water flooding in the X-CT imaging experiment performed by Alizadeh et al. [35]. However, there is still plenty of small-sized pores saturated with brine in this experiment. In space, both the gas phase and water phases are distributed as clusters in pore network (Fig. 7i), and the calculated gas saturation is 40%. The large intergranular pores filled with gas are connected by wide throats, constructing the primary framework of gas charging channels (Fig. 8a, 8e). The continuous gas flow and reduction of water saturation in the pore-throat system of primary framework resulted in an abrupt increase of apparent gas permeability (Fig. 6c). ...
Experimental study on relation between seepage and stress of sandstone in CT scale
1
2005
... Numerous investigations, involving physical simulation, numerical simulation, and theoretical derivation, have been conducted to probe the fluid flow mechanisms in low-permeability (tight) sandstone reservoirs [15,18⇓⇓⇓ -22]. Sand box model, core flooding experiment, and pore-scale fluid flow physcial simulation are three major techniques employed in physical simulaiton [23⇓⇓⇓⇓⇓-29]. The fluid flow in hydrocarbon charging process has been investigated through the sand box model macroscopically in lab, but the results can hardly be used to describe the actual multiphase flow in the charging process in low-permeability (tight) reservoirs. Therefore, the core flooding experiments were introduced and performed on the actual low-permeability (tight) sandstone samples in China and abroad [16-17,29 -30], in which the non-Darcy flow behaviors with an evident threshold pressure gradient (TPG) were identified in hydrocarbon flow [15,26 -27]. Qiao et al. and Zeng et al. have reported a low-velocity non-linear flow in the charging and migration process during the hydrocarbon accumulation in low-permeability (tight) sandstone reservoirs [14,27,31]. The governing equations describing the low-velocity non-Darcy flow have been obtained by theoretical derivation. However, differences presented in these equations due to different influencing factors taken into account in the fluid flow [32⇓-34]. Recently, pore-scale visualized microscopic physical simulation for the multiphase flow in reservoirs has been widely performed by combining the fluid flow flux apparatus and micrometer X-ray computed tomography (X-μCT). The popular investigations tend to focus on the water flooding or imbibition process in the hydrocarbon development of conventional sandstone or carbonate rocks [35⇓⇓⇓⇓-40]. The multiphase flow for oil/gas displacing water in charging process of the hydrocarbon accumulation remains poorly investigated although Lin et al. have noticed the multiphase flow behaviors during the capillary drainage procedure of gas displacement in heterogeneous sandstones [38]. Based on the pore-scale research, other scholars have observed and studied the dynamic multiphase fluid flow in low-permeability (tight) reservoirs by Lattice Boltzmann, Monte Carlo, and other multi-field fluid flow numerical simulation methods [41]. ...
Experimental study of hydraulic fracturing for shale by stimulated reservoir volume
1
2014
... Numerous investigations, involving physical simulation, numerical simulation, and theoretical derivation, have been conducted to probe the fluid flow mechanisms in low-permeability (tight) sandstone reservoirs [15,18⇓⇓⇓ -22]. Sand box model, core flooding experiment, and pore-scale fluid flow physcial simulation are three major techniques employed in physical simulaiton [23⇓⇓⇓⇓⇓-29]. The fluid flow in hydrocarbon charging process has been investigated through the sand box model macroscopically in lab, but the results can hardly be used to describe the actual multiphase flow in the charging process in low-permeability (tight) reservoirs. Therefore, the core flooding experiments were introduced and performed on the actual low-permeability (tight) sandstone samples in China and abroad [16-17,29 -30], in which the non-Darcy flow behaviors with an evident threshold pressure gradient (TPG) were identified in hydrocarbon flow [15,26 -27]. Qiao et al. and Zeng et al. have reported a low-velocity non-linear flow in the charging and migration process during the hydrocarbon accumulation in low-permeability (tight) sandstone reservoirs [14,27,31]. The governing equations describing the low-velocity non-Darcy flow have been obtained by theoretical derivation. However, differences presented in these equations due to different influencing factors taken into account in the fluid flow [32⇓-34]. Recently, pore-scale visualized microscopic physical simulation for the multiphase flow in reservoirs has been widely performed by combining the fluid flow flux apparatus and micrometer X-ray computed tomography (X-μCT). The popular investigations tend to focus on the water flooding or imbibition process in the hydrocarbon development of conventional sandstone or carbonate rocks [35⇓⇓⇓⇓-40]. The multiphase flow for oil/gas displacing water in charging process of the hydrocarbon accumulation remains poorly investigated although Lin et al. have noticed the multiphase flow behaviors during the capillary drainage procedure of gas displacement in heterogeneous sandstones [38]. Based on the pore-scale research, other scholars have observed and studied the dynamic multiphase fluid flow in low-permeability (tight) reservoirs by Lattice Boltzmann, Monte Carlo, and other multi-field fluid flow numerical simulation methods [41]. ...
Fractal dimension, lacunarity and succolarity analyses on CT images of reservoir rocks for permeability prediction
1
2019
... As channels, the geometrical and topological features of pores in porous media govern the fluid flow and distribution characteristics [23-24,42⇓ -44]. The micro- to nano-meter pore system in low-permeability (tight) sandstone is responsible for the complex fluid flow and distribution law[22]. With progresses in pore-throat analysis techniques, especially the applications of scanning electron microscope (SEM), nuclear magnetic resonance (NMR), and X-μCT, explorations on the controlling factors for the fluid flow and distribution in the hydrocarbon reservoirs have emerged [14,29,45 -46]. Qiao et al. have discovered that the pore-throat configuration controls the fluid flow behaviors in tight gas charging process through X-μCT and core flooding experiments. Gong et al. have reported that the non-Darcy gas flow in low-permeability (tight) sandstone falls into four models, including composite, concave-up, concave-down, and linear models, under the control of the microscopic pore structures [29]. However, these results cannot directly reflect the fluid flow and distribution in the micro-nanometer pore system since they were based on the simple coupling of core flooding experiment and pore structure characterization. The statistically averaging of fluid flow and pore structure, and cross-scale coupling would result in more systematic errors [31], resulting in uncertainties in the fluid flow, distribution, and their controlling factors. As indicated, the key to uncovering the hydrocarbon charging mechanism in low-permeability (tight) sandstone lies in revealing the characteristics, law, and controlling factors of the fluid flow and distribution in the micro-nanometer pore system, which must rely on high-resolution pore-scale flow simulation [23⇓-25]. ...
1
1972
... As channels, the geometrical and topological features of pores in porous media govern the fluid flow and distribution characteristics [23-24,42⇓ -44]. The micro- to nano-meter pore system in low-permeability (tight) sandstone is responsible for the complex fluid flow and distribution law[22]. With progresses in pore-throat analysis techniques, especially the applications of scanning electron microscope (SEM), nuclear magnetic resonance (NMR), and X-μCT, explorations on the controlling factors for the fluid flow and distribution in the hydrocarbon reservoirs have emerged [14,29,45 -46]. Qiao et al. have discovered that the pore-throat configuration controls the fluid flow behaviors in tight gas charging process through X-μCT and core flooding experiments. Gong et al. have reported that the non-Darcy gas flow in low-permeability (tight) sandstone falls into four models, including composite, concave-up, concave-down, and linear models, under the control of the microscopic pore structures [29]. However, these results cannot directly reflect the fluid flow and distribution in the micro-nanometer pore system since they were based on the simple coupling of core flooding experiment and pore structure characterization. The statistically averaging of fluid flow and pore structure, and cross-scale coupling would result in more systematic errors [31], resulting in uncertainties in the fluid flow, distribution, and their controlling factors. As indicated, the key to uncovering the hydrocarbon charging mechanism in low-permeability (tight) sandstone lies in revealing the characteristics, law, and controlling factors of the fluid flow and distribution in the micro-nanometer pore system, which must rely on high-resolution pore-scale flow simulation [23⇓-25]. ...
Physically-based network modeling of multiphase flow in intermediate-wet porous media
1
1998
... As channels, the geometrical and topological features of pores in porous media govern the fluid flow and distribution characteristics [23-24,42⇓ -44]. The micro- to nano-meter pore system in low-permeability (tight) sandstone is responsible for the complex fluid flow and distribution law[22]. With progresses in pore-throat analysis techniques, especially the applications of scanning electron microscope (SEM), nuclear magnetic resonance (NMR), and X-μCT, explorations on the controlling factors for the fluid flow and distribution in the hydrocarbon reservoirs have emerged [14,29,45 -46]. Qiao et al. have discovered that the pore-throat configuration controls the fluid flow behaviors in tight gas charging process through X-μCT and core flooding experiments. Gong et al. have reported that the non-Darcy gas flow in low-permeability (tight) sandstone falls into four models, including composite, concave-up, concave-down, and linear models, under the control of the microscopic pore structures [29]. However, these results cannot directly reflect the fluid flow and distribution in the micro-nanometer pore system since they were based on the simple coupling of core flooding experiment and pore structure characterization. The statistically averaging of fluid flow and pore structure, and cross-scale coupling would result in more systematic errors [31], resulting in uncertainties in the fluid flow, distribution, and their controlling factors. As indicated, the key to uncovering the hydrocarbon charging mechanism in low-permeability (tight) sandstone lies in revealing the characteristics, law, and controlling factors of the fluid flow and distribution in the micro-nanometer pore system, which must rely on high-resolution pore-scale flow simulation [23⇓-25]. ...
The influence of fracture geometry variation on non-Darcy flow in fractures under confining stresses
1
2019
... As channels, the geometrical and topological features of pores in porous media govern the fluid flow and distribution characteristics [23-24,42⇓ -44]. The micro- to nano-meter pore system in low-permeability (tight) sandstone is responsible for the complex fluid flow and distribution law[22]. With progresses in pore-throat analysis techniques, especially the applications of scanning electron microscope (SEM), nuclear magnetic resonance (NMR), and X-μCT, explorations on the controlling factors for the fluid flow and distribution in the hydrocarbon reservoirs have emerged [14,29,45 -46]. Qiao et al. have discovered that the pore-throat configuration controls the fluid flow behaviors in tight gas charging process through X-μCT and core flooding experiments. Gong et al. have reported that the non-Darcy gas flow in low-permeability (tight) sandstone falls into four models, including composite, concave-up, concave-down, and linear models, under the control of the microscopic pore structures [29]. However, these results cannot directly reflect the fluid flow and distribution in the micro-nanometer pore system since they were based on the simple coupling of core flooding experiment and pore structure characterization. The statistically averaging of fluid flow and pore structure, and cross-scale coupling would result in more systematic errors [31], resulting in uncertainties in the fluid flow, distribution, and their controlling factors. As indicated, the key to uncovering the hydrocarbon charging mechanism in low-permeability (tight) sandstone lies in revealing the characteristics, law, and controlling factors of the fluid flow and distribution in the micro-nanometer pore system, which must rely on high-resolution pore-scale flow simulation [23⇓-25]. ...
The threshold pressure gradient effect in the tight sandstone gas reservoirs with high water saturation
1
2018
... As channels, the geometrical and topological features of pores in porous media govern the fluid flow and distribution characteristics [23-24,42⇓ -44]. The micro- to nano-meter pore system in low-permeability (tight) sandstone is responsible for the complex fluid flow and distribution law[22]. With progresses in pore-throat analysis techniques, especially the applications of scanning electron microscope (SEM), nuclear magnetic resonance (NMR), and X-μCT, explorations on the controlling factors for the fluid flow and distribution in the hydrocarbon reservoirs have emerged [14,29,45 -46]. Qiao et al. have discovered that the pore-throat configuration controls the fluid flow behaviors in tight gas charging process through X-μCT and core flooding experiments. Gong et al. have reported that the non-Darcy gas flow in low-permeability (tight) sandstone falls into four models, including composite, concave-up, concave-down, and linear models, under the control of the microscopic pore structures [29]. However, these results cannot directly reflect the fluid flow and distribution in the micro-nanometer pore system since they were based on the simple coupling of core flooding experiment and pore structure characterization. The statistically averaging of fluid flow and pore structure, and cross-scale coupling would result in more systematic errors [31], resulting in uncertainties in the fluid flow, distribution, and their controlling factors. As indicated, the key to uncovering the hydrocarbon charging mechanism in low-permeability (tight) sandstone lies in revealing the characteristics, law, and controlling factors of the fluid flow and distribution in the micro-nanometer pore system, which must rely on high-resolution pore-scale flow simulation [23⇓-25]. ...
Geological conditions for lower Es1 tight sandstone oil in Qibei Slope of Qikou Depression
1
2014
... The core samples in this study were collected in the second member of the Shahejie Formation (Es2) in the Palaeogene tight sandstone gas reservoir located in the Qibei slope of Qikou Sag in middle Huanghua Depression, the Bohai Bay Basin. The Es2 interval is characterized by interbedded source rocks and reservoirs [47⇓-49]. The sample was taken at 3790.49 m in Well BS35 drilled in Banqiao slope belt on the Qibei Slope, which is located at the interface of source rocks and low-permeability (tight) sandstone reservoirs where natural gas charging happens. The lithology is medium grained, the core length, diameter is 6.56 and 2.51 cm, the gas porosity is 11.42%, the permeability is 3.94×10⁻³ μm2 and the contact angle is 51.90°. ...
Geologic characteristics of deep water deposits and exploration discoveries in slope zones of fault lake basin: A case study of Paleogene Shahejie Formation in Banqiao-Qibei Slope, Qikou Sag, Bohai Bay Basin
1
2017
... The core samples in this study were collected in the second member of the Shahejie Formation (Es2) in the Palaeogene tight sandstone gas reservoir located in the Qibei slope of Qikou Sag in middle Huanghua Depression, the Bohai Bay Basin. The Es2 interval is characterized by interbedded source rocks and reservoirs [47⇓-49]. The sample was taken at 3790.49 m in Well BS35 drilled in Banqiao slope belt on the Qibei Slope, which is located at the interface of source rocks and low-permeability (tight) sandstone reservoirs where natural gas charging happens. The lithology is medium grained, the core length, diameter is 6.56 and 2.51 cm, the gas porosity is 11.42%, the permeability is 3.94×10⁻³ μm2 and the contact angle is 51.90°. ...
Fault-sand combination modes and hydrocarbon accumulation in Binhai fault nose of Qikou Sag, Bohai Bay Basin, East China
1
2019
... The core samples in this study were collected in the second member of the Shahejie Formation (Es2) in the Palaeogene tight sandstone gas reservoir located in the Qibei slope of Qikou Sag in middle Huanghua Depression, the Bohai Bay Basin. The Es2 interval is characterized by interbedded source rocks and reservoirs [47⇓-49]. The sample was taken at 3790.49 m in Well BS35 drilled in Banqiao slope belt on the Qibei Slope, which is located at the interface of source rocks and low-permeability (tight) sandstone reservoirs where natural gas charging happens. The lithology is medium grained, the core length, diameter is 6.56 and 2.51 cm, the gas porosity is 11.42%, the permeability is 3.94×10⁻³ μm2 and the contact angle is 51.90°. ...
Impacts of sedimentology and diagenesis on pore structure and reservoir quality in tight oil sandstone reservoirs: Implications for macroscopic and microscopic heterogeneities
2
2020
... Primary and secondary pores are two major pore types in the tight sandstone samples [50], of which the primary residual intergranular pores dominate the primary pores, exhibiting regular appearances with sizes between dozens and hundreds of microns (Fig. 4a). Intergranular dissolution pores, dissolution intragranular pores, intercrystalline pores, and micro fractures are secondary pores. The dissolution intergranular pores are the results of dissolution along dissolvable grain edges (feldspar and rock fragment), showing irregular pore shapes with widths between dozens and hundreds of microns (Fig. 4a, 4b). The dissolution intragranular pores form inside the dissolvable grains, exhibiting irregular outlines and sizes ranging from several to dozens of microns (Fig. 4b). The intercrystalline pores are located between the clay aggregates, ranging from several hundred nanometers to several microns (Fig. 4c). The micro fractures are slits running through the rock grains with long extensions, providing connections for disconnected pores (Fig. 4a). Section observation suggests the sample shares similar pore genesis to typical tight sandstone [50], in which the intergranular pores account for 80%. The primary intergranular pores are comparable with the dissolution intergranular pores in proportions. Dissolution intragranular pores in rock fragments and feldspars account for about 15%, and a few amount of micro fractures and intercrystalline pores exists in the pore system (Fig. 4a). ...
... [50], in which the intergranular pores account for 80%. The primary intergranular pores are comparable with the dissolution intergranular pores in proportions. Dissolution intragranular pores in rock fragments and feldspars account for about 15%, and a few amount of micro fractures and intercrystalline pores exists in the pore system (Fig. 4a). ...
Pore-network extraction from micro- computerized-tomography images
1
2009
... The analysis on X-μCT scanning suggests the connected large-sized pores with regular shape construct the major structure of the pore-throat system in low-permeability (tight) sandstone, while small-sized, irregular, and poorly connected pores are generally distributed along the major structure. The spherical tiny pores exhibit disperse distributions, which can locate inside the major structure, bridging the large-sized and small-sized pores, or distribute away from the main body, showing isolated spatial distributions (Fig. 5a-5d). The radius distribution of pores and throats derived from the PNM developed by Dong and Blunt [51] indicates wide distribution range of low-permeability (tight) sandstone (Fig. 5d). The pore radius ranges from 10 to 120 μm, with main peak in 20-60 μm (avg. 12.34 μm) (Fig. 5e). The throats are 2-120 μm, mainly in 10-30 μm (avg. 9.67 μm) (Fig. 5f). The average pore-throat ratio and average coordination number are 1.28 and 1.31, respectively, indicating a relative good connectivity (Fig. 5d). ...
Real-time imaging reveals distinct pore-scale dynamics during transient and equilibrium subsurface multiphase flow
1
2020
... The movable water in the connected pore-throat system was almost displaced when the charging pressure increased to 0.50 MPa (Fig. 7f), while the water in the tiny intragranular and intercrystalline pores or strongly absorbed to the edges of the connected pores can be hardly displaced by gas even the charging pressure was further raised (Fig. 9c, 9f), which preserved as bound water. The water phase distributes as disperse thin films, while the gas phase shows a concentrated cluster distribution with the maximum gas saturation reaching 95% (Fig. 7l, Fig. 6d), indicating that the gas charging channel expands to the limit and gas transports through stable channels. In this stage, the gas obeys linear flow and increment of the apparent gas permeability decreases before it stabilizes. During the steady-state charging procedure, the gas flow pathway is characterized by a stable and continuous variation, which differs from the intermitted variation of fluid flow channel in the transient flow reported by Spurn et al. through synchronous X-CT scanning during CO2 injection procedure. But it is analogous to the flow channel variation in the steady-state flow in their experiment [52]. ...


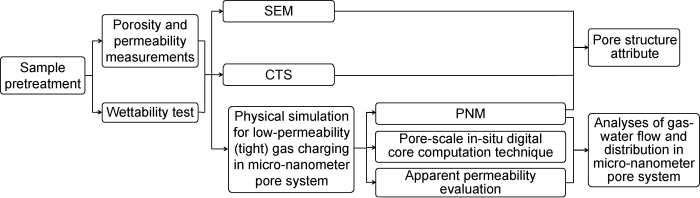
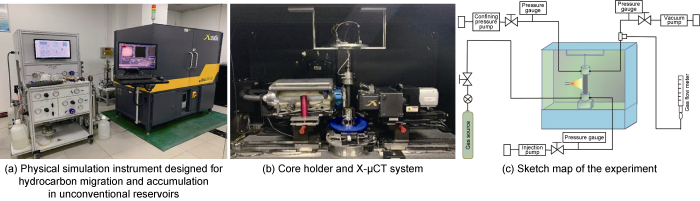
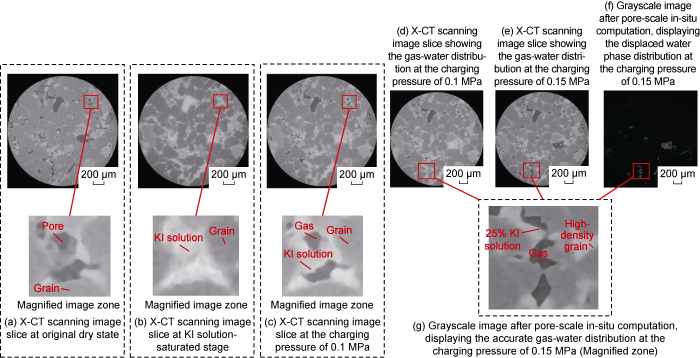
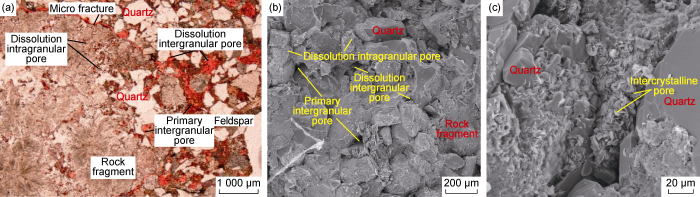
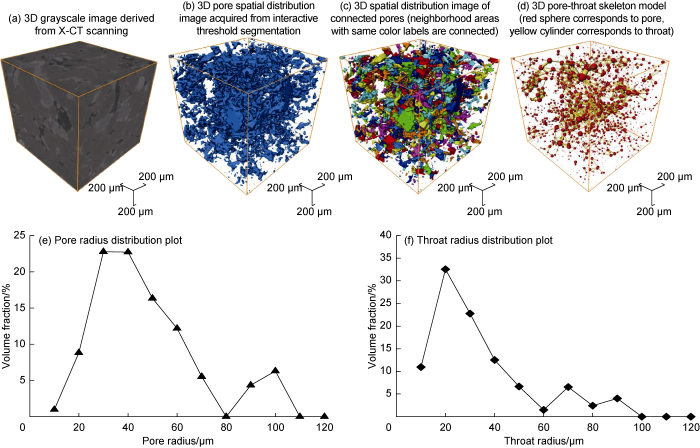
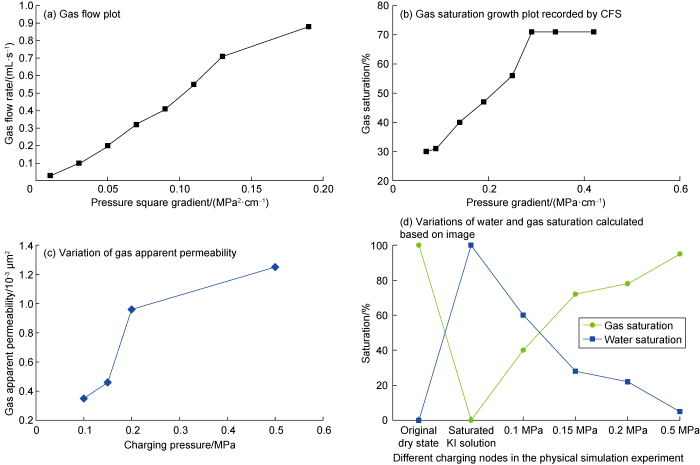
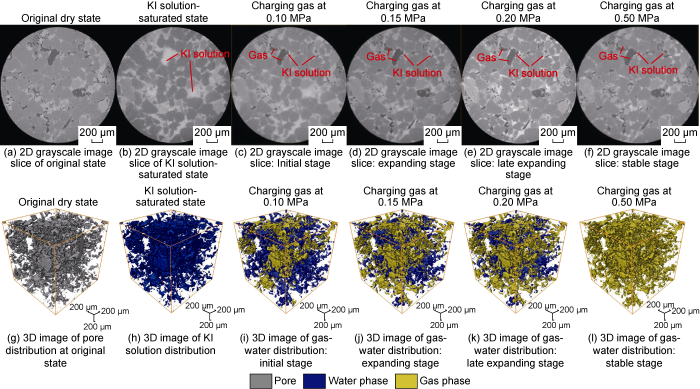
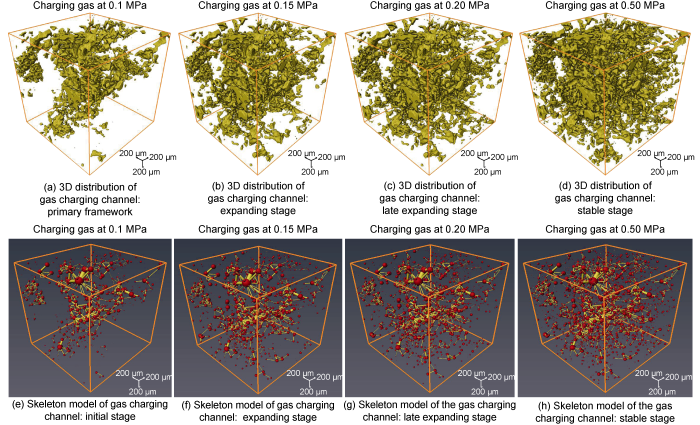

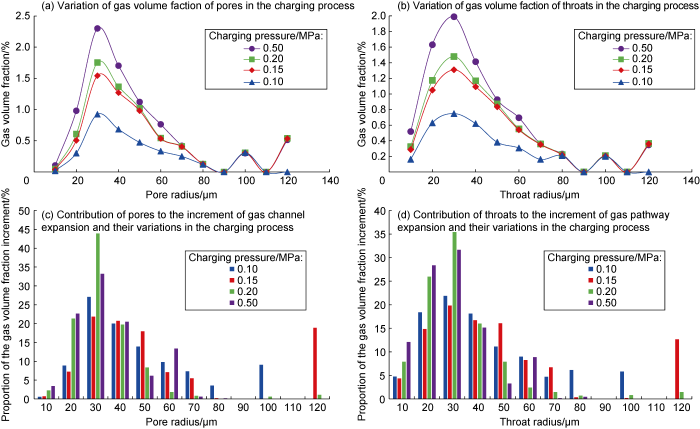
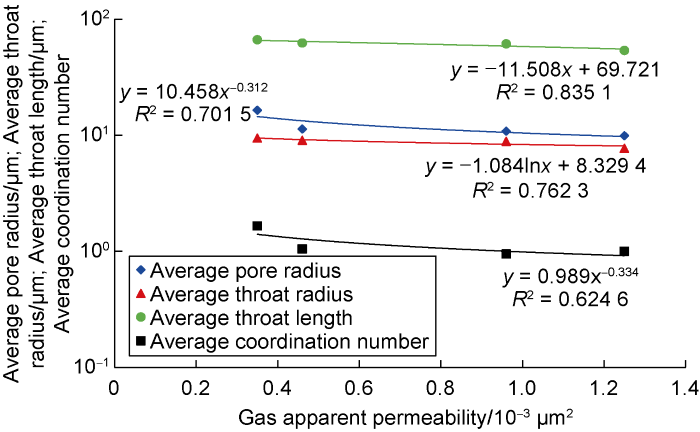
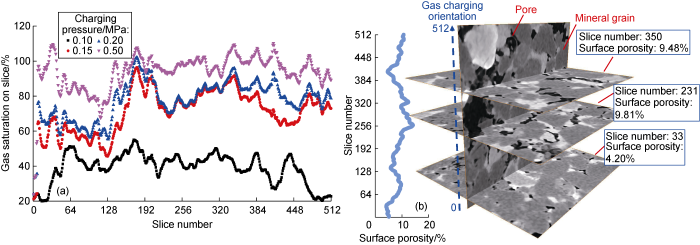
