


Introduction
As early as the 1970s, researchers in the petroleum field have noticed the influence of water phase retention in porous media on the relative permeability of oil phase, and have observed that the presence of bound water in porous media might lead to oil phase flow around, and attribute the water-locking effect to the capillary force between the two phase fluids [1⇓-3]. For fractured reservoirs, the capillary force might change greatly from matrix to fracture, and a large amount of water phase might be trapped in the matrix, preventing the expulsion of oil phase in the matrix, resulting in a significant decrease in the relative permeability of oil phase in the matrix [4-5]. The water locking effect in the actual reservoir is similar to the "end effect" in the core displacement experiment, which is caused by the sharp change of capillary force caused by the change of flow space size. For low permeability tight reservoir developed by fracturing with horizontal well, hydraulic fractures, micron grade natural millimeter seams or large pores and sub-micron small pores exist widely in reservoirs, and capillary force change greatly. Water lock effect is very significant in low permeability tight reservoirs.
Fracturing with horizontal well is a common method for the development of low-permeability tight reservoirs[6]. For fractured horizontal wells with depleted development model, the water phase in the early fracturing fluid will enter the tight matrix, and this water phase in the tight matrix will block the discharge of crude oil in the matrix during oil production, and will reduce the productivity of oil wells[7]. For fractured horizontal wells by huff and puff development, if the injected chemical fluid causes serious water-locking damage in the matrix, the tight matrix will not be able to drain fluid into the fracture to replenish formation energy under the effect of pressure difference, which will also lead to the reduction of well productivity [8-9]. Many scholars worldwide pay attention to not only imbibition displacement performance of chemical fluids, but also drainage aid performance of chemical fluids [10].
At present, surfactant is the most common drainage aiding agent during the production process of low permeability tight reservoir. The existing studies show that the drainage assistance of surfactants is mainly achieved by reducing the interfacial tension and changing the reservoir wettability [2]. But many scholars have different understandings about the selection of surfactant. He et al.[11] have confirmed through laboratory experiments that compared with the surfactants with strong emulsifying capability (forming emulsions with large particle size and difficult to demulsify with oil phase), surfactants with weak emulsifying capability can be more effective in avoiding the blocking of the pore throats by emulsions, thus promoting effectively the production of oil phase from dense matrix. At the same time, the field data from the Eagle Ford and Mississippi Lime shale plays in North America showed that the surfactants with weak emulsification were more favorable for shale production. They concluded that the reason for the poor water-locking effect of surfactants with strong emulsifying capability was that the large particle size emulsions formed by surfactants with strong emulsifying capability would have serious Jamin’s effect in the dense matrix, resulting in the difficulty of crude oil draining from the matrix. However, scholars represented by Bui [12] and Shuler [13] believe that surfactant micellar solution with ultra-low interfacial tension can play a more effective role in drainage assistance, and should be used during the process of stimulation and development of tight reservoirs. In this context, Longoria [14] and Liang et al. [15-17] conducted a synchronous medical CT scan experiment of displacement to compare the drainage aid effect of surfactant micellar solution with low interfacial tension fluid. The results have further confirmed that the surfactant micellar solution is more effective in restoration of the oil phase relative permeability in water -wet and oil-wet dense matrix. As for the aiding mechanism of surfactant micellar solution, Liang et al. [18] studied the backflow characteristics of surfactant micellar solution with a microscopic model of high permeability (permeability of about 1 Darcy) and moisture. However, the study results did not well reveal the mechanism of surfactant micelle solution in assisting drainage of oil-wet tight reservoir. In addition, Luo et al.[19], Zhang et al. [20], Zhang [21] and Liao [22] also studied the wettability of tight reservoir cores from Bakken in the United States, Daqing and Changqing in China, and showed that the tight cores after aging of crude oil were mostly in a state of oil wetness. It is necessary to study the mechanisms of surfactant micellar solution in oil-wet reservoir.
Under this background, in this study, by using the developed pore throat structure micro model of multilevel pore throat system to simulate low permeability reservoirs in the salt water and low salinity surfactant micellar solution respectively, we conducted flowback experiment in core and micro model with different salinity of surfactant micellar solution and the optimal salinity surfactant micellar solution. The process of water phase invasion and oil flowback in submicron pores under the action of surfactant micellar solution was presented intuitively, and the mechanism of surfactant micellar solution improving flowback efficiency in low permeability and tight reservoir was revealed.
1. Experimental materials and method
1.1. Equipment and materials
The experimental equipment used mainly includes: the core flowback experiment power system consists of 260D dual ISCO plunger pumps, and the fracturing sensor system consists of 2 pressure sensors and 2 pressure difference sensors. The microcosmic mode flowback experiment equipment is mainly composed of Leica M165FC fluorescent stereo microscope, Leica DFC450 camera (display 100fps, with a resolution of 2560×1920), Fluigent MFCS-EZ sampling system, Harvard constant flow syringe pump, LabSmith uPS microchannel pressure gauge, etc.
A crude oil from Changqing Oilfield with the viscosity of 9.1 mPa·s (20 °C) was used as oil phase in this study. The experimental water was deionized water. Two commercial surfactants, named olefin sulfonate O332 and anionic surfactant S-13B, were used as the additives. The N-butanol was used as the co-solvent. Potassium chloride (KCl) was used to tune the salinity of the surfactant solutions. Three surfactant solutions with the same contents of surfactant (0.75% S-13B and 0.25% O332) and co-solvent (2% N-butanol) were chosen based on salinity scans.
KCl was used to control the performance of the surfactant micelle solution [23-24]. The salinity scan experiment was carried out under the condition of an oil-water ratio of 3:7. The results are shown in Fig. 1. It can be seen from Fig. 1 that with increase in the concentration of KCl, the oil dissolving capacity of the in-situ micro-emulsion system gradually increased, and the water dissolving capacity gradually decreased. When the mass concentration of KCl reaches 4%, the formed microemulsion was just at the transition stage from Winsor I to Winsor III. Therefore, this salinity is called as the "critical salinity" of the system. When the mass concentration of KCl reached 5.25%, the surfactant had the same oil and water solubility capabilities. At this time, the corresponding microemulsion-oil and microemulsion-water interfacial tension were the same, and reached an ultra-low level (about 0.003 mN/m). This salinity is the "optimum salinity" of the system. On the basis of the previous research, three surfactant micellar solutions were selected for the imbibition experiment study: (1) High interfacial tension (low oil dissolving ability) and low salinity (KCl concentration was 3%)) surfactant micellar solution; (2) "Critical salinity" (KCl concentration was 4%) with low interfacial tension (higher oil dissolving capability); (3) The "optimum salinity" (KCl concentration was 5.25%) surfactant micellar solution with the lowest interfacial tension (highest oil dissolving ability).
Fig. 1.
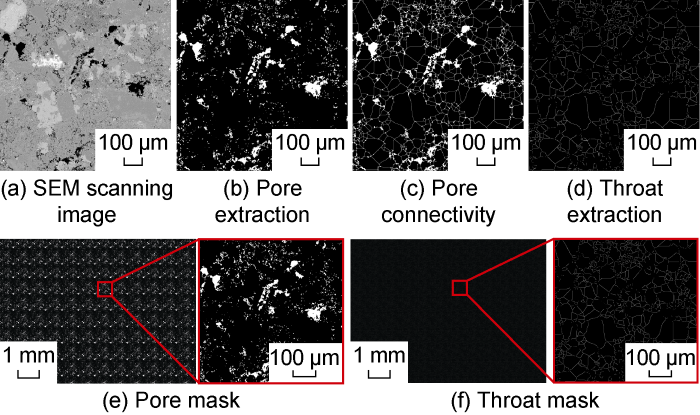
Fig. 1.
Extraction of pore throat unit and design of microscopic model of multi-stage pore throat system.
1.2. Method of core flowback
The core used in this study is the core from Changqing low-permeability-tight oil reservoir. A total of four sets of displacement-flowback experiments were carried out. The experimental scheme is shown in Table 1.
Table 1. Design of core flowback experiment scheme
| Serial number | Diameter/ cm | Length/ cm | Poro- sity/% | Water permeability/ mD | Fluid type |
|---|---|---|---|---|---|
| CF-1 | 2.50 | 4.03 | 16.2 | 5.92 | Brine (4% KCl solution) |
| CF-2 | 2.49 | 4.08 | 17.6 | 3.77 | Low salinity system |
| CF-3 | 2.51 | 4.01 | 14.6 | 4.01 | Critical salinity system |
| CF-4 | 2.52 | 3.98 | 15.6 | 3.53 | Optimal salinity system |
In this study, the end face of the core was used as the fracture-matrix interface, and a low-permeability-tight core flowback experimental device was established by referring to the experimental method of Liang et al. [15]. The specific experimental procedure is as follows:
(1) Saturated oil: under the condition of 20 °C, vacuumize the dried ultra-low permeability core for 24 h, then pressurize it to 35 MPa saturated oil, and maintain the 35 MPa pressure for aging for 7 d.
(2) Displacement: inject water or corresponding chemical agent system from bottom to top at an injection rate of 0.05 mL/min, stop the injection after displacing 5 PV, and monitor the displacement pressure in real time.
(3) Flowback: reverse injection of crude oil from top to bottom at an injection rate of 0.05 mL/min, and stop injection after displacing 5 PV, during which pressure data was collected in real time.
1.3. Microscopic model of multi-stage pore throat system
The microscopic models used to study the mechanisms of chemical flooding to enhance oil recovery are mainly two-dimensional microscopic models. In this microscopic model, the depth of the pore throat channels is uniform, which is quite different from the pore throat channels with continuous change in size in real cores [25]. Due to the uniform depth of the pore-throat channel, the capillary force of the two-dimensional microscopic model decreased greatly. The special effects of fluid in the three-dimensional pore-throat structure, such as capillary suction, Haynes step, and capillary jamming, were all weakened. Since the focus of this study is to study the role of surfactant micelle solution in eliminating water lock in low-permeability tight oil reservoirs, capillary force has played an important role during this process. Therefore, it is necessary to design a microscopic model that can truly reflect the characteristics of the capillary force of the reservoir to carry out the research work of this study [26⇓-28]. A microscopic model which can characterize the multi-stage pore-throat system of ultra-low permeability reservoirs was designed. The design process of the micro model is as follows:
(1) Using the FIB-SEM scanning image to extract the basic pattern of micron-level pores, and using the watershed algorithm of Image J software to randomly add throats between the pores to make the pores connected, and finally get the basic pores and throat unit images, as shown in the Fig. 1a-1d.
(2) According to the area of the microscope visualization area, the overall pattern of the model is constructed by the method of repeated image stitching, and finally the pore mask and throat mask are obtained, as shown in Fig. 1e-1f.
According to the above mask, the microscopic model of the multi-stage pore throat system was constructed with the method of multiple engraving [29], as shown in Fig. 2. The length of the microscopic model was about 9 mm and the width was about 7 mm. Under the effect of microscope stereo imaging, it can be seen intuitively that there is a significant size difference between pores and throats. This model can more truly reflect the characteristics of the multi-stage pore throat structure of low-permeability tight reservoirs. The depth measurement of the pore channel and throat section of the micro model was carried out with a step meter. Combined with the measured results of the microscope, the parameters of each channel in the microscopic model were determined. The average width of the pore channel was 50 μm, and the average depth was 20 μm. The average width of the throat was 3 μm, and the average depth was 500 nm. According to the semicircular shape of the channel section of the micro model, it was calculated that the equivalent radius of the pore channel of the model was about 18 μm, and the equivalent radius of the throat was 691 nm. The measured water permeability of this microscopic model was about 3.5×10⁻³ μm2.
Fig. 2.

Fig. 2.
Microscopic model of multi-stage pore throat system.
1.4. Microscopic model of flowback experiment
Before the microscopic model flowback experiment, the microscopic channel was soaked in an ethanol solution of 1% trimethylchlorosilane to change the model's wettability from water to oily.
By referring to the core experiment scheme, 4 sets of parallel micro model flowback experiments were design. The micro model flowback experiment process is as follows:
(1) Saturated oil: inject crude oil into the dried model from the outlet at a pressure of 0.1 MPa. After the crude oil flows from the inlet of the model, the injection pressure was increased to 0.7 MPa to discharge all the bubbles in the model.
(2) Displacement: inject water or the corresponding chemical agent system from the inlet at an injection rate of 0.1 μL/min, and stop the injection after displacing 5 PV. During this period, images and videos were collected regularly, and the displacement pressure was monitored in real time.
(3) Flowback: inject crude oil along the outlet at an injection rate of 0.1 μL/min, and stop the injection after displacing 5 PV. During this period, images, videos and flowback pressure data were collected in real time.
(4) Model cleaning: after each experiment, the micro - channels were washed repeatedly with 5% hydrochloric acid solution, 2% NaOH solution, ethanol and deionized water, and the microscopic model was dried at 120 °C.
2. Core flowback experimental results and discussion
2.1. Salt water
First, the brine displacement and crude oil flowback experiment of the core after saturated oil (Scheme CF-1) was carried out, which was used as the benchmark for the experimental research in this section. The experimental results are shown in Fig. 3. The peak water drive pressure difference was 1.79 MPa, and the water drive pressure difference gradually stabilized and reached 1.03 MPa after water was seen at the outlet. During the flowback process, due to the coexistence of oil and water in the core at the early stage of water flooding and the high viscosity of crude oil, the flowback pressure of crude oil was relatively high, with a peak pressure difference reaching 22.57 MPa. After the continuous flow channels were formed, the flow-back pressure difference stabilized gradually, about 9.57 MPa. It can be seen from the above results that the flowback resistance of crude oil is relatively high, and most of the brine is retained in the core, forming a strong water lock effect.
Fig. 3.
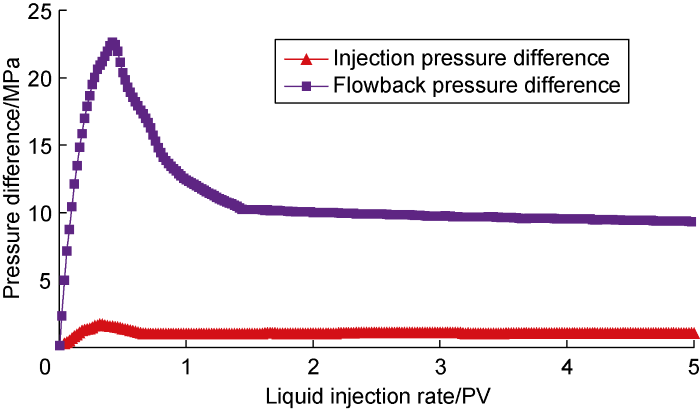
Fig. 3.
Experimental results for Scheme CF-1.
2.2. Low-salinity surfactant micellar solution
Fig. 4 shows the experimental results of low-salinity system displacement and crude oil flowback (Scheme CF-2). The low-salinity system has lower oil-dissolving capability, slightly higher interfacial tension, and stronger wetting reversal capability. The experimental results can represent the displacement-flowback effect of conventional surfactants with similar performance. From the figure that compared with the brine displacement, the injection pressure of the low-salinity system is lower than that of the brine. The peak pressure difference was 0.99 MPa. After the displacement, the crude oil recovery was 59.14%, which was 0.73 PV after the displacement. Later, the injection pressure difference stabilized, about 0.66 MPa. During this period, part of the crude oil was recovered gradually when the chemical fluids were washed away, resulting in fluctuation in the injection pressure. At the same time, the flowback pressure of crude oil also dropped significantly, with a peak pressure difference of about 11.60 MPa. After the flowback pressure of crude oil reached its peak, the flowback pressure also fluctuated and declined. This means that part of the remaining water phase can be recovered during the flowback of crude oil, and the water content will fluctuate. In the end, the flowback pressure difference after 5 PV of crude oil flowback was basically stable at about 5.57 MPa.
Fig. 4.
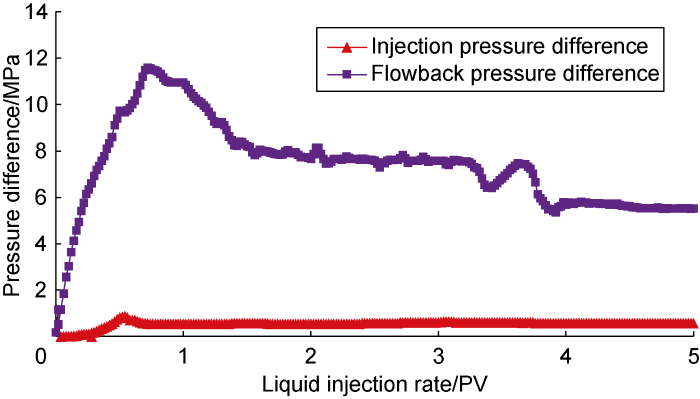
Fig. 4.
Experimental results for Scheme CF-2.
2.3. Critical salinity surfactant micellar solution
Fig. 5 shows the experimental results of displacement and flowback of the critical salinity system (CF-3). Compared with the low-salinity system, the critical salinity system has higher oil solubility and lower interfacial tension, and is more inclined to interact with crude oil, forming a lower-phase microemulsion with a lower viscosity. It can be seen from the figure that, compared with the displacement of brine and low-salinity systems, the injection pressure of the critical salinity system was further reduced, and the peak pressure difference was 0.77 MPa. After the displacement of 1.71 PV, the injection pressure difference tended to be stable, approximately 0.33 MPa. At the same time, the crude oil flowback pressure also dropped significantly, with a peak pressure difference of about 8.80 MPa. After the crude oil flowback was 1.11 PV, the crude oil flowback pressure stabilized, and the final flowback pressure difference was about 4.10 MPa.
Fig. 5.
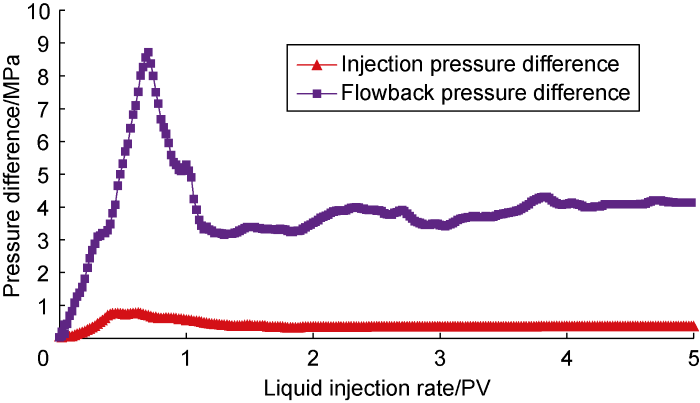
Fig. 5.
Experimental results for Scheme CF-3.
2.4. Optimal salinity surfactant micellar solution
Fig. 6 shows the displacement and experiment results of flowback for the optimal salinity system (Scheme CF-4). Compared with low salinity and critical salinity systems, the optimal salinity system has the highest oil dissolving capability and ultra-low interfacial tension. It can form Winsor III microemulsion with crude oil, and the formed Winsor III microemulsion is not easy to be diluted and miscible by the optimal salinity system. It can be seen from the figure that, the optimal salinity system has the lowest injection pressure, with a peak pressure of about 0.86 MPa. After 1.53 PV was displaced, the injection pressure tended to be stable, about 0.41 MPa. At the same time, the flowback pressure of crude oil after the optimal salinity system penetrated into the core was slightly higher than that of the critical salinity system, and the peak pressure was about 10.11 MPa. After 1.01 PV of crude oil flowback, the flowback pressure of crude oil stabilized, and the final flowback pressure was about 3.93 MPa.
Fig. 6.
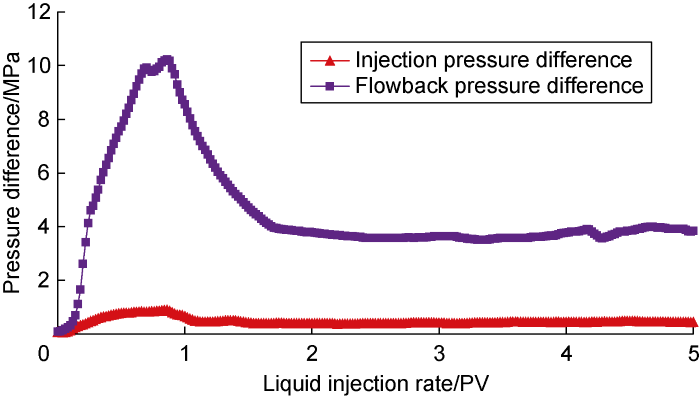
Fig. 6.
Experimental results for Scheme CF-4.
In summary, the following conclusions have been drawn. (1) The low-permeability reservoirs have small pore throats, with serious heterogeneity. After invasion of salt water, extremely strong water-locking effect increases greatly the flowback resistance, making the flowback of the crude oil difficult, which is consistent with the research results of Liang et al. [9]. Under the action of the surfactant micellar solution to reduce the interfacial tension, the water phase has strong injectability, and the flowback resistance of crude oil after it penetrates into the core is also much lower than salt water, but the performance of different types of surfactant micellar solutions is quite different. (2) Through the above-mentioned experiments, this study has further clarified that the low salinity of Winsor I microemulsion is always formed with crude oil under different oil-water ratios. The system has weak oil dissolving capability, high interfacial tension, and strong wetting reversal capability, but its invasion and flowback process is similar to the effect of conventional surfactant systems. The flowback resistance is high, and the oil dissolving rate is high. The critical salinity and the injection pressure and flowback pressure of the optimal salinity system are also similar.
Through the above-mentioned core experiments, although the assisting effects of different types of chemical fluids have been clarified, the reasons for the different assisting effects under the action of different chemical fluids are still unclear. In order to further reveal the internal mechanism of improving the flowback efficiency by the surfactant micellar solution in low-permeability- tight reservoirs, and to further clarify the reasons for the difference in the effects of different types of chemical fluids, it is necessary to carry out more intuitive microscopic visualization experiments.
3. Microscopic model flowback experiment results and discussion
3.1. The water phase invasion process
Four groups of different types of chemical fluid invasion experiments were carried out using the oil-wet matrix microscopic model. The overall and partial images of the model before and after water invasion are shown in Fig. 7. Three types of surfactant micellar solutions have a higher degree of invasion.
Fig. 7.

Fig. 7.
Images before and after water invasion for Schemes FA-1, FA-2, FA-3 and FA-4.
In order to further reveal the water invasion mechanism in the oil-wet compact matrix under the action of different types of chemical fluids, the microscopic water invasion dynamics in each group of experiments were analyzed. Fig. 8 shows the microscopic dynamics of salt water invasion into the front edge of the scheme FA-1. In the oil-wet microscopic model, the salt water is used as the non-wetting phase. During the process of passing through the pore throat, the submicron throat blocking effect of the channel on the salt water is significant, and the salt water basically enters the untouched pores in the form of a single droplet (that is, in the form of a Haynes step [24]). This kind of droplet flow will cause a very strong Jamin effect and form a great capillary resistance, resulting in only part of the pores being passively used in the water invasion process. It can also be seen from the partially enlarged microscopic remaining oil occurrence state image shown in Fig. 9 that the invaded brine mainly occupies the macropores. This occurrence state is consistent with the occurrence state of microscopic remaining oil after water flooding in oil-wet porous media proposed by Yu et al. [29].
Fig. 8.

Fig. 8.
Microscopic dynamics of the brine invasion front for Scheme FA-1.
Fig. 9.
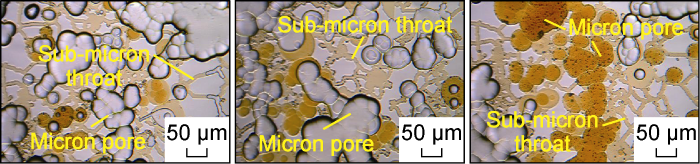
Fig. 9.
Partially enlarged image of the microscopic remaining oil occurrence state for Scheme FA-1.
Fig. 10 shows the microscopic dynamic image of the invasion front of the low-salinity system in the Scheme FA-2. At the initial stage of the invasion, under the effect of the sufficient shear of the micropore-submicron throat and the chemical fluid to reduce the interfacial tension, a large number of black bands formed by the aggregation of small droplets appeared at the front edge of the invasion. Compared with the water invasion process, these droplets have smaller size and stronger flow capacity, and can pass through the sub-micron throat more smoothly, so that the micron-scale pores and sub-micron-scale throat that invade the front edge are more effectively used. This process is similar to the typical surfactant solution flooding process mentioned by Yu et al. [25,29]. During the later stage of the invasion, the dominant water channels have been formed, but under the condition of low interfacial tension, some of the remaining oil will be stripped off to form emulsion droplets, and some very small emulsion droplets will be produced quickly along the water channeling channel. Because most of the chemical fluid flows along the dominant channel at this time, the mutual shearing effect between the crude oil and the chemical fluid is weak, and larger emulsion droplets will form in some places, while the large particle size emulsion droplets cannot pass through the sub-micron throat and are trapped in the pores, as shown in Fig. 11. From the partially enlarged image (Fig. 12) after the end of the water invasion, due to the strong wetting and reversal capability of the low-salinity system, only a small amount of remaining oil is retained in a small part of the sub-micron throat, and a small amount of remaining oil is mainly retained in the micron-scale pores. The oil film that is tightly attached to the pore wall and the oil droplets that cannot pass through the micron throat smoothly by the Injamin effect are retained in micron-scale pores.
Fig. 10.
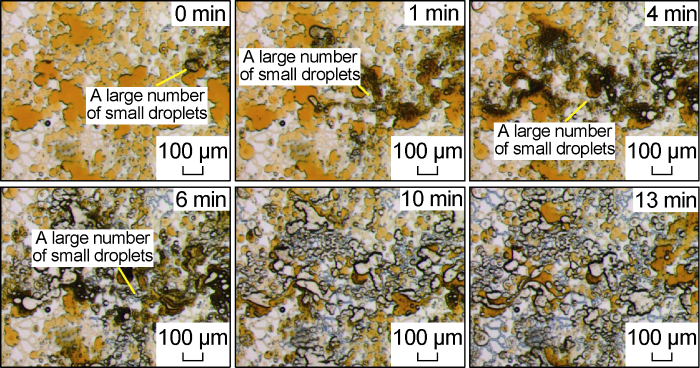
Fig. 10.
Microscopic dynamics of the invasion front of the low salinity system for Scheme FA-2.
Fig. 11.
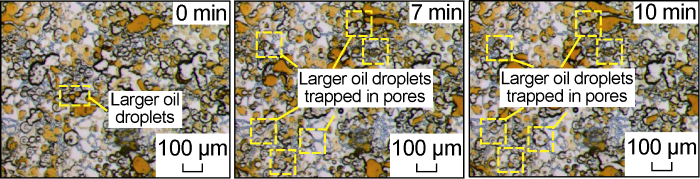
Fig. 11.
Microscopic dynamics of the invasion rear edge of the low-salinity system for Scheme FA-2.
Fig. 12.
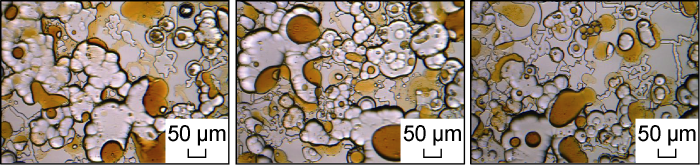
Fig. 12.
Locally enlarged microscopic image of remaining oil occurrence state for Scheme FA-2.
Fig. 13 shows the microscopic dynamic image of the critical salinity system invading the front edge under Scheme FA-3. Compared with the low-salinity system, the system has a stronger miscibility and diffusion effect. The invasion front has a darker area formed by the water droplets entering the oil phase and being miscible with the oil phase. This is similar to phenomena observed by Tagavifar et al. [30] in the study of the local equilibrium theory of microemulsions. After being fully miscible, a small amount of Winsor III type microe-mulsion was formed at the front edge, but this system is more inclined to form Winsor I type microemulsion when the surfactant micelle solution is excessive. Therefore, the Winsor III type microemulsion formed at the front edge is unstable, and it is easily miscible and diluted by excess water during the flow process. At the rear edge of the displacement (Fig. 14), the subsequently driven crude oil will form a lighter color (lower oil solubility) Winsor III microemulsion band after being fully mixed with the surfactant micellar solution. This part of the Winsor III type microemulsion exhibits the characteristics of "same-channel flow" with the water phase during the flow process. During the seepage process, there will be no more jams, and can be extracted with the flow of the water phase. This is consistent with the phenomenon observed by Xu et al. [26] in the 2.5D microscopic model. Fig. 15 shows a partial enlarged image after the end of the water invasion. It can be seen from the figure that, except for a small part of the area not affected by the water invasion, after long-term miscibility, almost all the crude oil that has been affected in the pores has been recovered.
Fig. 13.
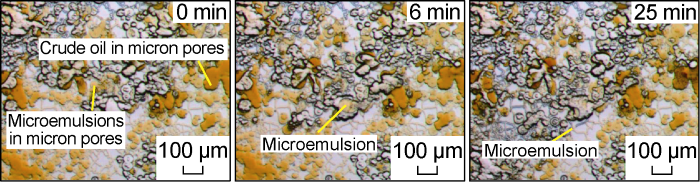
Fig. 13.
Microscopic dynamics of the invasion front of critical salinity system for Scheme FA-3.
Fig. 14.
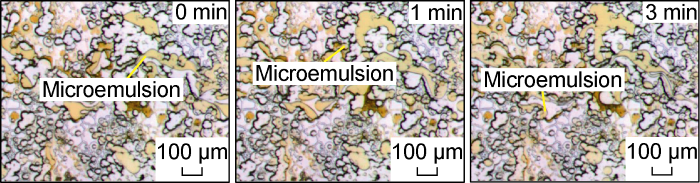
Fig. 14.
Microscopic dynamics of the invasion rear edge of the critical salinity system for Scheme FA-3.
Fig. 15.
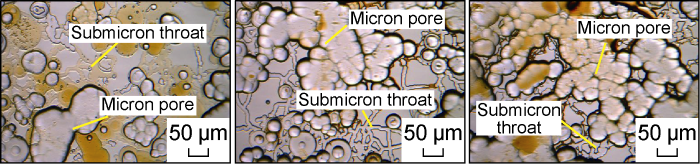
Fig. 15.
Locally enlarged microscopic image of remaining oil occurrence state for Scheme FA-3.
Fig. 16 shows the water invasion dynamics of the optimal salinity system. Compared with Fig. 13, it can be seen that compared with the critical salinity system, the water invasion effect of this system is similar to the former, but its interfacial tension with crude oil is further reduced, and the water invasion front is almost nonexistent caused by pore throat jamming. The resulting droplet flow phenomenon, and a darker color (higher oil solubility) Winsor III type microe-mulsion appeared, which also showed the characteristics of "co-flowing" with crude oil. From the partial enlarged picture of the microscopic model after water invasion shown in Fig. 17, it can also be seen that under the action of the optimal salinity system, only part of the pore throat edge has remaining oil droplets.
Fig. 16.
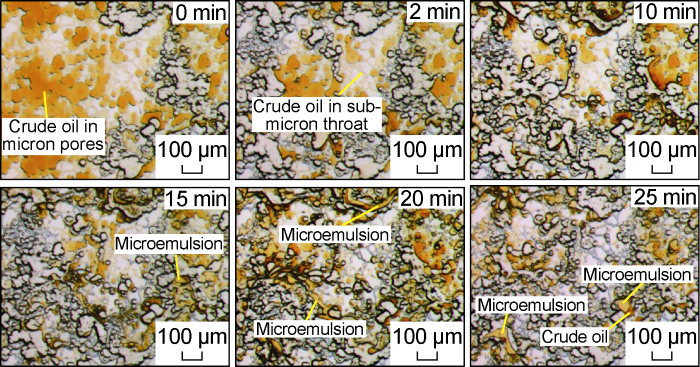
Fig. 16.
Microscopic dynamics of the invasion front of optimal salinity system for Scheme FA-4.
Fig. 17.
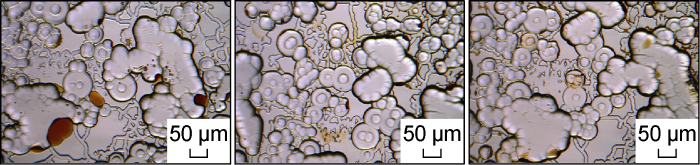
Fig. 17.
Locally enlarged microscopic image of the remaining oil occurrence state for Scheme FA-4.
Through the above-mentioned visualization water invasion experiment with microscopic model, the oil displacement efficiency of brine, low salinity, critical salinity and optimal salinity systems, especially the displacement efficiency of submicron throats, has been made clear. Consistent with the core experiment results, the critical salinity and optimal salinity systems can form a microe -mulsion with the crude oil in the sub-micron throat due to their strong diffusion and miscibility system, weakening effectively the water phase between the micron -level pores and the sub-micron-level throat. The capillary snap off in the flow process improved the degree of crude oil recovery. This conclusion has confirmed the hypothesis that the surfactant micelle solution is miscible with crude oil in the core experiment research proposed by Liang et al.[9]. The phase interaction can form the dynamic phase behavior of the microemulsion. The huge capillary resistance produced by the sub-micron throat in the oil-wet model led to the phenomenon of droplet flow due to the Haynes step [24] during the salt water invasion process, and the range was small. The low-salinity system was similar with the conventional surfactant system. Although a larger range can be achieved by reversing the wetting and reducing the interfacial tension, the emulsion droplets formed under low interfacial tension are still difficult to pass through the sub-micron throat and stay in the pores in a large amount, decreasing the oil displacement efficiency.
3.2. Study on the flowback process of crude oil
After completion of the displacement experiment, we conducted the crude oil flowback experiment in the microscopic model of the oil-wet multi-stage pore throat system. Fig. 18 shows the experimental results of 4 sets of crude oil flowback experiments. The results of the 4 sets of microscopic experiments are also consistent with the core flowback experiment results. After the invasion of the salt water, only part of the pores can become the flow channels for the subsequent crude oil flowback. Under the action of the three chemical fluids, large part of the pores can become crude oil flowback channels.
Fig. 18.

Fig. 18.
Images of flowback process in Schemes FA-1, FA-2, FA-3 and FA-4.
In order to further reveal the internal reasons for the large difference in the flowback efficiency in the oil-wet tight matrix under the action of different types of fluids, the microscopic dynamics of crude oil flowback in each group of experiments were further analyzed.
Fig. 19 shows the micro-dynamics of crude oil flowback after brine invasion in scenario FA-1. As can be seen from this figure, crude oil flowback mainly includes two processes. (1) Water drainage: this process is a process in which crude oil drives the water phase in the brine invasion area to migrate to the outlet, corresponding to the process in which the relative permeability of oil phase increases with the drainage of brine in the flowback experiment of Liang et al. [7]. In the oil-wet medium, most of the brine invading the matrix occurs in the center of the micron-scale pores, while the pore edges and sub-micron- scale throats are mostly occupied by the oil phase. This leads to the fact that during the process of drainage, brine, as a non-wetting phase, is again subjected to severe pore-throat blocking, forming a large number of small droplets, resulting in a sharp rise in discharge pressure. (2) Oil discharge: this process is a process in which crude oil is continuously produced after forming a continuous flow channel, corresponding to the stage when the relative permeability of oil phase in the flowback experiment of Liang et al. [7] entered the “plateau” period. During the process of water invasion and drainage, a large number of water droplets occupy the center of the pores, and the crude oil as the wetting phase can only flow along the edges of the pores during the flowback process. During this process, the dominant seepage channel for oil phase flowback has been formed. In the whole model, the dominant seepage channel for oil phase flowback is very few, resulting in high oil discharge pressure. It can also be seen from Fig. 20 that a large number of water droplets remain in the pores in a dispersed form.
Fig. 19.
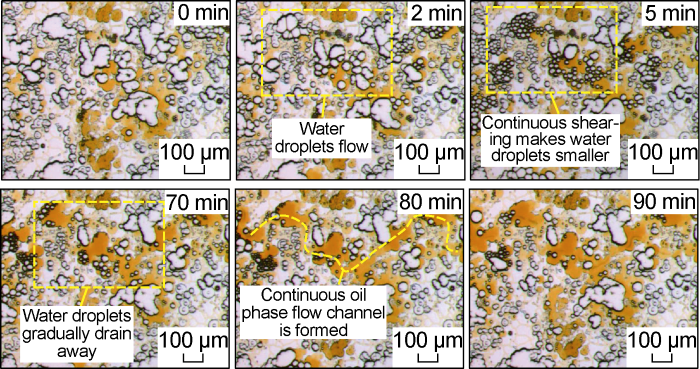
Fig. 19.
Microscopic dynamics of crude oil flowback after brine invasion in Scheme FA-1.
Fig. 20.
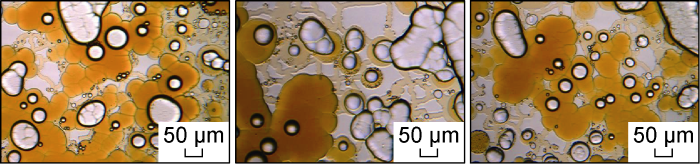
Fig. 20.
Microscopic image of remaining oil occurrence state at the end of crude oil flowback in Scheme FA-1.
Fig. 21 shows the micro-dynamics of crude oil flowback after the invasion of the low salinity system in Scheme FA-2. It can be seen that due to the effect of wetting inversion of the low salinity system, the oil-water flow characteristics of the microscopic model are consistent with those described by Yu et al. [29]. At the flowback front, part of the crude oil is stuck, and oil droplets flow. Some oil droplets with much smaller size than the pore throat size can be discharged smoothly, while the oil droplets with larger size are stuck at the throat and cause the increase of the flowback pressure. This phenomenon has further confirmed the conclusion proposed by He et al. [11] that the surfactant solution with weak emulsification effect is more favorable for the flowback of crude oil than the surfactant solution with strong emulsification effect. As the oil draining process continues, the water retained in the micron-scale pores is continuously reduced. Finally, under the action of the carrying and squeezing of crude oil, some residual surfactant solution wraps a large number of small oil droplets, and the O/W/O form retention in the center of the pores, as shown in Fig. 22.
Fig. 21.

Fig. 21.
Microscopic dynamics of crude oil flowback after the invasion of low-salinity system in Scheme FA-2.
Fig. 22.
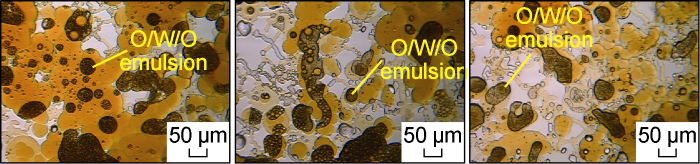
Fig. 22.
Microscopic dynamics of remaining oil occurrence state after crude oil flowback in Scheme FA-2.
Fig. 23 shows the micro-dynamics of crude oil flowback after invasion of the critical salinity system in Scheme FA-3. Under the action of this system, the oil phase of the flowback front is more likely to be miscible with the surfactant micelle solution, and the snapping effect of the submicron throat will no longer lead to the appearance of the front. At the early stage of flowback, the submicron throats are basically occupied by the oil phase. And as shown in Fig. 24, a small part of the water droplets remaining in the pores will also be gradually produced with the flow field disturbance of the oil flowback. This shows that the oil phase flowback process after the invasion of the critical salinity surfactant solution is different from that of the conventional surfactant solution. The early stage of the flowback is the formation of a microemulsion and its dynamic phase transition process under flow conditions [23]. The magnified image of the microscopic model after the flowback is shown in Fig. 25. The water phase trapped in the microscopic model is mostly distributed in the form of small water droplets at the edge of the pores.
Fig. 23.

Fig. 23.
Microscopic dynamics of crude oil flowback after invasion of critical salinity system in Scheme FA-3.
Fig. 24.
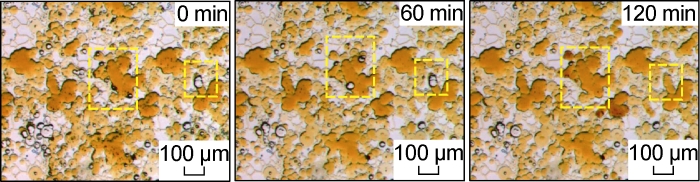
Fig. 24.
Dynamics of gradual discharge of water phase at the rear edge of crude oil flowback in Scheme FA-3.
Fig. 25.
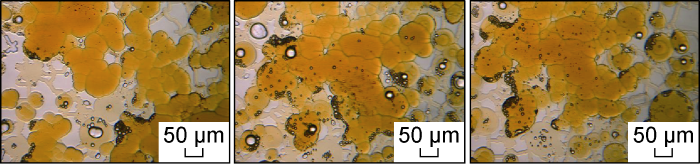
Fig. 25.
Microscopic remaining oil occurrence state after crude oil flowback in Scheme FA-3.
Fig. 26 shows the micro-dynamics of crude oil flowback after invasion of the optimal salinity system in Scenario FA-4. Under the condition that the interfacial tension is further reduced, the crude oil is more likely to enter the sub-micron throat, the water phase is discharged, and the flow channel of the oil phase is re-established. The micro-dynamics are similar. It can also be seen from the magnified image of the microscopic model after the flowback (Fig. 27) that the water phase retained in the microscopic model is also distributed in the form of small water droplets at the pore edge.
Fig. 26.

Fig. 26.
Microscopic dynamics of crude oil flowback after invasion of optimal salinity system in Scheme FA-4.
Fig. 27.

Fig. 27.
Microscopic remaining oil occurrence state after crude oil flowback in Scheme FA-4.
For the problem that different types of surfactant micellar solutions promote crude oil flowback, in previous studies [2,4,16⇓-18], Winsor I surfactant micellar solutions and Winsor III with "optimal salinity" type surfactant micellar solution were used mostly. However, studies have also shown that surfactant micellar solutions with a salinity slightly below the "optimal salinity" are more favorable for improving oil recovery. In this study, by selecting three surfactant micellar solutions with different salinities, the drainage-aiding effects of different types of surfactant micellar solutions were further compared through microscopic visualization experiments, and the drainage-aiding effects have been made clear. In addition, through the reasonable design of the size of the microscopic model, a relatively complete image and local part acquisition of the model have been carried out, and a more complete description of the flowback process and mechanism of crude oil have been conducted. Consistent with the core experimental results, due to the low degree of production of sub-micron throats during the brine invasion process, during the crude oil flowback process after brine invasion, there is still no brine retention in most of the sub-micron throats, but only a small part. Pores can become the circulation channels for crude oil flowback, the water lock effect is serious, and the flowback resistance is large. The injection of surfactant micelle solution can effectively reduce the flowback pressure of crude oil, and realize the discharge of most of the invaded water phase. However, the low salinity system has poor miscibility with crude oil. After invasion, crude oil first flows back in the form of oil droplets. Due to the influence of the Jiamin effect, a large flowback resistance occurred. The water phase in the channel cannot be drained. The optimal salinity and critical salinity system has strong miscibility with crude oil, and micro-emulsion can be formed at the interface of oil phase and water phase through miscibility, avoiding the formation of large oil droplets that block the pore throat, realizing the invasion of water phase and efficient flowback. This result further correlates the flowback effect of the surfactant micelle solution with the experimental results of its static phase behavior: (1) The flowback process of crude oil under the action of the surfactant micelle solution is the phase transition process of the microemulsion; (2) The salinity can control the formation of microemulsion and the phase transition process during the flowback process by controlling the oil dissolution rate of the surfactant micelle solution, and finally affects the flowback effect.
4. Conclusions
The surfactant micellar solution has strong inject capability, and can improve the oil displacement efficiency. In addition, the flowback efficiency of crude oil after invasion into the core is also much higher than that of brine, but the performance of different types of surfactant micellar solutions is quite different.
The core experimental results indicate that the optimal salinity surfactant micellar solution has the highest oil displacement efficiency, and can be used as the oil displacement system for enhanced oil recovery by chemical flooding, and the critical salinity surfactant micellar solution has the highest oil displacement efficiency and high flowback efficiency, and can be selected as a drainage aid for low-permeability-tight oil reservoirs.
The microscopic model experimental results are consistent with the core results, proving that the microscopic model of the multi-level pore-throat system used in this study can be used to characterize effectively the pore-throat structure of ultra-low permeability reservoirs. The results of microscopic visualization experiments have further proved that a large number of small droplets might be generated during the displacement and flowback process between micron-scale pores and sub-micron-scale throats in brine and low-salinity surfactant micellar solutions. When the droplet passes through the pore throat, a huge seepage resistance will be generated due to the Jamin effect, which will lead to the increase of the displacement and flowback pressure and the decrease of the oil displacement and flowback efficiency. The critical salinity and optimal salinity surfactant micelle solution will not produce a large number of small droplets that hinder the flow, which can reduce effectively the seepage resistance, and can improve the oil displacement and flowback efficiency.
Reference
Factors affecting water blocking and gas flow from hydraulically fractured gas wells
DOI:10.2118/7561-PA URL [Cited within: 1]
Gas recovery from tight sands: Impact of capillarity
DOI:10.2118/119585-PA URL [Cited within: 3]
Capillary wicking in gas wells
DOI:10.2118/103229-PA URL [Cited within: 1]
Impairment mechanisms in Vicksburg tight gas sands
Cleanup of water blocks in depleted low-permeability reservoirs
Research progress on tight oil exploration in China
Water blocking mechanism of low-permeability reservoirs and screening principle of flowback surfactants
Mechanisms of shale hydration and water block removal
Evaluation of wettability alteration and IFT reduction on mitigating water blocking for low-permeability oil-wet rocks after hydraulic fracturing
DOI:10.1016/j.fuel.2017.08.029 URL [Cited within: 3]
Critical review of field EOR projects in shale and tight reservoirs
DOI:10.1016/j.petrol.2017.09.022 URL [Cited within: 1]
Evaluation of surfactant performance in fracturing fluids for enhanced well productivity in unconventional reservoirs using Rock-on-a-Chip approach
DOI:10.1016/j.petrol.2015.10.008 URL [Cited within: 2]
Insights into mobilization of shale oil by use of microemulsion
DOI:10.2118/178630-PA URL [Cited within: 1]
Surfactant huff-n-puff application potentials for unconventional reservoirs
Water blocks in tight formations: The role of matrix/fracture interaction in hydrocarbon-permeability reduction and its implications in the use of enhanced oil recovery techniques
DOI:10.2118/185962-PA URL [Cited within: 1]
Study on fluid-rock interaction and reuse of flowback fluid for gel fracturing in desert area
Enhancing hydrocarbon permeability after hydraulic fracturing: Laboratory evaluations of shut-ins and surfactant additives
DOI:10.2118/175101-PA URL [Cited within: 1]
Computed-tomography measurements of water block in low-permeability rocks: Scaling and remedying production impairment
DOI:10.2118/189445-PA URL [Cited within: 2]
Evaluating the performance of surfactants in enhancing flowback and permeability after hydraulic fracturing through a microfluidic model
DOI:10.2118/199346-PA URL [Cited within: 2]
Underlying mechanisms of tight reservoir wettability and its alteration
Evaluation of relative permeability of a tight oil formation in Daqing Oilfield
The wettability in tight sandstone formations and its effects on oil migration and accumulation
The wettability of tight sandstone and its significance of hydrocarbon accumulation of Yanchang Formation, Ordos Basin
Visualization the surfactant imbibition at pore scale by using of fractured micromodels
Experimental research on imbibition mechanisms of fractured reservoirs by microfluidic chips
Formation and flow behaviors of in situ emulsions in heavy oil reservoirs
DOI:10.1021/acs.energyfuels.9b00154 URL [Cited within: 2]
A 2.5-D glass micromodel for investigation of multi-phase flow in porous media
DOI:10.1039/C6LC01476C URL [Cited within: 2]
Features and imbibition mechanisms of Winsor I type surfactant solution in oil-wet porous media
Application of microfluidic models in oil and gas field development
New insights into flow physics in the EOR process based on 2.5D reservoir micromodels
DOI:10.1016/j.petrol.2019.106214 URL [Cited within: 4]
Spontaneous and flow- driven interfacial phase change: Dynamics of microemulsion formation at the pore scale
DOI:10.1021/acs.langmuir.7b02856 URL [Cited within: 1]
