


Introduction
A microfracture is defined as a fracture or crack with limited length and width, typically 1 mm and less than 0.1 mm, respectively [1-2]. Due to the minuscule presence, observation of microfractures can only be possible by using special magnifying tools. In contrast, macrofractures are cracks with larger sizes and can be seen by bare eyes. Microfractures are results of local stress change that are caused by either solely or combination of geotectonics, diagenesis, fast release of formation fluids, and overpressure [1⇓⇓-4]. When a relatively high stress is imposed on a body of rock, theoretically, a brittle rock is easier to fracture than a ductile one. Other factors that may contribute to microfractures development include, but not limited to mineral composition, rock fabric, grain size, cements, hardness, structural position, and stress state[1⇓⇓⇓-5]. There are, in general, three types of microfractures with respect to its position relative to rock grains, including grain boundary, intragranular or intracrystalline, and intergranular or intercrystalline microfractures[6]. A grain boundary microfracture is one that exists (partly) at the edge of a grain or in contact between two grains. An intragranular or intracrystalline micro-fracture occurs within a grain or crystal. An intergranular or intercrystalline microfracture develops extending from part of a grain or crystal boundary to another or other grain boundaries, sometimes referred to as grain-edges microfracture [5]. The most common, yet inexpensive method is using thin section of rock sample and conventional optic microscopes [5,7⇓ -9]. Several sophisticated techniques, such as cathodoluminescence microscopy [10], photo-multiplier cathodoluminescence [11], and SEM-based cathodoluminescence (CL) [12] have also been employed to obtain higher resolution images to enable highly detailed mapping of microfractures.
Current practice on the studies of microfractures is mostly focused on their direction, distribution, intensity, diagenesis history and contribution to hydraulic conductivity. Ezati et al. attempt to identify the distribution of microfractures in a carbonate reservoir based on rock type, but this technique is not effective because a Hydraulic Flow Unit (HFU) can cover rock samples with a very wide range of fluid transport properties, making a difficulty of determining the cut-off porosity for this HFU[13]. When the porosity of the rock with micro-fractures is greater than the cut-off porosity, it means that the micro-fractures have little or no effect on the conductivity and permeability of the rock. Some micro-fractures in rock are in a closed state, and the conductivity and permeability of the reservoir can be significantly improved only when the open micro-fractures construct a network among them or with the pores of the rock.
This paper describes the identification and characterization of microfractures in carbonate rock samples obtained from two different reservoirs. In accordance to various features of microfractures that may or may not contribute to permeability, we use two terms, conductive microfracture and non-conductive microfracture, to distinguish microfractures according to the impact of their existence to permeability. Conductive microfractures are open microfractures and provide significant contribution to hydraulic conductivity of the rock by connecting pore to pore or creating considerable additional flow paths. The level of permeability enhancement resulted from the existence of conductive microfractures in the rock may be reflected for instance by comparing two or more microfractured rock samples for which the permeability inversely proportional to porosity. The degree of permeability enhancement caused by conductive microfractures depends on their geometry (width and length), intensity, and connectivity. It is very difficult to quantify these factors. But a detailed analysis can be carried out by incorporating routine and special core analysis data, lithological core description, and thin section images to reveal the significance of microfractures in improving the permeability and predict the permeability of microfractured rocks. Non-conductive microfractures can’t enhance rock permeability due to their limited extension, very low intensity, or too small opening size to transmit fluid or even close.
This study proposes a technique to determine whether microfractures in a rock or a group of rocks may be categorized as conductive or non-conductive. Then thin section images of the rock are used to characterize the microfractures to help analyzing the role of both the types and their variation in improving the permeability. The types of the carbonate rocks that are most populated with microfractures are identified; the cut-off porosity is determined; what is the role of conductive microfractures in improving the permeability and how to predict the permeability of the rock samples with microfractures are analyzed.
1. Method and data
1.1. Method
A method of rock typing, so called Pore Geometry and Structure (PGS) method, was recently developed for carbonate reservoir [14-15]. The method has advantages in grouping rock characteristics as it links detailed geological characteristics to physical properties of the rocks. It is found that the relationship between depositional environment and diagenesis and petrophysical properties can be translated into a power law equation that involves only porosity and permeability as Eq. (1) below:
where the left-hand side variable, (K/ϕ)0.5, is called pore geometry and the right-hand side, K/ϕ3, is a pore structure variable; K/ϕ3 =1/(τFsSb2) when derived from Kozeny equation. Eq. (1) implies that plotting (K/ϕ)0.5 against K/ϕ3 will give a constant a and a power law exponent b. In addition, the PGS method of rock typing conforms to the use of Leverett J-Function [16] for rock typing. The type curves for carbonate reservoirs are already available [15] and can be directly used for rock type identification. The values of a and b are specific for each rock type and can be obtained from Reference [15]. It should be noted here that Kozeny equation employed to derive Eq. (1) was originally developed for granular or matrix systems. Most recently, it is also suggested that the equation be used for intergranular pore systems [17]. Consequently, the PGS method derived from Kozeny equation is used for porous systems dominated with inter-granular pores in this study.
1.2. Data
The data sources used in this study are from two different carbonate reservoirs, Carbonate A and Carbonate B, which have been producing oil since 1999 and 1997, respectively [18]. Carbonate A is a part of Batu Raja Formation at 1737.36 to 2194.56 m under subsea and regionally located in West Java region, Indonesia. This carbonate with geologic age of Early to Middle Miocene was deposited in a shallow marine environment, reef flat to lagoonal back reef, and shown as platform, reefal buildup, and biochemical carbonate. The carbonate rocks include 7 lithofacies, such as bioclastic mudstone/wackestone/ packstone, argillaceous indeterminate bioclastic mudstone and wackestone, intercalated coralline floatstone with wackestone/packstone, coral rudstone with wackestone/packstone matrix, coral floatstone with wackestone/packstone matrix, coral bindstone, and coral framestone.
Carbonate B is a reefal buildup buried as a part of Tuban Formation at 2499.36 m to 2987.04 m sub-sea, in East Java of Indonesia. This Early to Middle Miocene carbonate was deposited in an open lagoon environment with many aggraded patch reefs. It consists of two main lithofacies, large foram packstone with red algae and coral in the upper interval and large foram packstone/ wackestone/mudstone with bioclastic red algae and coral in the lower interval. Sub-division of the carbonate comprises of skeletal wackestone with larger foraminifera, larger foraminifera packstone to grainstone, skeletal packstone and wackestone with foraminifera, coral rudstone, skeletal packstone with coralline algae, and ashy claystone and lime mudstone.
All the data sets provided for this study include results of 1251 conventional core analysis with lithological description, 41 special core analysis (SCAL), and 40 thin section petrographic analysis [15]. The porosity and permeability, respectively, ranges from 1.73% to 27.49% and (0.01-1800.00)×10-3 μm2 for Carbonate A and from 1.10% to 32.1% and (0.01-2257.00)×10-3 μm2 for Carbonate B. Fig. 1 and Fig. 2, show K-ϕ cross-plots for Carbonate A and Carbonate B respectively. It can be implied from these figures that Carbonate B is more heterogeneous than Carbonate A based on the observation on the porosity range of 15% and lower, the range of permeability is significantly wider in Carbonate B than that in Carbonate A. Such heterogeneity may also be inferred from the low values of correlation coefficient as depicted in Fig. 1 and Fig. 2.
Fig. 1.
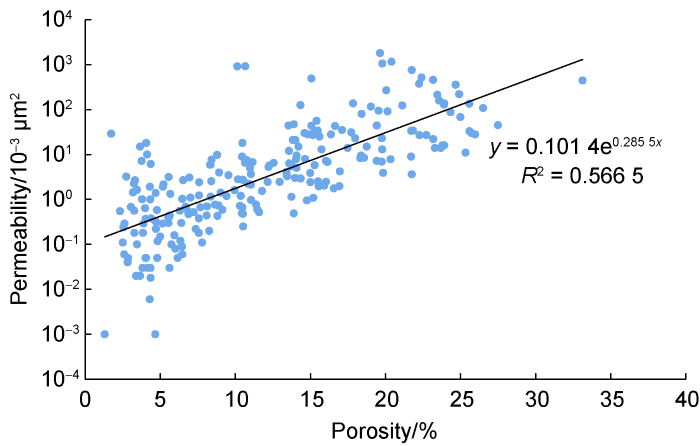
Fig. 1.
K-ϕ cross-plot for Carbonate A.
Fig. 2.
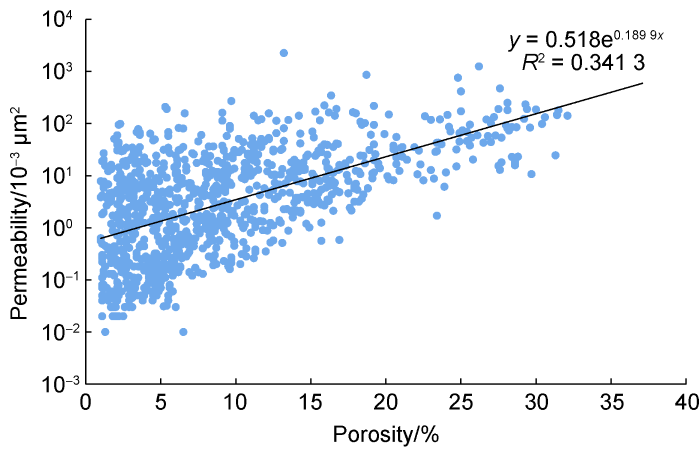
Fig. 2.
K-ϕ cross-plot for Carbonate B.
The capillary pressure data are obtained from 31 Carbonate A sample plugs and 10 Carbonate B ones. All the capillary data available are then processed to generate the correlation between initial water saturation Swi and air permeability K as shown in Fig. 3 for Carbonate A and Fig. 4, for Carbonate B. These results are very consistent with previous studies on carbonates [15] and sandstones [19].
Fig. 3.
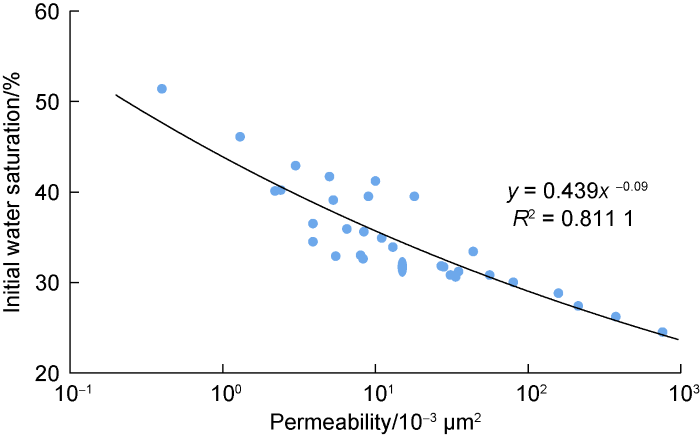
Fig. 3.
Swi-K relation for Carbonate A.
Fig. 4.
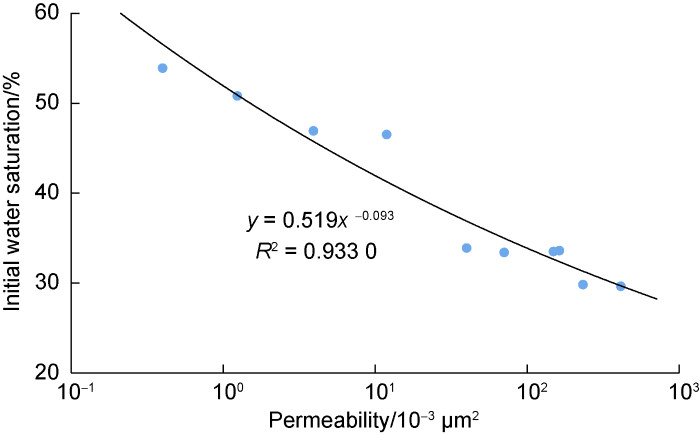
Fig. 4.
Swi-K relation for Carbonate B.
Two main pore characteristics that may govern the magnitude of Swi and K are pore size distribution and pore geometry. Assuming that the effect of pore size distribution is identical to that of specific internal surface area on permeability, another pore characteristic that considerably affects K is pore connectivity or tortuosity. As pore connectivity determines how easy air flows through porous rock, and when the rock contains microfractures, the microfractures may enhance effectiveness of the connectivity. Differently, the effect of microfractures on Swi may be negligible because empirically the secondary porosity due to microfractures contributes so little to the total of both primary and secondary porosity [3] that the amount of connate water residing in the microfractures is thus only a small part of total connate water in the rock.
Combining the Swi-K relation just discussed above with Eq. (1) will result in K = f(ϕ, Swi). Since each rock type has its own values of a and b for Eq. (1), hence each rock type will have a specific correlation of K = f(ϕ, Swi). Here Swi is defined as the initial water saturation determined at capillary pressure of 0.345 MPa (50 psi) for all available data. Then using K = f(ϕ, Swi), we predict the permeability of the samples that contain conductive microfractures.
2. Results and discussions
2.1. Rock typing
Wibowo conducted an extensive study by employing a large number of carbonate samples from various oil and gas fields [15], and found that there is a “normal” trend of (K/ϕ)0.5-K/ϕ3 data points distribution for a rock type (RT) that distinguishes it from others (Fig. 5). Such a graph is so called rock type curve [14-15]. The term “normal” refers to a situation where almost no significant influence of secondary porosity is found on permeability. The red dashed oblique circle on Fig. 5 represents a boundary for normal data points of a rock type. The slanted, dashed blue lines represent estimated ends for data points. Therefore, when there is a data point falling off to the right of the highest limit line, the aforementioned point may represent a sample that is considerably affected by secondary porosity, due to either vugs or microfractures or both, on its permeability. The label RT-i depicted in Fig. 5 designates for rock type number i for which i is the first or the upper most rock type, depending on the distribution of data points on the curve. For the two data sets for this study, giving i = 4, the upper most rock type obtained for each data set is RT-4 (Table 1, Fig. 6).
Fig. 5.
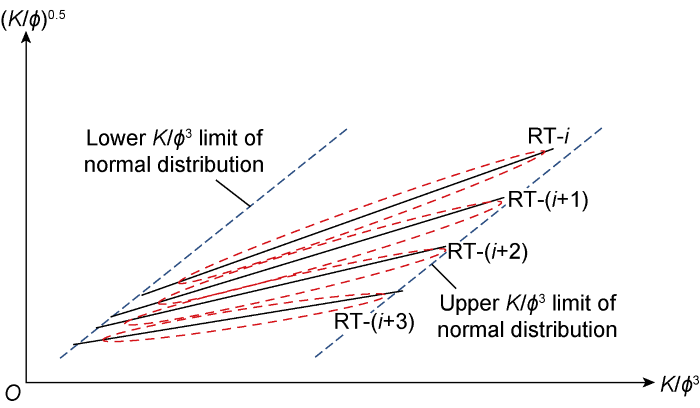
Fig. 5.
Idealized normal distribution of data points of each rock type with no conductive microfracture or large vug.
Table 1. Relation of rock types to petrological types
| Carbonate A | Carbonate B | ||
|---|---|---|---|
| RT No. | Petrological Type | RT No. | Petrological Type |
| RT-4 | Packstone | RT-4 | Packstone |
| RT-5 | Packstone | RT-5 | Packstone |
| RT-6 | Packstone-wackestone | RT-6 | Packstone |
| RT-7 | Packstone-wackestone | RT-7 | Packstone |
| RT-8 | Packstone-wackestone | RT-8 | Packstone-wackestone |
| RT-9 | Wackestone-packstone | RT-9 | Packstone-wackestone |
| RT-10 | Wackestone-packstone | RT-10 | Packstone-wackestone |
| RT-11 | Wackestone-packstone | RT-11 | Wackestone-packstone |
| RT-12 | Wackestone-packstone | RT-12 | Wackestone-packstone |
| RT-13 | Wackestone-packstone | RT-13 | Wackestone-packstone |
| RT-14 | Wackestone-packstone | RT-14 | Wackestone-packstone |
Fig. 6.
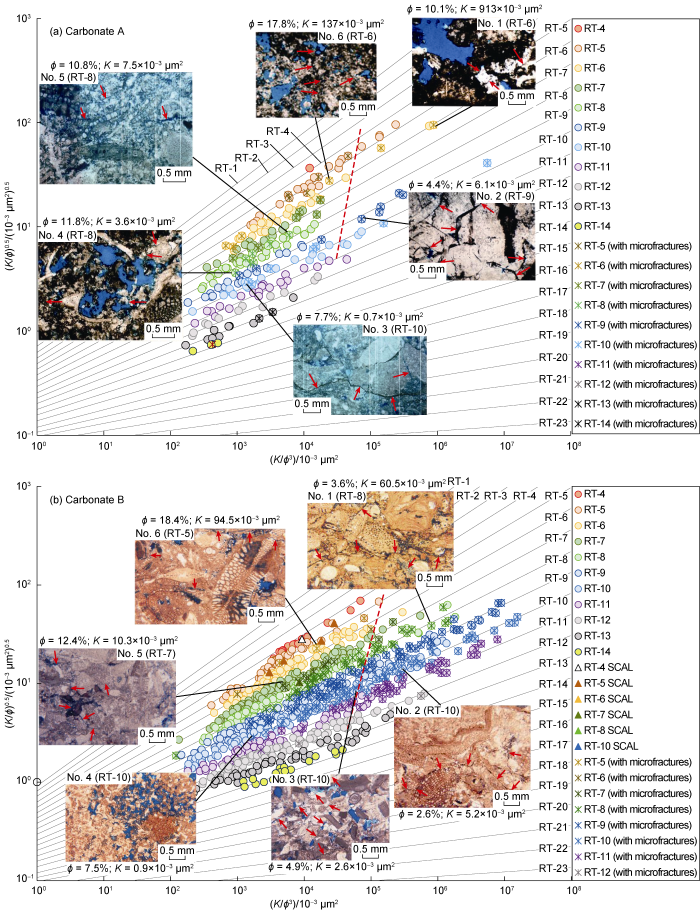
Fig. 6.
PGS rock typing for Carbonate A and Carbonate B and some thin section images (the red arrows point to microfractures).
The results of rock typing on routine core analysis data for Carbonate A and Carbonate B are shown on Fig. 6, along with thin section images available for some samples. Each of the two Carbonates includes 11 rock types. And after examining the core description data of each rock type, it is found that there is a consistent relation between rock type and petrological type as exhibited in Table 1 for Carbonate A and Carbonate B. Some differences might be due to their different depositional environment and diagenetic intensity. Since the method of rock typing employed in this study is based on two important petrophysical parameters, permeability and porosity, the rock types established here may be used to characterize microfractures.
In relation to the behavior of data point distribution of the rock types that indicates the existence of conductive microfractures in the samples in Fig. 5, a preliminary check to expect whether the rock samples contain any conductive microfractures or not is made by briefly evaluating Fig. 6. The values of porosity and permeability depicted in the figures are for several core samples of the corresponding data points. The dashed red line drawn is presumably an upper limit of K/ϕ3 for “normal” data point distribution for the samples without conductive microfractures. In the left-hand side of this limit, typically represented by sample Nos. 3 to 6 for Carbonate A and Nos. 4 to 6 for Carbonate B, permeability is directly proportional to porosity, but samples Nos. 1 and 2 for Carbonate A and Nos. 1 to 3 for Carbonate B do not follow this proportionality. It may be expected, therefore, that data points located to the right of the dashed red line indicate the existence of certain flow conduits, microfractures and/or large vuggy pores that significantly contribute to hydraulic conductivity of the rock. Assuming that the microfractures have very limited aperture and extension, then the pore size and connectivity among pores are the main factors governing the permeability. There is an example here. A vuggy sample plug represented by No. 1 for Carbonate A (Fig. 6a) is a typical case in which vuggy pores obviously govern permeability; whereas samples Nos. 1 and 2 for Carbonate B (Fig. 6b) have no or limited vuggy pores, the relatively high permeability with low porosity is thus resulted from conductive microfractures containing in the samples.
2.2. Identification and characterization of the microfractures
In order to identify the presence of microfractures and other types of secondary pores, this study analyzed the data of core description and thin section petrography of these two Carbonate samples. The relevant core data such as porosity, permeability, and capillary pressure are then specified as those associated with microfractures. The results are presented in the form of K-ϕ cross-plots on Fig. 7a for carbonate A and Fig. 7b for carbonate B. Inspection of the figure shows that many samples contain microfractures in each rock type for Carbonate A having porosity from 2% to about 25% (Fig. 7a). In a comparison, microfractures contained in Carbonate B as shown in Fig. 7b are much less proportion in RT-4 to RT-6, mostly concentrated in RT-7 to RT-11 with porosity ranging from 1% to about 11%, and even almost no indication of microfractures in RT-12 to RT-14 of Carbonate B. Regardless of whether the microfractures are conductive or not, this may imply that microfractures had well developed in all rock types of Carbonate A, but development was more selective in Carbonate B. For the two Carbonates studied here (Fig. 7), it appears that the K-ϕϕ relationship for each rock type does not always follow the rule, namely, K increases with the increase of ϕϕ. It is worth noting that PGS concept was developed on the basis of similarity in pore geometry, where the particular similarity relates to some degree to geologic characteristics associated with environmental deposition and diagenesis[15].
Fig. 7.
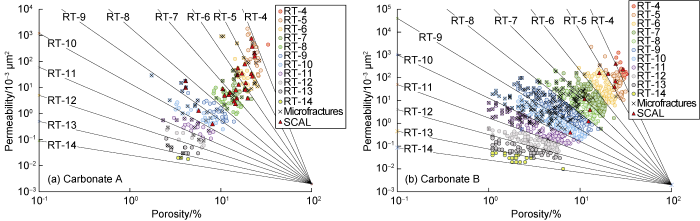
Fig. 7.
K-ϕ crossplots for Carbonate A and Carbonate B.
In order to provide a better understanding regarding the opposite trend of common K-ϕ relation, we refer to the theory of similarity in fractal concept [20], which is adopted in developing the PGS method. In the case of porous media, rearranging the original Kozeny equation[21] yields a power law equation as mentioned on Eq. (1) with a = 1 and b = 0.5, where this condition is valid only for smooth capillary bundles. For non-ideal porous and permeable rocks, it has been found that a < 1 and b < 0.5[15]. Therefore, as previously described, (K/ϕ3) = 1/(τFsSb2), and Eq. (1) is transformed into (K/ϕ)0.5 = 1/(τFsSb2)0.5, where the tortuosity, τ, is only dictated by capillary J-Function [22]. When the capillary data sets of a given group of rocks yield or can be fitted into a single J-Function curve [15], it can be concluded that all group members lies approximately at the same tortuosity value. The term τFs is widely known as Kozeny constant [23-24]. This implies that the permeability of natural porous media is a function of porosity and specific internal surface area. Therefore, utilizing Eq. (1) and assuming τFs is a constant and specific for a given rock type, one can write K=CK,i(ϕ/Sb4b), where CK,i is defined as the modified Kozeny constant for rock type ith. Compiling all the algebraic modifications, the last equation can be rewritten into (K/ϕ)0.5=CK,i(1/Sb)2b. Therefore, for a given rock type having the same CK,i and b, an increase in (K/ϕ)0.5 results in a decrease of Sb. At the same time, a decrease in Sb could be a function of porosity reduction and/or an increase in grain size. Furthermore, for granular systems with relatively homogeneous grain size, Sb decreases as grain size increases which in turn yields larger pore size. In a situation where both grain size and porosity decrease, resulting in both smaller pore size and Sb, the presence of hydraulically conductive microfractures is a necessity for the rock to have better flow conduits than the rock without conductive microfractures.
Fig. 8 shows data for rock types RT-4, RT-5 and RT-6 of Carbonate A and Carbonate B, respectively, where vuggy porosity dominates the samples. Here, the thin section images are depicted to show typical pore characteristics, type and size, for the corresponding samples. Yet the available thin section images are very limited in number while the pore size and the distribution may be very heterogeneous in each type of the rock samples, the effect of pore heterogeneity on hydraulic conductivity of the samples can be simply described through the variable K/ϕ3, which is τFsSb2, of Eq. (1). Since each rock type has its own τFs, Fig. 8 implies that, for each rock type with a given value of permeability, a sample with higher porosity has smaller vuggy pore sizes but higher number of vugs resulting in a higher value of Sb. In other words, one can say that a decrease in porosity that produces an increase in permeability is a result from presence of larger vugs with smaller pore volume and thus lower Sb. This situation is represented by RT-6 of Carbonate A (Fig. 8a). Upon inspection of the thin section images, it is clearly seen that the existing microfractures are of limited extension and mostly closed. In this particular case, microfractures do not provide any contribution to permeability of these rock types, categorized as non-conductive microfractures. As evidenced that almost all of the core samples of RT-4 to RT-6 of both samples are vuggy. RT-4 is better than RT-5 and RT-6 in terms of both porosity and rock quality in average. It can be expected that the vuggy system of these rock types dominates over microfractures in the context of hydraulic conductivity.
Fig. 8.
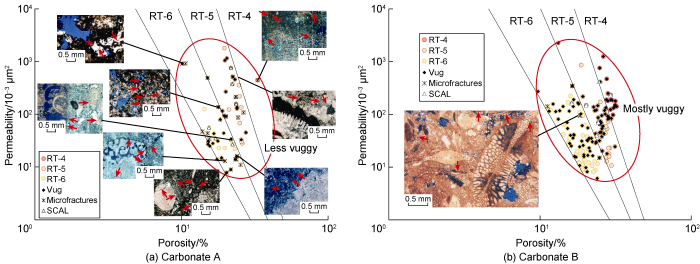
Fig. 8.
K-ϕ relation crossplots of RT-4 to RT-6 in Carbonate A and Carbonate B, and corresponding thin section images (the red arrow points to microfracture; the blue colour represents pore space).
Referring to Figs. 8-11, it can be implied that vuggy pores tend to diminish with an increase in rock type number and, as it is evidenced in Carbonate B, microfractures will start to develop (where closed microfractures in RT-13 and RT-1 4 are less, and extend to a limited range, which are not shown on the figures). However, it appears that microfractures are present in all rock types of Carbonate A. This different microfracture development between the two Carbonate samples could be caused by the different influence of the local stress acting on the Carbonate samples. When vuggy pores diminish and microfractures develop, these two pore types tend to compete each other in contributing to rock permeability. Fig. 9 shows the K-ϕ cross-plots and thin section images for RT-8 to RT-14 for Carbonate A and Carbonate B, which consecutively demonstrates a reduction of vuggy pores, a decrease in porosity, and an increase in microfracture intensity. To describe the differences in the vuggy pores among the samples, several terms are introduced and depicted in Figs. 8 to 11: mostly vuggy, less vuggy, lesser vuggy, almost no vug, and no vug. The first term, mostly vuggy, holds for any RT or a part of it with almost all the samples are vuggy. The second term is for those with relatively a small portion of the samples contains unidentifiable vugs or even has no vug. The third one, lesser vuggy, is given for those having even higher portion of the samples with unidentified vugs. The fourth one, almost no vug, is designated for a group of samples with mostly no vug. The last term, no vug, is given for any rock type or a group of samples within the rock type with no vug at all. In particular, as shown in Fig. 9a, RT-7 and RT-8 are observed to become rock groups that start shifting from vuggy dominated to microfracture dominated, yet the vugs are probably classified as separate vugs [25] and the microfractures are not playing any part on permeability. In contrast, RT-9 from Carbonate A (Fig. 9b) exhibits data points that can be divided into two groups in which the group with no vug is dominated by microfractures giving higher permeability, whereas the lower group of RT-9 has three samples with identified microfractures and vuggy porosity. A similar characteristic is shown on RT-10 (Fig. 9c) where the sample with 1.5% porosity contains a good network of conductive microfractures, yielding the sample permeability of about 27×10-3 μm2. Lastly, RT-11 to RT-14 have not vugs.
Fig. 9.
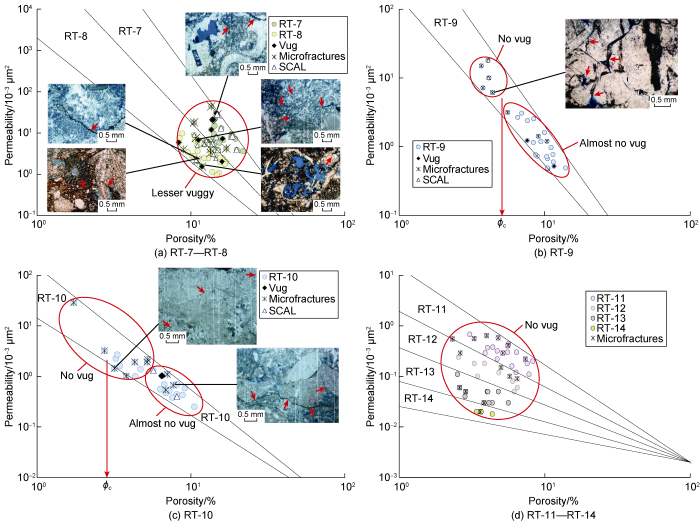
Fig. 9.
K-ϕ cross-plots for RT-7 to RT-14 of Carbonate A (the red arrow points to microfracture, the blue color represents pore space, and ϕc is cut-off porosity).
Similar characteristics are demonstrated by Carbonate B for RT-7 to RT-11 (Fig. 10), where there are still vugs present in many rock samples. Here we divide each rock type into two groups shown by large red circle. RT-7 and RT-8 of Carbonate B are mostly vuggy, whereas vugs diminish as rock type moves from RT-9 to RT-11. On the crossplots, the lower groups contain more vugs than the upper groups, and the microfractures are mostly concentrated in the upper groups, each with lower porosity than the corresponding lower group.
Fig. 10.
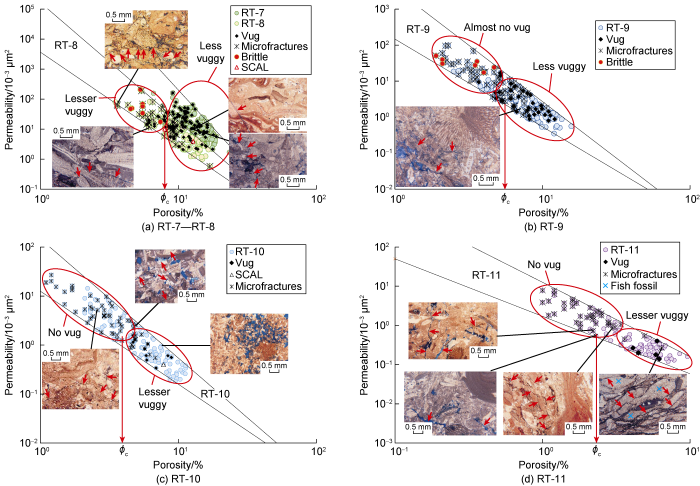
Fig. 10.
K-ϕ cross-plots for RT-7 to RT-10 of Carbonate B (red arrow in images points to microfracture, blue colour in images represents pore space, and ϕc is cut-off porosity).
From the previous observations, it can be implied that the two Carbonate samples demonstrate that microfractures are able to develop in low, medium, and even higher porosity rocks. Even though, according to the distribution of all the data points without microfractures, it reveals that high porosity is not conducive to the development of microfractures. The highest intensity of microfractures is mostly encountered in the zone with lower porosity and less vuggy pores.
Brittleness is a relative measure of susceptibility of a rock sample to a given stress. In routine core analysis works, a relatively small rock sample is stated to be brittle when it is easily fractured by putting a relatively low stress on it [26]. The samples in the upper group on the K-ϕ crossplot are mostly brittle, especially the RT-8 and RT-9 of Carbonate B. Rock hardness is a qualitative measure of scratch resistance of a rock and is determined by applying the Mohs scale method [27]. The samples in the upper group on the K-ϕ crossplot are divided into medium hard-hard, and hard-extremely hard. The hardness of RT-12 to RT-14 of Carbonate B is mostly very hard and microfractures do not well develop in these rock types. Both rock hardness and brittleness can be helpful in identifying and characterizing microfractures.
Recalling that the lower groups of RT-8 to RT-11 of Carbonate sample B are a mix of samples with and without microfracture, it is expected for these groups that contribution of existing microfractures to permeability enhancement is not significant. As vuggy porosity decreases, microfractures are better-developed and the samples become members of the upper groups. Microfractures will now replace the function of existing vugs in improving rock permeability. In accordance to the postulate described above, (K/ϕ)0.5 is directly proportional to (1/Sb)2b (where 0<b<0.5) and Sb decreases with porosity. It is worth noting, however, that a decrease in porosity would not yield significant impact to both (1/Sb)2b and on permeability, unless conductive microfractures contribute significantly to permeability enhancement. Observation of macro-fractures shows that for total porosity of less than 10%, the contribution of fracture porosity to the total porosity is less than 10% [3]. However, a recent publication dealing with tight-gas sandstones shows that typically the microfracture porosity contributes as much as 27% to the total porosity and the corresponding permeability is about as high as ten folds of the pore permeability [4]. Since geometry of microfracture significantly differ from that of intergranular pore system, contribution of surface area of microfracture to the total internal one would be much lower than that of the matrix system.
Recalling the vuggy dominated systems explained previously, it can be implied that a decrease in porosity that results in an increase of permeability has to be augmented with an increase in vuggy pore size and/or vuggy pore connectivity so called as touching vugs [25]. In case of microfracture dominated systems, the microfractures have to substitute the role of vuggy pores by increasing the width of apperture and improving connectivity among the microfractures. As for other rock types of Carbonate B, RT-12 to RT-14 is characterized by fine to very fine grain size and mostly very hard. The existing microfractures are mostly closed with very limited extension. Such a level of hardness would probably increase rock ductility that impedes conductive microfracture development.
2.3. Types of microfracture
Inspections done on all of the thin section images indicate that almost every rock type does not possess unique properties of microfracture for all the sample members. For example, RT-6 of Carbonate A (Fig. 8a) has a sample member with lowest porosity but highest permeability with only intragranular microfractures, whereas another member having the lowest permeability contains both intragranular and intergranular ones, and another member having the second lowest permeability has all types of microfractures mentioned, intragranular, intergranular and transgranular microfractures. These various features may be inferred for the particular case to be caused by grain heterogeneity. Similarly, RT-6 of Carbonate B (Fig. 8b) exhibits the existence of all types of microfractures with no obvious pattern of the orientation. However, a case of relatively homogeneous grain size, (very fine to fine) represented by RT-11 of Carbonate B (Fig. 10d) shows that microfractures tend to be parallel to one another and are mostly intergranular when the fossil grains are still preserved, and the other samples with smaller grain size tend to be transgranular ones. The former case implies that the lowest strength manifested along the length of the grains; while the latter, characterized by relatively homogeneous grain size tend to have homogeneous strength as well. Meanwhile, for other rock types of Carbonate B (Fig. 11), namely with relatively lower rock quality and harder, which are RT-12, RT-13, and RT-14, have mostly short transgranular microfractures, which in turn make a little contribution to permeability enhancement.
Fig. 11.
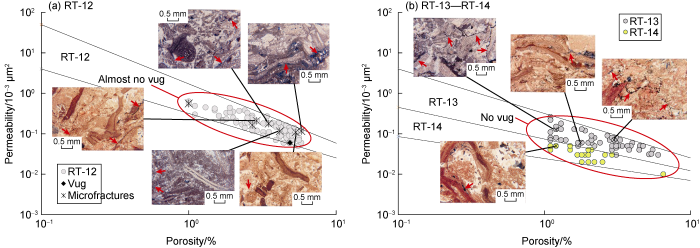
Fig. 11.
K-ϕ cross-plots for RT-12 to RT-14 of Carbonate B (red arrow in image points to microfracture, and blue color represents pore space).
2.4. Prediction of microfractures and permeability
The purposes of the prediction are to: (1) determine a cut-off porosity for each rock type for separating group of data points indicating rock samples with conductive microfractures from that with non-conductive ones, and (2) generate a rock type dependent equation of permeability as a function of porosity ϕ and initial water saturation Swi and a procedure of establishing the relation of initial water saturation against permeability, Swi-K, for samples containing conductive microfractures. For each of the Carbonates, a comparison will be made between the results of the permeability equation derived by selecting certain SCAL samples having conductive microfractures and those without selecting SCAL data. This is to evaluate the importance and the need of cores sampling and sorting for SCAL works when dealing with such reservoirs.
Some core samples have no indication of microfracture, but the corresponding thin section images exhibit the existence of microfractures, evidenced in two samples of RT-10 of Carbonate A (see Fig. 9c for instance) and one or more samples of RT-9 to RT-14 of Carbonate B. As a result, many data points without microfractures are surrounded by the data points with microfractures, presumably caused by microfractures that are not noticed using a regular magnifying glass during the course of core description (Figs. 7-11). Assuming that the data points without microfractures and surrounded by those with microfractures represent samples with microfractures, it is therefore possible to identify a group of data points with microfractures in the K-ϕ cross-plot of each rock type, in which the highest porosity of this group is then established as the cut-off porosity, ϕc, and the porosity below which means the microfractures are hydraulically conductive. Shortly, for a given rock type, the cut-off porosity is used to divide the data points of the rock type into two groups. One group represents the samples with highly populated microfractures and the other is the samples with much less populated microfractures. The cut-off porosity for RT-9 and RT-10 of Carbonate A (Fig. 9b, 9c) is about 5% and 3%, respectively, and of which 7 samples contain conductive microfractures. For Carbonate B (Fig. 10), the cut-off porosity is around 8.5% for RT-8, 5.5% for RT-9, 3.8% for RT-10, and 2.6% for RT-11, and of which 213 samples contain conductive microfractures. The tendency for such decrease in cut-off porosity as rock type number increases is probably due to an increase in the hardness and a decrease in the brittleness of the tested rock samples.
An extended analysis is then performed to predict the permeability of the rock that contains conductive microfractures. The common practiced technique to predict permeability is to model a relation between permeability and other rock properties such as porosity and connate or initial water saturation, Swi [28⇓-30]. In order to develop a novel technique of permeability prediction, SCAL data previously presented are sorted to separate samples having conductive microfractures from the others. It is found that there are two samples of RT-9 in Carbonate A and only one sample of RT-8 in Carbonate B with microfractures (Figs. 9b-10d). The resulting Swi-K crossplots are mapped in Fig. 12, respectively, for each carbonate sample. As can be observed, when Swi = 40%, the data points of the sample with conductive microfractures are located further horizontally to the right from the data points of the sample without conductive microfractures (Fig. 12a). This unique characteristic implies that two or more rock samples of relatively low permeability possessing significant permeability difference but about the same Swi. It can be inferred in this case that the higher permeability sample has conductive microfractures. Therefore, before selecting specific core plugs for SCAL work, rock typing on samples should be conducted by employing routine core analysis data (Fig. 6). In doing so, one can choose representative samples of each rock type and perform further analysis on resulting SCAL data concerning the effects of microfractures. Due to the limitation of SCAL data, samples having conductive microfractures are combined with those of higher permeability (K>100×10-3 μm2), assuming for the latter that microfractures has no contribution to permeability (Fig. 12).
Fig. 12.
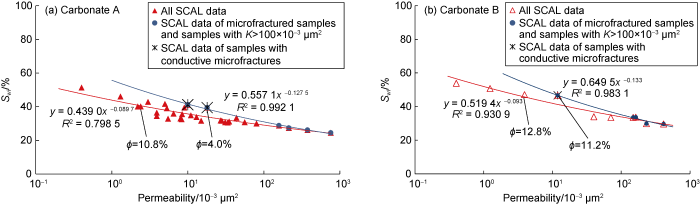
Fig. 12.
Swi-K correlation for Carbonate A and Carbonate B.
The constant a and exponent b of Equation (1) for each rock type are referred to the values in Table 2 for carbonate rocks [15]. As there are two Swi-K correlations for each Carbonate as shown in Fig. 12, we have two permeability equations, K = f(ϕ, Swi), for each Carbonate. Combining specific subsets of Swi-K correlation with Equation (1) will result in a general permeability equation, as follows:
Table 2. The constant a and exponent b of Eq. (1) for carbonate rocks [14]
| RT No. | a | b |
|---|---|---|
| RT-4 | 0.626 8 | 0.425 |
| RT-5 | 0.553 4 | 0.405 |
| RT-6 | 0.488 6 | 0.385 |
| RT-7 | 0.431 4 | 0.365 |
| RT-8 | 0.380 9 | 0.345 |
| RT-9 | 0.336 3 | 0.325 |
| RT-10 | 0.296 9 | 0.305 |
| RT-11 | 0.262 1 | 0.285 |
| RT-12 | 0.231 4 | 0.265 |
| RT-13 | 0.204 3 | 0.245 |
| RT-14 | 0.180 4 | 0.225 |
Recalling from previous explanations, rock types that have conductive microfractures include RT-9 and RT-10 of Carbonate A yielding a total of 7 samples and RT-8 to RT-11 of Carbonate B giving 213 samples. Each of core samples has permeability for which Swi is determined using the corresponding relation depicted in Fig. 12 and then the plot of K against ϕA/SwiB is generated. By employing the blue correlation obtained from Fig. 12, the final solutions for the coefficient C, constant A and exponent B for Eq. (2) are derived from the best-fit trendline of K versus ϕA/SwiB and presented in Table 3 for the rock types of Carbonate A and Carbonate B. Similarly, one can obtain permeability equations by combining Swi-K correlation for all SCAL data, the red trendline in Fig. 12, with the results are given in Table 4 for the two Carbonates.
Table 3. The constants and exponents for the permeability predicting equation based on selected SCAL data
| RT No. | c | A | B |
|---|---|---|---|
| RT-9 for Carbonate A | 0.216 7 | 0.976 6 | 8.062 7 |
| RT-10 for Carbonate A | 0.112 3 | 1.004 5 | 9.491 5 |
| RT-8 for Carbonate B | 0.422 0 | 1.212 7 | 8.717 9 |
| RT-9 for Carbonate B | 0.398 0 | 1.195 5 | 9.680 5 |
| RT-10 for Carbonate B | 0.492 0 | 1.015 1 | 9.407 3 |
| RT-11 for Carbonate B | 0.523 0 | 0.819 6 | 8.879 9 |
Table 4. The constants and exponents for the permeability predicting equation based on all SCAL data
| RT No. | c | A | B |
|---|---|---|---|
| RT-9 for Carbonate A | 0.001 7 | 0.982 4 | 11.529 0 |
| RT-10 for Carbonate A | 0.000 4 | 1.004 4 | 13.491 1 |
| RT-8 for Carbonate B | 0.004 0 | 1.212 7 | 12.592 9 |
| RT-9 for Carbonate B | 0.002 0 | 1.195 5 | 13.982 9 |
| RT-10 for Carbonate B | 0.003 0 | 1.015 1 | 13.588 3 |
| RT-11 for Carbonate B | 0.005 0 | 0.819 6 | 12.826 5 |
The results of permeability prediction for those samples are exhibited in Fig. 13 for Carbonate A and Carbonate B. It appears in this figure that the predicted permeability is relatively better when the SCAL data of microfractured samples are treated separately (blue trendline in Fig. 12) from the “normal Swi-K relation” (red trendline in Fig. 12) in developing K = f(ϕ, Swi). Evaluation of the absolute relative error, εR, results in ɛεR = 3.14% from the blue trendline as compared to 4.91% when using normal Swi-K relation (red trendline) for Carbonate A (Fig. 13a). Permeability prediction for Carbonate B (Fig. 13b) demonstrates that using the SCAL samples with conductive microfractures to develop a separate Swi-K relation (blue trendline in Fig. 12b) produces better prediction than all SCAL data without sorting (red trendline). For Carbonate B, εR obtained is 17.37% as the result of using the blue trendline in generating K = f(ϕ, Swi), whereas ɛεR = 21.40% when employing normal Swi-K relation for K = f(ϕ, Swi). When compared with the results for Carbonate A, much higher ɛεR for Carbonate is, in addition to a big difference in the number of samples, due to high differences in permeability variation for porosity and permeability lower than 15% and 100×10-3 μm2, respectively (Figs. 1 and 2).
Fig. 13.
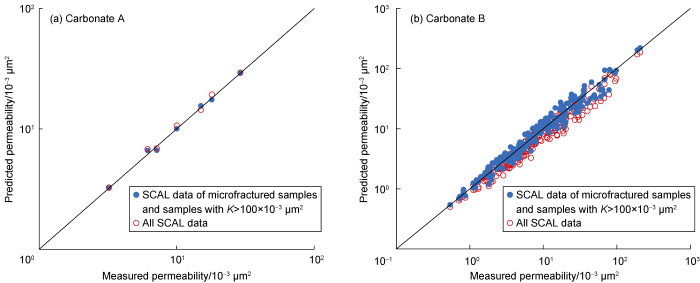
Fig. 13.
Comparison of predicted permeability with measured one of samples with conductive microfractures for Carbonate A and Carbonate B.
3. Conclusions
Microfracture identification and characterization have been successfully conducted by applying PGS rock typing method to core and petrographic analysis data of two different carbonates: Carbonate A and Carbonate B. By having much larger number of core analysis data available for Carbonate B than Carbonate A, it is found for Carbonate B that microfractures do not well-develop in rock samples dominated by vuggy porosity with a total porosity of about greater than 11%. The development of microfractures is more intense in rock samples with less vugs, but the intensity decreases significantly as vugs diminish and the rocks become very hard.
It is found that the cut-off porosity of each rock type can seperate samples with microfractures from those without microfractures, and the cut-off porosity decreases with the increase of the number of rock type. Integration of PGS rock type equation with SCAL data results in equation K = f(ϕ, Swi). A proper Swi-K relation is needed for better permeability prediction of roks containing conductive microfractures. The benefits gained from the method are easy and inexpensive by utilizing standard core analysis data commonly available in the industry to get a better understanding of the influence of vuggy porosity in the development of microfractures, and an ability to predict whether microfractures are conductive or not conductive.
Nomenclature
a, c—constant, dimensionless;
A, b, B—exponent, dimensionless;
CK—modified Kozeny constant, dimensionless;
Fs—pore shape factor, dimensionless;
i—rock type number i-th, dimensionless;
K—absolute permeability, 10-3 μm2;
Sb—specific internal surface area, µm-1;
Swi—initial water saturation, %;
εR—relative error, %;
τ—tortuosity, dimensionless;
ϕ—porosity, %;
ϕc—cut-off porosity, %.
Acknowledgements
The authors thank P3MI Bandung Institute of Technology for providing the financial support to conduct this study.
Reference
Microcracks in rocks: A review
DOI:10.1016/0040-1951(83)90198-1 URL [Cited within: 3]
Microfractures: A review
Microfracturing in the Upper Triassic Sichuan Basin tight-gas sandstones: Tectonic, overpressure, and diagenetic origins
DOI:10.1306/06301009191 URL [Cited within: 3]
Characteristics and origin of microfracture in Lower Cretaceous tight sandstone from Kuqa foreland basin, NW China
Practical approaches to identifying sealed and open fractures
DOI:10.1306/11060201106 URL [Cited within: 1]
A study of pore structure by image processing method and its application
An improved method for viewing micropore systems in rocks with the polarizing microscope
DOI:10.2118/13136-PA URL [Cited within: 1]
Effects of mechanical anisotropy on core strain measurements for in-situ stress determination
The widespread occurrence of healed microfractures in siliciclastic rocks: Evidence from scanned cathodoluminescence imaging
New fracture characterization methods for siliciclastic rocks
Rapid digital quantification of microfracture populations
DOI:10.1016/j.jsg.2005.12.006 URL [Cited within: 1]
Characterization of micro-fractures in carbonate Sarvak reservoir, using petrophysical and geological data, SW Iran
DOI:10.1016/j.petrol.2018.06.058 URL [Cited within: 1]
A type curve for carbonates rock typing
Characterization of carbonate rocks based on pore geometry and structure
Capillary behavior in porous solids
DOI:10.2118/941152-G URL [Cited within: 1]
Constraining fluid-rock interactions during eogenetic karst and their impacts on carbonate reservoirs: Insights from reactive transport modeling
DOI:10.1016/j.apgeochem.2021.105050 URL [Cited within: 1]
A study of pressure maintenance and secondary recovery
Microscopic factors affecting pore geometry and structure and development of rock typing curve for sandstones
Development of a modified capillary pressure J-function
Fluid flow through granular beds
The generalized Kozeny-Carman equation, part 1: Review of existing theories
Carbonate reservoir characterization
Microhardness, toughness, and modulus of Mohs scale minerals
DOI:10.2138/am.2006.1844 URL [Cited within: 1]
An investigation of permeability, porosity, and residual water saturation relationships
A new approach to improved log-derived permeability
Pore-level analysis of the relationship between porosity, irreducible water saturation, and permeability of clastic rocks
