Sweet spot classification evaluation of tight conglomerate reservoir in Mahu sag and its engineering application
1
2020
... The tight conglomerate reservoirs in Mahu sag, Junggar Basin are fan-delta front deposits with complex lithofacies characteristics, deep burial and high heterogeneity, and extremely difficult to put into production[1⇓-3]. In recent years, great breakthrough has been made in production by using horizontal well volume fracturing [4⇓⇓⇓-8]. In 2020, with the goal of reducing cost and increasing efficiency, multi-cluster + temporary plugging fracturing tests in long horizontal stages of horizontal wells were carried out in this area. However, there was a large difference in post-fracturing effects, and the production of most test wells failed to meet expectations. In order to optimize fracturing process parameters and improve productivity, it is necessary to study the initiation law of artificial fractures. Due to the different mineral composition of gravel and matrix in conglomerate, the rock mechanical properties of them are significantly different, and the conglomerate reservoir has strong mechanical properties heterogeneity [9⇓-11]. Conglomerate characteristics (gravel size, content, sorting, distribution and mechanical properties difference between gravel and matrix, etc.) and horizontal stress difference significantly affect artificial fracture propagation morphology. When hydraulic fractures encounter conglomerates, they may have a variety of behaviors such as penetration, deflection and fracture arrest [12⇓⇓⇓⇓⇓⇓⇓⇓⇓-22]. The hydraulic fracture propagation in conglomerate reservoirs is very complex. ...
Conglomerate lithofacies and origin models of fan deltas of Baikouquan Formation in Mahu sag, Junggar Basin
1
2014
... The tight conglomerate reservoirs in Mahu sag, Junggar Basin are fan-delta front deposits with complex lithofacies characteristics, deep burial and high heterogeneity, and extremely difficult to put into production[1⇓-3]. In recent years, great breakthrough has been made in production by using horizontal well volume fracturing [4⇓⇓⇓-8]. In 2020, with the goal of reducing cost and increasing efficiency, multi-cluster + temporary plugging fracturing tests in long horizontal stages of horizontal wells were carried out in this area. However, there was a large difference in post-fracturing effects, and the production of most test wells failed to meet expectations. In order to optimize fracturing process parameters and improve productivity, it is necessary to study the initiation law of artificial fractures. Due to the different mineral composition of gravel and matrix in conglomerate, the rock mechanical properties of them are significantly different, and the conglomerate reservoir has strong mechanical properties heterogeneity [9⇓-11]. Conglomerate characteristics (gravel size, content, sorting, distribution and mechanical properties difference between gravel and matrix, etc.) and horizontal stress difference significantly affect artificial fracture propagation morphology. When hydraulic fractures encounter conglomerates, they may have a variety of behaviors such as penetration, deflection and fracture arrest [12⇓⇓⇓⇓⇓⇓⇓⇓⇓-22]. The hydraulic fracture propagation in conglomerate reservoirs is very complex. ...
Lithofacies classification of Baikouquan Formation in Mahu sag, Junggar Basin
1
2016
... The tight conglomerate reservoirs in Mahu sag, Junggar Basin are fan-delta front deposits with complex lithofacies characteristics, deep burial and high heterogeneity, and extremely difficult to put into production[1⇓-3]. In recent years, great breakthrough has been made in production by using horizontal well volume fracturing [4⇓⇓⇓-8]. In 2020, with the goal of reducing cost and increasing efficiency, multi-cluster + temporary plugging fracturing tests in long horizontal stages of horizontal wells were carried out in this area. However, there was a large difference in post-fracturing effects, and the production of most test wells failed to meet expectations. In order to optimize fracturing process parameters and improve productivity, it is necessary to study the initiation law of artificial fractures. Due to the different mineral composition of gravel and matrix in conglomerate, the rock mechanical properties of them are significantly different, and the conglomerate reservoir has strong mechanical properties heterogeneity [9⇓-11]. Conglomerate characteristics (gravel size, content, sorting, distribution and mechanical properties difference between gravel and matrix, etc.) and horizontal stress difference significantly affect artificial fracture propagation morphology. When hydraulic fractures encounter conglomerates, they may have a variety of behaviors such as penetration, deflection and fracture arrest [12⇓⇓⇓⇓⇓⇓⇓⇓⇓-22]. The hydraulic fracture propagation in conglomerate reservoirs is very complex. ...
Significant progress of continental petroleum geology theory in basins of Central and Western China
1
2018
... The tight conglomerate reservoirs in Mahu sag, Junggar Basin are fan-delta front deposits with complex lithofacies characteristics, deep burial and high heterogeneity, and extremely difficult to put into production[1⇓-3]. In recent years, great breakthrough has been made in production by using horizontal well volume fracturing [4⇓⇓⇓-8]. In 2020, with the goal of reducing cost and increasing efficiency, multi-cluster + temporary plugging fracturing tests in long horizontal stages of horizontal wells were carried out in this area. However, there was a large difference in post-fracturing effects, and the production of most test wells failed to meet expectations. In order to optimize fracturing process parameters and improve productivity, it is necessary to study the initiation law of artificial fractures. Due to the different mineral composition of gravel and matrix in conglomerate, the rock mechanical properties of them are significantly different, and the conglomerate reservoir has strong mechanical properties heterogeneity [9⇓-11]. Conglomerate characteristics (gravel size, content, sorting, distribution and mechanical properties difference between gravel and matrix, etc.) and horizontal stress difference significantly affect artificial fracture propagation morphology. When hydraulic fractures encounter conglomerates, they may have a variety of behaviors such as penetration, deflection and fracture arrest [12⇓⇓⇓⇓⇓⇓⇓⇓⇓-22]. The hydraulic fracture propagation in conglomerate reservoirs is very complex. ...
Exploration of fan-controlled large-area lithologic oil reservoirs of Triassic Baikouquan Formation in slope zone of Mahu Depression in Junggar Basin
1
2014
... The tight conglomerate reservoirs in Mahu sag, Junggar Basin are fan-delta front deposits with complex lithofacies characteristics, deep burial and high heterogeneity, and extremely difficult to put into production[1⇓-3]. In recent years, great breakthrough has been made in production by using horizontal well volume fracturing [4⇓⇓⇓-8]. In 2020, with the goal of reducing cost and increasing efficiency, multi-cluster + temporary plugging fracturing tests in long horizontal stages of horizontal wells were carried out in this area. However, there was a large difference in post-fracturing effects, and the production of most test wells failed to meet expectations. In order to optimize fracturing process parameters and improve productivity, it is necessary to study the initiation law of artificial fractures. Due to the different mineral composition of gravel and matrix in conglomerate, the rock mechanical properties of them are significantly different, and the conglomerate reservoir has strong mechanical properties heterogeneity [9⇓-11]. Conglomerate characteristics (gravel size, content, sorting, distribution and mechanical properties difference between gravel and matrix, etc.) and horizontal stress difference significantly affect artificial fracture propagation morphology. When hydraulic fractures encounter conglomerates, they may have a variety of behaviors such as penetration, deflection and fracture arrest [12⇓⇓⇓⇓⇓⇓⇓⇓⇓-22]. The hydraulic fracture propagation in conglomerate reservoirs is very complex. ...
Theoretical understandings, key technologies and practices of tight conglomerate oilfield efficient development: A case study of the Mahu oilfield, Junggar Basin, NW China
1
2020
... The tight conglomerate reservoirs in Mahu sag, Junggar Basin are fan-delta front deposits with complex lithofacies characteristics, deep burial and high heterogeneity, and extremely difficult to put into production[1⇓-3]. In recent years, great breakthrough has been made in production by using horizontal well volume fracturing [4⇓⇓⇓-8]. In 2020, with the goal of reducing cost and increasing efficiency, multi-cluster + temporary plugging fracturing tests in long horizontal stages of horizontal wells were carried out in this area. However, there was a large difference in post-fracturing effects, and the production of most test wells failed to meet expectations. In order to optimize fracturing process parameters and improve productivity, it is necessary to study the initiation law of artificial fractures. Due to the different mineral composition of gravel and matrix in conglomerate, the rock mechanical properties of them are significantly different, and the conglomerate reservoir has strong mechanical properties heterogeneity [9⇓-11]. Conglomerate characteristics (gravel size, content, sorting, distribution and mechanical properties difference between gravel and matrix, etc.) and horizontal stress difference significantly affect artificial fracture propagation morphology. When hydraulic fractures encounter conglomerates, they may have a variety of behaviors such as penetration, deflection and fracture arrest [12⇓⇓⇓⇓⇓⇓⇓⇓⇓-22]. The hydraulic fracture propagation in conglomerate reservoirs is very complex. ...
Exploration and practice of volume fracturing technology in horizontal well of Mahu tight conglomerate reservoirs
1
2019
... The tight conglomerate reservoirs in Mahu sag, Junggar Basin are fan-delta front deposits with complex lithofacies characteristics, deep burial and high heterogeneity, and extremely difficult to put into production[1⇓-3]. In recent years, great breakthrough has been made in production by using horizontal well volume fracturing [4⇓⇓⇓-8]. In 2020, with the goal of reducing cost and increasing efficiency, multi-cluster + temporary plugging fracturing tests in long horizontal stages of horizontal wells were carried out in this area. However, there was a large difference in post-fracturing effects, and the production of most test wells failed to meet expectations. In order to optimize fracturing process parameters and improve productivity, it is necessary to study the initiation law of artificial fractures. Due to the different mineral composition of gravel and matrix in conglomerate, the rock mechanical properties of them are significantly different, and the conglomerate reservoir has strong mechanical properties heterogeneity [9⇓-11]. Conglomerate characteristics (gravel size, content, sorting, distribution and mechanical properties difference between gravel and matrix, etc.) and horizontal stress difference significantly affect artificial fracture propagation morphology. When hydraulic fractures encounter conglomerates, they may have a variety of behaviors such as penetration, deflection and fracture arrest [12⇓⇓⇓⇓⇓⇓⇓⇓⇓-22]. The hydraulic fracture propagation in conglomerate reservoirs is very complex. ...
Adaptability of horizontal well volume fracturing to tight conglomerate reservoirs in Mahu oilfield
1
2019
... The tight conglomerate reservoirs in Mahu sag, Junggar Basin are fan-delta front deposits with complex lithofacies characteristics, deep burial and high heterogeneity, and extremely difficult to put into production[1⇓-3]. In recent years, great breakthrough has been made in production by using horizontal well volume fracturing [4⇓⇓⇓-8]. In 2020, with the goal of reducing cost and increasing efficiency, multi-cluster + temporary plugging fracturing tests in long horizontal stages of horizontal wells were carried out in this area. However, there was a large difference in post-fracturing effects, and the production of most test wells failed to meet expectations. In order to optimize fracturing process parameters and improve productivity, it is necessary to study the initiation law of artificial fractures. Due to the different mineral composition of gravel and matrix in conglomerate, the rock mechanical properties of them are significantly different, and the conglomerate reservoir has strong mechanical properties heterogeneity [9⇓-11]. Conglomerate characteristics (gravel size, content, sorting, distribution and mechanical properties difference between gravel and matrix, etc.) and horizontal stress difference significantly affect artificial fracture propagation morphology. When hydraulic fractures encounter conglomerates, they may have a variety of behaviors such as penetration, deflection and fracture arrest [12⇓⇓⇓⇓⇓⇓⇓⇓⇓-22]. The hydraulic fracture propagation in conglomerate reservoirs is very complex. ...
Origin and depositional characteristics of supported conglomerates
2
2020
... The tight conglomerate reservoirs in Mahu sag, Junggar Basin are fan-delta front deposits with complex lithofacies characteristics, deep burial and high heterogeneity, and extremely difficult to put into production[1⇓-3]. In recent years, great breakthrough has been made in production by using horizontal well volume fracturing [4⇓⇓⇓-8]. In 2020, with the goal of reducing cost and increasing efficiency, multi-cluster + temporary plugging fracturing tests in long horizontal stages of horizontal wells were carried out in this area. However, there was a large difference in post-fracturing effects, and the production of most test wells failed to meet expectations. In order to optimize fracturing process parameters and improve productivity, it is necessary to study the initiation law of artificial fractures. Due to the different mineral composition of gravel and matrix in conglomerate, the rock mechanical properties of them are significantly different, and the conglomerate reservoir has strong mechanical properties heterogeneity [9⇓-11]. Conglomerate characteristics (gravel size, content, sorting, distribution and mechanical properties difference between gravel and matrix, etc.) and horizontal stress difference significantly affect artificial fracture propagation morphology. When hydraulic fractures encounter conglomerates, they may have a variety of behaviors such as penetration, deflection and fracture arrest [12⇓⇓⇓⇓⇓⇓⇓⇓⇓-22]. The hydraulic fracture propagation in conglomerate reservoirs is very complex. ...
... The MaHW26X test well is located in the fault block of well area Ma 18-Aihu 1 of Mahu sag, Junggar Basin, and the development layer is T1b12 of Triassic Baikouquan Formation. The drilling depth is 3920.4 m. The reservoir porosity, permeability, and oil saturation are 7.5%-12.4%, (0.12-20.00)×10-3 um2 and 45.0%-73.4%, respectively. The elastic modulus, Poisson's ratio and tensile strength are 19.3-24.8 GPa, 0.181-0.201 MPa and 1.0-2.3 MPa respectively. The conglomerate composition is mainly igneous rock, followed by metamorphic rock. The gravel size is mainly medium-size gravel (5-70 mm), and mainly filled with sand, mud or fine gravel between the gravels. The overall reservoir is highly heterogeneous [9⇓-11]. ...
Rock mechanical characteristics and fracture propagation mechanism of sandy conglomerate reservoirs in Baikouquan Formation of Mahu sag
2
2018
... The tight conglomerate reservoirs in Mahu sag, Junggar Basin are fan-delta front deposits with complex lithofacies characteristics, deep burial and high heterogeneity, and extremely difficult to put into production[1⇓-3]. In recent years, great breakthrough has been made in production by using horizontal well volume fracturing [4⇓⇓⇓-8]. In 2020, with the goal of reducing cost and increasing efficiency, multi-cluster + temporary plugging fracturing tests in long horizontal stages of horizontal wells were carried out in this area. However, there was a large difference in post-fracturing effects, and the production of most test wells failed to meet expectations. In order to optimize fracturing process parameters and improve productivity, it is necessary to study the initiation law of artificial fractures. Due to the different mineral composition of gravel and matrix in conglomerate, the rock mechanical properties of them are significantly different, and the conglomerate reservoir has strong mechanical properties heterogeneity [9⇓-11]. Conglomerate characteristics (gravel size, content, sorting, distribution and mechanical properties difference between gravel and matrix, etc.) and horizontal stress difference significantly affect artificial fracture propagation morphology. When hydraulic fractures encounter conglomerates, they may have a variety of behaviors such as penetration, deflection and fracture arrest [12⇓⇓⇓⇓⇓⇓⇓⇓⇓-22]. The hydraulic fracture propagation in conglomerate reservoirs is very complex. ...
... The MaHW26X test well is located in the fault block of well area Ma 18-Aihu 1 of Mahu sag, Junggar Basin, and the development layer is T1b12 of Triassic Baikouquan Formation. The drilling depth is 3920.4 m. The reservoir porosity, permeability, and oil saturation are 7.5%-12.4%, (0.12-20.00)×10-3 um2 and 45.0%-73.4%, respectively. The elastic modulus, Poisson's ratio and tensile strength are 19.3-24.8 GPa, 0.181-0.201 MPa and 1.0-2.3 MPa respectively. The conglomerate composition is mainly igneous rock, followed by metamorphic rock. The gravel size is mainly medium-size gravel (5-70 mm), and mainly filled with sand, mud or fine gravel between the gravels. The overall reservoir is highly heterogeneous [9⇓-11]. ...
Analysis of rock mechanics and assessments of hydraulic fracture network in conglomerate reservoirs of Mahu oilfield
2
2019
... The tight conglomerate reservoirs in Mahu sag, Junggar Basin are fan-delta front deposits with complex lithofacies characteristics, deep burial and high heterogeneity, and extremely difficult to put into production[1⇓-3]. In recent years, great breakthrough has been made in production by using horizontal well volume fracturing [4⇓⇓⇓-8]. In 2020, with the goal of reducing cost and increasing efficiency, multi-cluster + temporary plugging fracturing tests in long horizontal stages of horizontal wells were carried out in this area. However, there was a large difference in post-fracturing effects, and the production of most test wells failed to meet expectations. In order to optimize fracturing process parameters and improve productivity, it is necessary to study the initiation law of artificial fractures. Due to the different mineral composition of gravel and matrix in conglomerate, the rock mechanical properties of them are significantly different, and the conglomerate reservoir has strong mechanical properties heterogeneity [9⇓-11]. Conglomerate characteristics (gravel size, content, sorting, distribution and mechanical properties difference between gravel and matrix, etc.) and horizontal stress difference significantly affect artificial fracture propagation morphology. When hydraulic fractures encounter conglomerates, they may have a variety of behaviors such as penetration, deflection and fracture arrest [12⇓⇓⇓⇓⇓⇓⇓⇓⇓-22]. The hydraulic fracture propagation in conglomerate reservoirs is very complex. ...
... The MaHW26X test well is located in the fault block of well area Ma 18-Aihu 1 of Mahu sag, Junggar Basin, and the development layer is T1b12 of Triassic Baikouquan Formation. The drilling depth is 3920.4 m. The reservoir porosity, permeability, and oil saturation are 7.5%-12.4%, (0.12-20.00)×10-3 um2 and 45.0%-73.4%, respectively. The elastic modulus, Poisson's ratio and tensile strength are 19.3-24.8 GPa, 0.181-0.201 MPa and 1.0-2.3 MPa respectively. The conglomerate composition is mainly igneous rock, followed by metamorphic rock. The gravel size is mainly medium-size gravel (5-70 mm), and mainly filled with sand, mud or fine gravel between the gravels. The overall reservoir is highly heterogeneous [9⇓-11]. ...
Fracture propagating shapes in gravel-supported conglomerate reservoirs of Upper Wuerhe Formation on Manan slope, Mahu sag
1
2021
... The tight conglomerate reservoirs in Mahu sag, Junggar Basin are fan-delta front deposits with complex lithofacies characteristics, deep burial and high heterogeneity, and extremely difficult to put into production[1⇓-3]. In recent years, great breakthrough has been made in production by using horizontal well volume fracturing [4⇓⇓⇓-8]. In 2020, with the goal of reducing cost and increasing efficiency, multi-cluster + temporary plugging fracturing tests in long horizontal stages of horizontal wells were carried out in this area. However, there was a large difference in post-fracturing effects, and the production of most test wells failed to meet expectations. In order to optimize fracturing process parameters and improve productivity, it is necessary to study the initiation law of artificial fractures. Due to the different mineral composition of gravel and matrix in conglomerate, the rock mechanical properties of them are significantly different, and the conglomerate reservoir has strong mechanical properties heterogeneity [9⇓-11]. Conglomerate characteristics (gravel size, content, sorting, distribution and mechanical properties difference between gravel and matrix, etc.) and horizontal stress difference significantly affect artificial fracture propagation morphology. When hydraulic fractures encounter conglomerates, they may have a variety of behaviors such as penetration, deflection and fracture arrest [12⇓⇓⇓⇓⇓⇓⇓⇓⇓-22]. The hydraulic fracture propagation in conglomerate reservoirs is very complex. ...
A primary investigation on propagation mechanism for hydraulic fractures in glutenite formation
1
2010
... The tight conglomerate reservoirs in Mahu sag, Junggar Basin are fan-delta front deposits with complex lithofacies characteristics, deep burial and high heterogeneity, and extremely difficult to put into production[1⇓-3]. In recent years, great breakthrough has been made in production by using horizontal well volume fracturing [4⇓⇓⇓-8]. In 2020, with the goal of reducing cost and increasing efficiency, multi-cluster + temporary plugging fracturing tests in long horizontal stages of horizontal wells were carried out in this area. However, there was a large difference in post-fracturing effects, and the production of most test wells failed to meet expectations. In order to optimize fracturing process parameters and improve productivity, it is necessary to study the initiation law of artificial fractures. Due to the different mineral composition of gravel and matrix in conglomerate, the rock mechanical properties of them are significantly different, and the conglomerate reservoir has strong mechanical properties heterogeneity [9⇓-11]. Conglomerate characteristics (gravel size, content, sorting, distribution and mechanical properties difference between gravel and matrix, etc.) and horizontal stress difference significantly affect artificial fracture propagation morphology. When hydraulic fractures encounter conglomerates, they may have a variety of behaviors such as penetration, deflection and fracture arrest [12⇓⇓⇓⇓⇓⇓⇓⇓⇓-22]. The hydraulic fracture propagation in conglomerate reservoirs is very complex. ...
Fracture pressure and fracture propagation mechanism of the petrophysical facies of glutenite
1
2011
... The tight conglomerate reservoirs in Mahu sag, Junggar Basin are fan-delta front deposits with complex lithofacies characteristics, deep burial and high heterogeneity, and extremely difficult to put into production[1⇓-3]. In recent years, great breakthrough has been made in production by using horizontal well volume fracturing [4⇓⇓⇓-8]. In 2020, with the goal of reducing cost and increasing efficiency, multi-cluster + temporary plugging fracturing tests in long horizontal stages of horizontal wells were carried out in this area. However, there was a large difference in post-fracturing effects, and the production of most test wells failed to meet expectations. In order to optimize fracturing process parameters and improve productivity, it is necessary to study the initiation law of artificial fractures. Due to the different mineral composition of gravel and matrix in conglomerate, the rock mechanical properties of them are significantly different, and the conglomerate reservoir has strong mechanical properties heterogeneity [9⇓-11]. Conglomerate characteristics (gravel size, content, sorting, distribution and mechanical properties difference between gravel and matrix, etc.) and horizontal stress difference significantly affect artificial fracture propagation morphology. When hydraulic fractures encounter conglomerates, they may have a variety of behaviors such as penetration, deflection and fracture arrest [12⇓⇓⇓⇓⇓⇓⇓⇓⇓-22]. The hydraulic fracture propagation in conglomerate reservoirs is very complex. ...
Numerical simulation of propagation of hydraulic fractures in glutenite formation
1
2013
... The tight conglomerate reservoirs in Mahu sag, Junggar Basin are fan-delta front deposits with complex lithofacies characteristics, deep burial and high heterogeneity, and extremely difficult to put into production[1⇓-3]. In recent years, great breakthrough has been made in production by using horizontal well volume fracturing [4⇓⇓⇓-8]. In 2020, with the goal of reducing cost and increasing efficiency, multi-cluster + temporary plugging fracturing tests in long horizontal stages of horizontal wells were carried out in this area. However, there was a large difference in post-fracturing effects, and the production of most test wells failed to meet expectations. In order to optimize fracturing process parameters and improve productivity, it is necessary to study the initiation law of artificial fractures. Due to the different mineral composition of gravel and matrix in conglomerate, the rock mechanical properties of them are significantly different, and the conglomerate reservoir has strong mechanical properties heterogeneity [9⇓-11]. Conglomerate characteristics (gravel size, content, sorting, distribution and mechanical properties difference between gravel and matrix, etc.) and horizontal stress difference significantly affect artificial fracture propagation morphology. When hydraulic fractures encounter conglomerates, they may have a variety of behaviors such as penetration, deflection and fracture arrest [12⇓⇓⇓⇓⇓⇓⇓⇓⇓-22]. The hydraulic fracture propagation in conglomerate reservoirs is very complex. ...
A numerical investigation of the hydraulic fracturing behaviour of conglomerate in glutenite formation
1
2013
... The tight conglomerate reservoirs in Mahu sag, Junggar Basin are fan-delta front deposits with complex lithofacies characteristics, deep burial and high heterogeneity, and extremely difficult to put into production[1⇓-3]. In recent years, great breakthrough has been made in production by using horizontal well volume fracturing [4⇓⇓⇓-8]. In 2020, with the goal of reducing cost and increasing efficiency, multi-cluster + temporary plugging fracturing tests in long horizontal stages of horizontal wells were carried out in this area. However, there was a large difference in post-fracturing effects, and the production of most test wells failed to meet expectations. In order to optimize fracturing process parameters and improve productivity, it is necessary to study the initiation law of artificial fractures. Due to the different mineral composition of gravel and matrix in conglomerate, the rock mechanical properties of them are significantly different, and the conglomerate reservoir has strong mechanical properties heterogeneity [9⇓-11]. Conglomerate characteristics (gravel size, content, sorting, distribution and mechanical properties difference between gravel and matrix, etc.) and horizontal stress difference significantly affect artificial fracture propagation morphology. When hydraulic fractures encounter conglomerates, they may have a variety of behaviors such as penetration, deflection and fracture arrest [12⇓⇓⇓⇓⇓⇓⇓⇓⇓-22]. The hydraulic fracture propagation in conglomerate reservoirs is very complex. ...
Experimental investigation of the effects of heterogeneity and geostress difference on the 3D growth and distribution of hydrofracturing cracks in unconventional reservoir rocks
1
2016
... The tight conglomerate reservoirs in Mahu sag, Junggar Basin are fan-delta front deposits with complex lithofacies characteristics, deep burial and high heterogeneity, and extremely difficult to put into production[1⇓-3]. In recent years, great breakthrough has been made in production by using horizontal well volume fracturing [4⇓⇓⇓-8]. In 2020, with the goal of reducing cost and increasing efficiency, multi-cluster + temporary plugging fracturing tests in long horizontal stages of horizontal wells were carried out in this area. However, there was a large difference in post-fracturing effects, and the production of most test wells failed to meet expectations. In order to optimize fracturing process parameters and improve productivity, it is necessary to study the initiation law of artificial fractures. Due to the different mineral composition of gravel and matrix in conglomerate, the rock mechanical properties of them are significantly different, and the conglomerate reservoir has strong mechanical properties heterogeneity [9⇓-11]. Conglomerate characteristics (gravel size, content, sorting, distribution and mechanical properties difference between gravel and matrix, etc.) and horizontal stress difference significantly affect artificial fracture propagation morphology. When hydraulic fractures encounter conglomerates, they may have a variety of behaviors such as penetration, deflection and fracture arrest [12⇓⇓⇓⇓⇓⇓⇓⇓⇓-22]. The hydraulic fracture propagation in conglomerate reservoirs is very complex. ...
3D reconstruction of low-permeability heterogeneous glutenites and numerical simulation of hydraulic fracturing behavior
1
2016
... The tight conglomerate reservoirs in Mahu sag, Junggar Basin are fan-delta front deposits with complex lithofacies characteristics, deep burial and high heterogeneity, and extremely difficult to put into production[1⇓-3]. In recent years, great breakthrough has been made in production by using horizontal well volume fracturing [4⇓⇓⇓-8]. In 2020, with the goal of reducing cost and increasing efficiency, multi-cluster + temporary plugging fracturing tests in long horizontal stages of horizontal wells were carried out in this area. However, there was a large difference in post-fracturing effects, and the production of most test wells failed to meet expectations. In order to optimize fracturing process parameters and improve productivity, it is necessary to study the initiation law of artificial fractures. Due to the different mineral composition of gravel and matrix in conglomerate, the rock mechanical properties of them are significantly different, and the conglomerate reservoir has strong mechanical properties heterogeneity [9⇓-11]. Conglomerate characteristics (gravel size, content, sorting, distribution and mechanical properties difference between gravel and matrix, etc.) and horizontal stress difference significantly affect artificial fracture propagation morphology. When hydraulic fractures encounter conglomerates, they may have a variety of behaviors such as penetration, deflection and fracture arrest [12⇓⇓⇓⇓⇓⇓⇓⇓⇓-22]. The hydraulic fracture propagation in conglomerate reservoirs is very complex. ...
Experimental study on the propagation mechanism of hydraulic fracture in glutenite formations
1
2017
... The tight conglomerate reservoirs in Mahu sag, Junggar Basin are fan-delta front deposits with complex lithofacies characteristics, deep burial and high heterogeneity, and extremely difficult to put into production[1⇓-3]. In recent years, great breakthrough has been made in production by using horizontal well volume fracturing [4⇓⇓⇓-8]. In 2020, with the goal of reducing cost and increasing efficiency, multi-cluster + temporary plugging fracturing tests in long horizontal stages of horizontal wells were carried out in this area. However, there was a large difference in post-fracturing effects, and the production of most test wells failed to meet expectations. In order to optimize fracturing process parameters and improve productivity, it is necessary to study the initiation law of artificial fractures. Due to the different mineral composition of gravel and matrix in conglomerate, the rock mechanical properties of them are significantly different, and the conglomerate reservoir has strong mechanical properties heterogeneity [9⇓-11]. Conglomerate characteristics (gravel size, content, sorting, distribution and mechanical properties difference between gravel and matrix, etc.) and horizontal stress difference significantly affect artificial fracture propagation morphology. When hydraulic fractures encounter conglomerates, they may have a variety of behaviors such as penetration, deflection and fracture arrest [12⇓⇓⇓⇓⇓⇓⇓⇓⇓-22]. The hydraulic fracture propagation in conglomerate reservoirs is very complex. ...
Experimental study on the mechanism of hydraulic fracture growth in a glutenite reservoir
1
2017
... The tight conglomerate reservoirs in Mahu sag, Junggar Basin are fan-delta front deposits with complex lithofacies characteristics, deep burial and high heterogeneity, and extremely difficult to put into production[1⇓-3]. In recent years, great breakthrough has been made in production by using horizontal well volume fracturing [4⇓⇓⇓-8]. In 2020, with the goal of reducing cost and increasing efficiency, multi-cluster + temporary plugging fracturing tests in long horizontal stages of horizontal wells were carried out in this area. However, there was a large difference in post-fracturing effects, and the production of most test wells failed to meet expectations. In order to optimize fracturing process parameters and improve productivity, it is necessary to study the initiation law of artificial fractures. Due to the different mineral composition of gravel and matrix in conglomerate, the rock mechanical properties of them are significantly different, and the conglomerate reservoir has strong mechanical properties heterogeneity [9⇓-11]. Conglomerate characteristics (gravel size, content, sorting, distribution and mechanical properties difference between gravel and matrix, etc.) and horizontal stress difference significantly affect artificial fracture propagation morphology. When hydraulic fractures encounter conglomerates, they may have a variety of behaviors such as penetration, deflection and fracture arrest [12⇓⇓⇓⇓⇓⇓⇓⇓⇓-22]. The hydraulic fracture propagation in conglomerate reservoirs is very complex. ...
Influence of gravel on the propagation pattern of hydraulic fracture in the glutenite reservoir
1
2018
... The tight conglomerate reservoirs in Mahu sag, Junggar Basin are fan-delta front deposits with complex lithofacies characteristics, deep burial and high heterogeneity, and extremely difficult to put into production[1⇓-3]. In recent years, great breakthrough has been made in production by using horizontal well volume fracturing [4⇓⇓⇓-8]. In 2020, with the goal of reducing cost and increasing efficiency, multi-cluster + temporary plugging fracturing tests in long horizontal stages of horizontal wells were carried out in this area. However, there was a large difference in post-fracturing effects, and the production of most test wells failed to meet expectations. In order to optimize fracturing process parameters and improve productivity, it is necessary to study the initiation law of artificial fractures. Due to the different mineral composition of gravel and matrix in conglomerate, the rock mechanical properties of them are significantly different, and the conglomerate reservoir has strong mechanical properties heterogeneity [9⇓-11]. Conglomerate characteristics (gravel size, content, sorting, distribution and mechanical properties difference between gravel and matrix, etc.) and horizontal stress difference significantly affect artificial fracture propagation morphology. When hydraulic fractures encounter conglomerates, they may have a variety of behaviors such as penetration, deflection and fracture arrest [12⇓⇓⇓⇓⇓⇓⇓⇓⇓-22]. The hydraulic fracture propagation in conglomerate reservoirs is very complex. ...
Study of hydraulic fracture growth behavior in heterogeneous tight sandstone formations using CT scanning and acoustic emission monitoring
1
2019
... The tight conglomerate reservoirs in Mahu sag, Junggar Basin are fan-delta front deposits with complex lithofacies characteristics, deep burial and high heterogeneity, and extremely difficult to put into production[1⇓-3]. In recent years, great breakthrough has been made in production by using horizontal well volume fracturing [4⇓⇓⇓-8]. In 2020, with the goal of reducing cost and increasing efficiency, multi-cluster + temporary plugging fracturing tests in long horizontal stages of horizontal wells were carried out in this area. However, there was a large difference in post-fracturing effects, and the production of most test wells failed to meet expectations. In order to optimize fracturing process parameters and improve productivity, it is necessary to study the initiation law of artificial fractures. Due to the different mineral composition of gravel and matrix in conglomerate, the rock mechanical properties of them are significantly different, and the conglomerate reservoir has strong mechanical properties heterogeneity [9⇓-11]. Conglomerate characteristics (gravel size, content, sorting, distribution and mechanical properties difference between gravel and matrix, etc.) and horizontal stress difference significantly affect artificial fracture propagation morphology. When hydraulic fractures encounter conglomerates, they may have a variety of behaviors such as penetration, deflection and fracture arrest [12⇓⇓⇓⇓⇓⇓⇓⇓⇓-22]. The hydraulic fracture propagation in conglomerate reservoirs is very complex. ...
A practical guide to hydraulic fracture diagnostic technologies
1
2002
... Hydraulic fracture field monitoring technique is an effective method for understanding the artificial fracture morphology, including indirect monitoring technology and direct monitoring technology. The indirect monitoring technique includes net pressure analysis, well testing, production analysis, etc. The direct monitoring technology is composed of near-borehole zone monitoring technology and far-field zone monitoring technology. The near-borehole zone monitoring technology includes radioactive tracer, well temperature logging, well diameter logging, fiber optic monitoring (DTS/DAS), downhole video imaging, etc. [23⇓⇓⇓⇓⇓⇓⇓-31]. The far-field zone monitoring technology includes microseismic monitoring, surface inclinometer monitoring, downhole inclination image monitoring in surrounding wells, deep shear wave imaging monitoring (DSWI), etc. [32-33]. With the downhole video imaging technology, we can directly obtain a large number of high-definition perforation images, and the degree of erosion can be reflected by calculating the erosion area of the perforation (the change in perforation area before and after fracturing). It has been found statistically that the degree of erosion is positively correlated with the volume of proppant in the perforation [27-28]. ...
Improved well stimulation through the application of downhole video analytics
3
2018
... Hydraulic fracture field monitoring technique is an effective method for understanding the artificial fracture morphology, including indirect monitoring technology and direct monitoring technology. The indirect monitoring technique includes net pressure analysis, well testing, production analysis, etc. The direct monitoring technology is composed of near-borehole zone monitoring technology and far-field zone monitoring technology. The near-borehole zone monitoring technology includes radioactive tracer, well temperature logging, well diameter logging, fiber optic monitoring (DTS/DAS), downhole video imaging, etc. [23⇓⇓⇓⇓⇓⇓⇓-31]. The far-field zone monitoring technology includes microseismic monitoring, surface inclinometer monitoring, downhole inclination image monitoring in surrounding wells, deep shear wave imaging monitoring (DSWI), etc. [32-33]. With the downhole video imaging technology, we can directly obtain a large number of high-definition perforation images, and the degree of erosion can be reflected by calculating the erosion area of the perforation (the change in perforation area before and after fracturing). It has been found statistically that the degree of erosion is positively correlated with the volume of proppant in the perforation [27-28]. ...
... With perforation imaging monitoring technology, also known as downhole video imaging technology, we can obtain a large number of perforation images by running a special camera along the casing to the perforated section[24]. In the test well, we used a downhole video imaging technology by array loop scanning that provided 360° continuous measurement with data transfer rate of up to 25 frames per second, effectively identifying relatively small perforations. In addition, the technology was accompanied by digital image analysis software, which can calculate accurately the area of irregular perforations. ...
... The test well MaHW26X and most horizontal wells in North America have a small number of perforations in single cluster. Therefore, the perforation friction and perforation erosion have important influence on fluid distribution and fracture initiation of multi-clusters. The test well was compared with perforation erosion in North America. First of all, in terms of reservoir properties, the reservoirs in North America are mainly shale reservoirs, while the Mahu Oilfield is mainly conglomerate reservoirs, which have stronger heterogeneity and are more prone to have non-uniform initiation of fractures. Second, in terms of fracturing parameters, the horizontal wells in North America are more than 10 clusters at a stage with 4-5 m cluster spacing, while the test well is 6 clusters in each stage with 11-18 m cluster spacing. Downhole video imaging in North America showed that there were “heel bias” and “phase bias” of perforation erosion, and the perforation erosion area was positively correlated with proppant volume pumped, as shown in Fig. 8 [24⇓⇓⇓⇓⇓-30,43]. The fracturing parameters of the test well MaHW26X and horizontal wells in North America are shown in Table 3. ...
Integrating DAS, treatment pressure analysis and video-based perforation imaging to evaluate limited entry treatment effectiveness
3
2019
... Hydraulic fracture field monitoring technique is an effective method for understanding the artificial fracture morphology, including indirect monitoring technology and direct monitoring technology. The indirect monitoring technique includes net pressure analysis, well testing, production analysis, etc. The direct monitoring technology is composed of near-borehole zone monitoring technology and far-field zone monitoring technology. The near-borehole zone monitoring technology includes radioactive tracer, well temperature logging, well diameter logging, fiber optic monitoring (DTS/DAS), downhole video imaging, etc. [23⇓⇓⇓⇓⇓⇓⇓-31]. The far-field zone monitoring technology includes microseismic monitoring, surface inclinometer monitoring, downhole inclination image monitoring in surrounding wells, deep shear wave imaging monitoring (DSWI), etc. [32-33]. With the downhole video imaging technology, we can directly obtain a large number of high-definition perforation images, and the degree of erosion can be reflected by calculating the erosion area of the perforation (the change in perforation area before and after fracturing). It has been found statistically that the degree of erosion is positively correlated with the volume of proppant in the perforation [27-28]. ...
... The test well MaHW26X and most horizontal wells in North America have a small number of perforations in single cluster. Therefore, the perforation friction and perforation erosion have important influence on fluid distribution and fracture initiation of multi-clusters. The test well was compared with perforation erosion in North America. First of all, in terms of reservoir properties, the reservoirs in North America are mainly shale reservoirs, while the Mahu Oilfield is mainly conglomerate reservoirs, which have stronger heterogeneity and are more prone to have non-uniform initiation of fractures. Second, in terms of fracturing parameters, the horizontal wells in North America are more than 10 clusters at a stage with 4-5 m cluster spacing, while the test well is 6 clusters in each stage with 11-18 m cluster spacing. Downhole video imaging in North America showed that there were “heel bias” and “phase bias” of perforation erosion, and the perforation erosion area was positively correlated with proppant volume pumped, as shown in Fig. 8 [24⇓⇓⇓⇓⇓-30,43]. The fracturing parameters of the test well MaHW26X and horizontal wells in North America are shown in Table 3. ...
... Fracturing parameters of the test well and horizontal wells in North America
| Data sources | Injection rate/
(m3·min-1) | The fluid volume
in single stage/m3 | The proppant volume in single stage | Stage
spacing/
m | Cluster spacing/
m | The number of clusters in single stage | The number of perforations in single cluster | Perforation erosion degree/
% | The percentage of stages with heel bias/% |
Test well MaHW26X in
Mahu conglomerate
reservoir | 9.3-11.2 | 2 183.2-
3 567.3 | 60.0-
180.0 m3 | 77.3-80.4 | 11.0-18.0 | 6 | 3-8 | 15-352 | 60 |
A shale reservoir in
North America [25] | 13.5 | 1 223.0 | 3.0 t/m | 53.4 | 10.7 | 5 | 4-6 | 5-17 | 83 |
Wolfcamp shale
reservoir [43] | 12.0-15.0 | | 1.7-2.7 t/m | 60.0-80.0 | | 3-5 | | 50-120 | 66 |
Eagle Ford shale
reservoir [30] | | | | 60.0-105.0 | 4.5-6.0 | 10-23 | 1-12 | | 77 |
The difference and similarity of perforation erosion between the test well MaHW26X and horizontal wells in North America are as follows. ...
2
2021
... Hydraulic fracture field monitoring technique is an effective method for understanding the artificial fracture morphology, including indirect monitoring technology and direct monitoring technology. The indirect monitoring technique includes net pressure analysis, well testing, production analysis, etc. The direct monitoring technology is composed of near-borehole zone monitoring technology and far-field zone monitoring technology. The near-borehole zone monitoring technology includes radioactive tracer, well temperature logging, well diameter logging, fiber optic monitoring (DTS/DAS), downhole video imaging, etc. [23⇓⇓⇓⇓⇓⇓⇓-31]. The far-field zone monitoring technology includes microseismic monitoring, surface inclinometer monitoring, downhole inclination image monitoring in surrounding wells, deep shear wave imaging monitoring (DSWI), etc. [32-33]. With the downhole video imaging technology, we can directly obtain a large number of high-definition perforation images, and the degree of erosion can be reflected by calculating the erosion area of the perforation (the change in perforation area before and after fracturing). It has been found statistically that the degree of erosion is positively correlated with the volume of proppant in the perforation [27-28]. ...
... The test well MaHW26X and most horizontal wells in North America have a small number of perforations in single cluster. Therefore, the perforation friction and perforation erosion have important influence on fluid distribution and fracture initiation of multi-clusters. The test well was compared with perforation erosion in North America. First of all, in terms of reservoir properties, the reservoirs in North America are mainly shale reservoirs, while the Mahu Oilfield is mainly conglomerate reservoirs, which have stronger heterogeneity and are more prone to have non-uniform initiation of fractures. Second, in terms of fracturing parameters, the horizontal wells in North America are more than 10 clusters at a stage with 4-5 m cluster spacing, while the test well is 6 clusters in each stage with 11-18 m cluster spacing. Downhole video imaging in North America showed that there were “heel bias” and “phase bias” of perforation erosion, and the perforation erosion area was positively correlated with proppant volume pumped, as shown in Fig. 8 [24⇓⇓⇓⇓⇓-30,43]. The fracturing parameters of the test well MaHW26X and horizontal wells in North America are shown in Table 3. ...
A novel hydraulic fracture evaluation method using downhole video images to analyse perforation erosion
4
2018
... Hydraulic fracture field monitoring technique is an effective method for understanding the artificial fracture morphology, including indirect monitoring technology and direct monitoring technology. The indirect monitoring technique includes net pressure analysis, well testing, production analysis, etc. The direct monitoring technology is composed of near-borehole zone monitoring technology and far-field zone monitoring technology. The near-borehole zone monitoring technology includes radioactive tracer, well temperature logging, well diameter logging, fiber optic monitoring (DTS/DAS), downhole video imaging, etc. [23⇓⇓⇓⇓⇓⇓⇓-31]. The far-field zone monitoring technology includes microseismic monitoring, surface inclinometer monitoring, downhole inclination image monitoring in surrounding wells, deep shear wave imaging monitoring (DSWI), etc. [32-33]. With the downhole video imaging technology, we can directly obtain a large number of high-definition perforation images, and the degree of erosion can be reflected by calculating the erosion area of the perforation (the change in perforation area before and after fracturing). It has been found statistically that the degree of erosion is positively correlated with the volume of proppant in the perforation [27-28]. ...
... [27-28]. ...
... The total eroded perforation area of the fracturing stage was positively correlated with the proppant volume added [27]. Data of proppant volume and erosion area of each stage are shown in Table 2. ...
... The test well MaHW26X and most horizontal wells in North America have a small number of perforations in single cluster. Therefore, the perforation friction and perforation erosion have important influence on fluid distribution and fracture initiation of multi-clusters. The test well was compared with perforation erosion in North America. First of all, in terms of reservoir properties, the reservoirs in North America are mainly shale reservoirs, while the Mahu Oilfield is mainly conglomerate reservoirs, which have stronger heterogeneity and are more prone to have non-uniform initiation of fractures. Second, in terms of fracturing parameters, the horizontal wells in North America are more than 10 clusters at a stage with 4-5 m cluster spacing, while the test well is 6 clusters in each stage with 11-18 m cluster spacing. Downhole video imaging in North America showed that there were “heel bias” and “phase bias” of perforation erosion, and the perforation erosion area was positively correlated with proppant volume pumped, as shown in Fig. 8 [24⇓⇓⇓⇓⇓-30,43]. The fracturing parameters of the test well MaHW26X and horizontal wells in North America are shown in Table 3. ...
Proppant distribution observations from 20,000+ perforation erosion measurements
3
2020
... Hydraulic fracture field monitoring technique is an effective method for understanding the artificial fracture morphology, including indirect monitoring technology and direct monitoring technology. The indirect monitoring technique includes net pressure analysis, well testing, production analysis, etc. The direct monitoring technology is composed of near-borehole zone monitoring technology and far-field zone monitoring technology. The near-borehole zone monitoring technology includes radioactive tracer, well temperature logging, well diameter logging, fiber optic monitoring (DTS/DAS), downhole video imaging, etc. [23⇓⇓⇓⇓⇓⇓⇓-31]. The far-field zone monitoring technology includes microseismic monitoring, surface inclinometer monitoring, downhole inclination image monitoring in surrounding wells, deep shear wave imaging monitoring (DSWI), etc. [32-33]. With the downhole video imaging technology, we can directly obtain a large number of high-definition perforation images, and the degree of erosion can be reflected by calculating the erosion area of the perforation (the change in perforation area before and after fracturing). It has been found statistically that the degree of erosion is positively correlated with the volume of proppant in the perforation [27-28]. ...
... -28]. ...
... The test well MaHW26X and most horizontal wells in North America have a small number of perforations in single cluster. Therefore, the perforation friction and perforation erosion have important influence on fluid distribution and fracture initiation of multi-clusters. The test well was compared with perforation erosion in North America. First of all, in terms of reservoir properties, the reservoirs in North America are mainly shale reservoirs, while the Mahu Oilfield is mainly conglomerate reservoirs, which have stronger heterogeneity and are more prone to have non-uniform initiation of fractures. Second, in terms of fracturing parameters, the horizontal wells in North America are more than 10 clusters at a stage with 4-5 m cluster spacing, while the test well is 6 clusters in each stage with 11-18 m cluster spacing. Downhole video imaging in North America showed that there were “heel bias” and “phase bias” of perforation erosion, and the perforation erosion area was positively correlated with proppant volume pumped, as shown in Fig. 8 [24⇓⇓⇓⇓⇓-30,43]. The fracturing parameters of the test well MaHW26X and horizontal wells in North America are shown in Table 3. ...
Perforation cluster efficiency of cemented plug and perf limited entry completions: Insights from fiber optics diagnostics
2
2016
... Hydraulic fracture field monitoring technique is an effective method for understanding the artificial fracture morphology, including indirect monitoring technology and direct monitoring technology. The indirect monitoring technique includes net pressure analysis, well testing, production analysis, etc. The direct monitoring technology is composed of near-borehole zone monitoring technology and far-field zone monitoring technology. The near-borehole zone monitoring technology includes radioactive tracer, well temperature logging, well diameter logging, fiber optic monitoring (DTS/DAS), downhole video imaging, etc. [23⇓⇓⇓⇓⇓⇓⇓-31]. The far-field zone monitoring technology includes microseismic monitoring, surface inclinometer monitoring, downhole inclination image monitoring in surrounding wells, deep shear wave imaging monitoring (DSWI), etc. [32-33]. With the downhole video imaging technology, we can directly obtain a large number of high-definition perforation images, and the degree of erosion can be reflected by calculating the erosion area of the perforation (the change in perforation area before and after fracturing). It has been found statistically that the degree of erosion is positively correlated with the volume of proppant in the perforation [27-28]. ...
... The test well MaHW26X and most horizontal wells in North America have a small number of perforations in single cluster. Therefore, the perforation friction and perforation erosion have important influence on fluid distribution and fracture initiation of multi-clusters. The test well was compared with perforation erosion in North America. First of all, in terms of reservoir properties, the reservoirs in North America are mainly shale reservoirs, while the Mahu Oilfield is mainly conglomerate reservoirs, which have stronger heterogeneity and are more prone to have non-uniform initiation of fractures. Second, in terms of fracturing parameters, the horizontal wells in North America are more than 10 clusters at a stage with 4-5 m cluster spacing, while the test well is 6 clusters in each stage with 11-18 m cluster spacing. Downhole video imaging in North America showed that there were “heel bias” and “phase bias” of perforation erosion, and the perforation erosion area was positively correlated with proppant volume pumped, as shown in Fig. 8 [24⇓⇓⇓⇓⇓-30,43]. The fracturing parameters of the test well MaHW26X and horizontal wells in North America are shown in Table 3. ...
Proppant distribution in newly completed and re-fractured wells: An Eagle Ford shale case study
3
2021
... Hydraulic fracture field monitoring technique is an effective method for understanding the artificial fracture morphology, including indirect monitoring technology and direct monitoring technology. The indirect monitoring technique includes net pressure analysis, well testing, production analysis, etc. The direct monitoring technology is composed of near-borehole zone monitoring technology and far-field zone monitoring technology. The near-borehole zone monitoring technology includes radioactive tracer, well temperature logging, well diameter logging, fiber optic monitoring (DTS/DAS), downhole video imaging, etc. [23⇓⇓⇓⇓⇓⇓⇓-31]. The far-field zone monitoring technology includes microseismic monitoring, surface inclinometer monitoring, downhole inclination image monitoring in surrounding wells, deep shear wave imaging monitoring (DSWI), etc. [32-33]. With the downhole video imaging technology, we can directly obtain a large number of high-definition perforation images, and the degree of erosion can be reflected by calculating the erosion area of the perforation (the change in perforation area before and after fracturing). It has been found statistically that the degree of erosion is positively correlated with the volume of proppant in the perforation [27-28]. ...
... The test well MaHW26X and most horizontal wells in North America have a small number of perforations in single cluster. Therefore, the perforation friction and perforation erosion have important influence on fluid distribution and fracture initiation of multi-clusters. The test well was compared with perforation erosion in North America. First of all, in terms of reservoir properties, the reservoirs in North America are mainly shale reservoirs, while the Mahu Oilfield is mainly conglomerate reservoirs, which have stronger heterogeneity and are more prone to have non-uniform initiation of fractures. Second, in terms of fracturing parameters, the horizontal wells in North America are more than 10 clusters at a stage with 4-5 m cluster spacing, while the test well is 6 clusters in each stage with 11-18 m cluster spacing. Downhole video imaging in North America showed that there were “heel bias” and “phase bias” of perforation erosion, and the perforation erosion area was positively correlated with proppant volume pumped, as shown in Fig. 8 [24⇓⇓⇓⇓⇓-30,43]. The fracturing parameters of the test well MaHW26X and horizontal wells in North America are shown in Table 3. ...
... Fracturing parameters of the test well and horizontal wells in North America
| Data sources | Injection rate/
(m3·min-1) | The fluid volume
in single stage/m3 | The proppant volume in single stage | Stage
spacing/
m | Cluster spacing/
m | The number of clusters in single stage | The number of perforations in single cluster | Perforation erosion degree/
% | The percentage of stages with heel bias/% |
Test well MaHW26X in
Mahu conglomerate
reservoir | 9.3-11.2 | 2 183.2-
3 567.3 | 60.0-
180.0 m3 | 77.3-80.4 | 11.0-18.0 | 6 | 3-8 | 15-352 | 60 |
A shale reservoir in
North America [25] | 13.5 | 1 223.0 | 3.0 t/m | 53.4 | 10.7 | 5 | 4-6 | 5-17 | 83 |
Wolfcamp shale
reservoir [43] | 12.0-15.0 | | 1.7-2.7 t/m | 60.0-80.0 | | 3-5 | | 50-120 | 66 |
Eagle Ford shale
reservoir [30] | | | | 60.0-105.0 | 4.5-6.0 | 10-23 | 1-12 | | 77 |
The difference and similarity of perforation erosion between the test well MaHW26X and horizontal wells in North America are as follows. ...
A cost-effective evaluation of pods diversion effectiveness using fiber optics DAS and DTS
1
2020
... Hydraulic fracture field monitoring technique is an effective method for understanding the artificial fracture morphology, including indirect monitoring technology and direct monitoring technology. The indirect monitoring technique includes net pressure analysis, well testing, production analysis, etc. The direct monitoring technology is composed of near-borehole zone monitoring technology and far-field zone monitoring technology. The near-borehole zone monitoring technology includes radioactive tracer, well temperature logging, well diameter logging, fiber optic monitoring (DTS/DAS), downhole video imaging, etc. [23⇓⇓⇓⇓⇓⇓⇓-31]. The far-field zone monitoring technology includes microseismic monitoring, surface inclinometer monitoring, downhole inclination image monitoring in surrounding wells, deep shear wave imaging monitoring (DSWI), etc. [32-33]. With the downhole video imaging technology, we can directly obtain a large number of high-definition perforation images, and the degree of erosion can be reflected by calculating the erosion area of the perforation (the change in perforation area before and after fracturing). It has been found statistically that the degree of erosion is positively correlated with the volume of proppant in the perforation [27-28]. ...
A novel technology for hydraulic fracture diagnostics in the vicinity and beyond the wellbore
1
2019
... Hydraulic fracture field monitoring technique is an effective method for understanding the artificial fracture morphology, including indirect monitoring technology and direct monitoring technology. The indirect monitoring technique includes net pressure analysis, well testing, production analysis, etc. The direct monitoring technology is composed of near-borehole zone monitoring technology and far-field zone monitoring technology. The near-borehole zone monitoring technology includes radioactive tracer, well temperature logging, well diameter logging, fiber optic monitoring (DTS/DAS), downhole video imaging, etc. [23⇓⇓⇓⇓⇓⇓⇓-31]. The far-field zone monitoring technology includes microseismic monitoring, surface inclinometer monitoring, downhole inclination image monitoring in surrounding wells, deep shear wave imaging monitoring (DSWI), etc. [32-33]. With the downhole video imaging technology, we can directly obtain a large number of high-definition perforation images, and the degree of erosion can be reflected by calculating the erosion area of the perforation (the change in perforation area before and after fracturing). It has been found statistically that the degree of erosion is positively correlated with the volume of proppant in the perforation [27-28]. ...
Evaluation of the influence of horizontal well orientation of shale gas on stimulation and production effect based on tilt-meter fracture diagnostic technology: A case study of Chang-Ning shale gas demonstration area in Sichuan Basin, China
1
2020
... Hydraulic fracture field monitoring technique is an effective method for understanding the artificial fracture morphology, including indirect monitoring technology and direct monitoring technology. The indirect monitoring technique includes net pressure analysis, well testing, production analysis, etc. The direct monitoring technology is composed of near-borehole zone monitoring technology and far-field zone monitoring technology. The near-borehole zone monitoring technology includes radioactive tracer, well temperature logging, well diameter logging, fiber optic monitoring (DTS/DAS), downhole video imaging, etc. [23⇓⇓⇓⇓⇓⇓⇓-31]. The far-field zone monitoring technology includes microseismic monitoring, surface inclinometer monitoring, downhole inclination image monitoring in surrounding wells, deep shear wave imaging monitoring (DSWI), etc. [32-33]. With the downhole video imaging technology, we can directly obtain a large number of high-definition perforation images, and the degree of erosion can be reflected by calculating the erosion area of the perforation (the change in perforation area before and after fracturing). It has been found statistically that the degree of erosion is positively correlated with the volume of proppant in the perforation [27-28]. ...
Mechanisms of simultaneous hydraulic-fracture propagation from multiple perforation clusters in horizontal wells
1
2016
... In the process of staged and multi-cluster fracturing of horizontal wells, multi-fractures often appear non-uniform initiation and propagation, which is directly caused by the unbalanced fluid distribution of each cluster. Scholars have conducted a large number of numerical simulation studies on the mechanism of multi-fracture initiation and propagation. They pointed out that the non-uniform propagation of multi-fractures was not only affected by reservoir heterogeneity and stress interference, but also by perforation friction. Improving perforation friction can promote the uniform initiation and propagation of fractures [34-35]. However, these studies generally assumed that the perforation friction is constant during fracturing, and ignored the effect of perforation erosion on the perforation friction. ...
Numerical simulation of multi-stage fracturing and optimization of perforation in a horizontal well
1
2017
... In the process of staged and multi-cluster fracturing of horizontal wells, multi-fractures often appear non-uniform initiation and propagation, which is directly caused by the unbalanced fluid distribution of each cluster. Scholars have conducted a large number of numerical simulation studies on the mechanism of multi-fracture initiation and propagation. They pointed out that the non-uniform propagation of multi-fractures was not only affected by reservoir heterogeneity and stress interference, but also by perforation friction. Improving perforation friction can promote the uniform initiation and propagation of fractures [34-35]. However, these studies generally assumed that the perforation friction is constant during fracturing, and ignored the effect of perforation erosion on the perforation friction. ...
Effects of perforation-entry friction on bottomhole treating analysis
2
1988
... Crump et al. [36] obtained the calculation formula of perforation friction based on Bernoulli equation and mass conservation equation, as shown in Eq. (1). In addition, the experimental results showed that the perforation erosion can be divided into two stages: at the first stage, the perforation edge was gradually smooth, but the perforation diameter didn’t increase significantly, and the perforation discharge coefficient (Cp) played a leading role in reducing the perforation friction. At the second stage, Cp was relatively constant, and the perforation diameter increased slowly, leading to further reduction of the perforation friction. For intact perforations, Cp was 0.5-0.6, and for fully worn perforations, Cp was 0.95. According to Eq. (1), the variation curve of perforation friction with perforation diameter of single cluster under different number of perforations was drawn (Fig. 1), where fluid density was 1000 kg/m3, injection rate of single cluster was 0.04 m3/s, the perforation diameter was 10-12 mm, the number of perforations was 3-12, and discharge coefficient was 0.7. ...
... Based on downhole video imaging technology, we found that the perforation erosion in the test well can be divided into two stages (Fig. 2). Firstly, the perforation edge became smooth but the perforation area didn’t increase significantly when the proppant volume was less. Second, the perforation became irregular, and the perforation area increased significantly when the proppant volume was larger, which confirmed the research conclusion of Crump et al.[36]. ...
Modeling of perforation erosion for hydraulic fracturing applications
3
2015
... When there are enough perforations, the perforation friction can be regarded as a small constant, and the fluid distribution is mainly determined by the friction in the fracture. The influence of the non-uniform erosion on the fluid distribution is not obvious. When the number of perforations is small, the friction of perforations is large and plays a leading role in fluid distribution, while the perforation friction is very sensitive to the change of the perforation diameter. For example, an increase of 2 mm in perforation diameter can lead to a reduction of about 15 MPa in perforation friction when the number of perforations is 3 (Fig. 1). At this time, the non-uniform erosion of perforations will have a significant influence on flow distribution, and then change the uniformity of multi-fracture initiation. Long et al. [37] proposed a relationship between perforation diameter and discharge coefficient, proppant concentration and flow rate, as perforation diameter and discharge coefficient increased continuously, and the degree of perforation erosion was related to the kinetic energy of proppant: ...
... Eq. (5) indicates that the greater the flow rate, the greater the degree of perforation erosion. By calculating the dynamic change of perforation diameter and discharge coefficient, the dynamic perforation friction under the action of erosion can be obtained. Therefore, some scholars established a multi-fracture propagation model considering the effect of perforation erosion based on the erosion model proposed by Long et al. [37⇓-39], and found that there was non-uniform erosion in perforations on each cluster, the perforation diameter of the dominant cluster increased rapidly, and the proportion of fluid flow distribution increased further. However, the perforation diameter of inferior clusters increased slowly, or even did not increase, and the proportion of fluid flow distribution decreased further. Therefore, the effect of perforation erosion aggravated the disequilibrium degree of fluid distribution and leaded to the disequilibrium of initiation and propagation of multi-fractures. The influence of perforation erosion on the initiation and propagation of multi-fractures can be obtained by numerical simulation, but it is difficult to accurately reflect the actual situation of perforation erosion. Since the erosion degree of perforations is positively correlated with the injected proppant volume, and the proppant volume of each cluster can reflect the uniformity of multi-fracture initiation, this paper directly compares the erosion degree of each perforation through downhole video imaging technology to reflect the uniformity of multi-fracture initiation. ...
... The linear fitting of the fitted proppant volume and the erosion area at each stage (Fig. 6) shows that the correlation is as high as 94.2%, proving that there is indeed a good positive correlation between the two. This is also consistent with the numerical simulation results. That is, the greater the degree of perforations erosion, the more fluid flow and proppant volume [37⇓-39], which also shows that the hypothesis of plug movement is valid. ...
Influence of perforation erosion on multiple growing hydraulic fractures in multistage fracturing
2
2017
... Eq. (5) indicates that the greater the flow rate, the greater the degree of perforation erosion. By calculating the dynamic change of perforation diameter and discharge coefficient, the dynamic perforation friction under the action of erosion can be obtained. Therefore, some scholars established a multi-fracture propagation model considering the effect of perforation erosion based on the erosion model proposed by Long et al. [37⇓-39], and found that there was non-uniform erosion in perforations on each cluster, the perforation diameter of the dominant cluster increased rapidly, and the proportion of fluid flow distribution increased further. However, the perforation diameter of inferior clusters increased slowly, or even did not increase, and the proportion of fluid flow distribution decreased further. Therefore, the effect of perforation erosion aggravated the disequilibrium degree of fluid distribution and leaded to the disequilibrium of initiation and propagation of multi-fractures. The influence of perforation erosion on the initiation and propagation of multi-fractures can be obtained by numerical simulation, but it is difficult to accurately reflect the actual situation of perforation erosion. Since the erosion degree of perforations is positively correlated with the injected proppant volume, and the proppant volume of each cluster can reflect the uniformity of multi-fracture initiation, this paper directly compares the erosion degree of each perforation through downhole video imaging technology to reflect the uniformity of multi-fracture initiation. ...
... The linear fitting of the fitted proppant volume and the erosion area at each stage (Fig. 6) shows that the correlation is as high as 94.2%, proving that there is indeed a good positive correlation between the two. This is also consistent with the numerical simulation results. That is, the greater the degree of perforations erosion, the more fluid flow and proppant volume [37⇓-39], which also shows that the hypothesis of plug movement is valid. ...
The effects of perforation erosion on practical hydraulic-fracturing applications
2
2017
... Eq. (5) indicates that the greater the flow rate, the greater the degree of perforation erosion. By calculating the dynamic change of perforation diameter and discharge coefficient, the dynamic perforation friction under the action of erosion can be obtained. Therefore, some scholars established a multi-fracture propagation model considering the effect of perforation erosion based on the erosion model proposed by Long et al. [37⇓-39], and found that there was non-uniform erosion in perforations on each cluster, the perforation diameter of the dominant cluster increased rapidly, and the proportion of fluid flow distribution increased further. However, the perforation diameter of inferior clusters increased slowly, or even did not increase, and the proportion of fluid flow distribution decreased further. Therefore, the effect of perforation erosion aggravated the disequilibrium degree of fluid distribution and leaded to the disequilibrium of initiation and propagation of multi-fractures. The influence of perforation erosion on the initiation and propagation of multi-fractures can be obtained by numerical simulation, but it is difficult to accurately reflect the actual situation of perforation erosion. Since the erosion degree of perforations is positively correlated with the injected proppant volume, and the proppant volume of each cluster can reflect the uniformity of multi-fracture initiation, this paper directly compares the erosion degree of each perforation through downhole video imaging technology to reflect the uniformity of multi-fracture initiation. ...
... The linear fitting of the fitted proppant volume and the erosion area at each stage (Fig. 6) shows that the correlation is as high as 94.2%, proving that there is indeed a good positive correlation between the two. This is also consistent with the numerical simulation results. That is, the greater the degree of perforations erosion, the more fluid flow and proppant volume [37⇓-39], which also shows that the hypothesis of plug movement is valid. ...
Composite temporary plugging technology for improving opening degree of multi-cluster fracturing in horizontal well sections
1
2019
... The common methods for judging the effectiveness of temporary plugging fracturing are as follows: when the operation pressure increased after temporary plugging at the same injection rate, or when the injection rate was lower than that before temporary plugging, the operation pressure remained unchanged or increased after temporary plugging, which qualitatively indicates that temporary plugging was effective [40⇓-42]. By combining the pumping pressure curves before and after temporary plugging (Fig. 7), the variation range of operation pressure, injection rate and other parameters can be determined, and then the effectiveness of temporary plugging fracturing can be judged. As shown in Fig. 7, the operation pressure after temporary plugging is significantly increased at almost the same injection rate, and the positive differential pressure (the operation pressure increases after temporary plugging) is dominant, indicating that temporary plugging fracturing is effective. Three stages of temporary plugging fracturing were analyzed by the above method, and the results show that temporary plugging fracturing is effective in all stages. However, this method is to judge the effectiveness of temporary plugging fracturing qualitatively, and it mainly reflects whether the temporary plugging material has blocked up the large perforations or fractures, but does not accurately reflect the stimulated uniformity of each cluster. Therefore, based on the monitoring data of perforation imaging, the variance coefficient of eroded perforation area of each stage of temporary plugging fracturing was calculated to reflect quantitatively the effective of temporary plugging fracturing. The smaller the variance coefficient is, the more uniform the eroded perforation area of each cluster is. In other words, the more uniform the fluid and proppant distributed in each cluster is, the higher the effectiveness of temporary plugging fracturing is. ...
Innovative diversion technology ensures uniform stimulation treatments and enhances gas production: Example from carbonate and sandstone reservoirs
1
2017
... The common methods for judging the effectiveness of temporary plugging fracturing are as follows: when the operation pressure increased after temporary plugging at the same injection rate, or when the injection rate was lower than that before temporary plugging, the operation pressure remained unchanged or increased after temporary plugging, which qualitatively indicates that temporary plugging was effective [40⇓-42]. By combining the pumping pressure curves before and after temporary plugging (Fig. 7), the variation range of operation pressure, injection rate and other parameters can be determined, and then the effectiveness of temporary plugging fracturing can be judged. As shown in Fig. 7, the operation pressure after temporary plugging is significantly increased at almost the same injection rate, and the positive differential pressure (the operation pressure increases after temporary plugging) is dominant, indicating that temporary plugging fracturing is effective. Three stages of temporary plugging fracturing were analyzed by the above method, and the results show that temporary plugging fracturing is effective in all stages. However, this method is to judge the effectiveness of temporary plugging fracturing qualitatively, and it mainly reflects whether the temporary plugging material has blocked up the large perforations or fractures, but does not accurately reflect the stimulated uniformity of each cluster. Therefore, based on the monitoring data of perforation imaging, the variance coefficient of eroded perforation area of each stage of temporary plugging fracturing was calculated to reflect quantitatively the effective of temporary plugging fracturing. The smaller the variance coefficient is, the more uniform the eroded perforation area of each cluster is. In other words, the more uniform the fluid and proppant distributed in each cluster is, the higher the effectiveness of temporary plugging fracturing is. ...
Mining the Bakken: Driving cluster efficiency higher using particulate diverters
1
2017
... The common methods for judging the effectiveness of temporary plugging fracturing are as follows: when the operation pressure increased after temporary plugging at the same injection rate, or when the injection rate was lower than that before temporary plugging, the operation pressure remained unchanged or increased after temporary plugging, which qualitatively indicates that temporary plugging was effective [40⇓-42]. By combining the pumping pressure curves before and after temporary plugging (Fig. 7), the variation range of operation pressure, injection rate and other parameters can be determined, and then the effectiveness of temporary plugging fracturing can be judged. As shown in Fig. 7, the operation pressure after temporary plugging is significantly increased at almost the same injection rate, and the positive differential pressure (the operation pressure increases after temporary plugging) is dominant, indicating that temporary plugging fracturing is effective. Three stages of temporary plugging fracturing were analyzed by the above method, and the results show that temporary plugging fracturing is effective in all stages. However, this method is to judge the effectiveness of temporary plugging fracturing qualitatively, and it mainly reflects whether the temporary plugging material has blocked up the large perforations or fractures, but does not accurately reflect the stimulated uniformity of each cluster. Therefore, based on the monitoring data of perforation imaging, the variance coefficient of eroded perforation area of each stage of temporary plugging fracturing was calculated to reflect quantitatively the effective of temporary plugging fracturing. The smaller the variance coefficient is, the more uniform the eroded perforation area of each cluster is. In other words, the more uniform the fluid and proppant distributed in each cluster is, the higher the effectiveness of temporary plugging fracturing is. ...
Evaluating limited entry perforating & diverter completion techniques with ultrasonic perforation imaging & fiber optic DTS warmbacks
2
2020
... The test well MaHW26X and most horizontal wells in North America have a small number of perforations in single cluster. Therefore, the perforation friction and perforation erosion have important influence on fluid distribution and fracture initiation of multi-clusters. The test well was compared with perforation erosion in North America. First of all, in terms of reservoir properties, the reservoirs in North America are mainly shale reservoirs, while the Mahu Oilfield is mainly conglomerate reservoirs, which have stronger heterogeneity and are more prone to have non-uniform initiation of fractures. Second, in terms of fracturing parameters, the horizontal wells in North America are more than 10 clusters at a stage with 4-5 m cluster spacing, while the test well is 6 clusters in each stage with 11-18 m cluster spacing. Downhole video imaging in North America showed that there were “heel bias” and “phase bias” of perforation erosion, and the perforation erosion area was positively correlated with proppant volume pumped, as shown in Fig. 8 [24⇓⇓⇓⇓⇓-30,43]. The fracturing parameters of the test well MaHW26X and horizontal wells in North America are shown in Table 3. ...
... Fracturing parameters of the test well and horizontal wells in North America
| Data sources | Injection rate/
(m3·min-1) | The fluid volume
in single stage/m3 | The proppant volume in single stage | Stage
spacing/
m | Cluster spacing/
m | The number of clusters in single stage | The number of perforations in single cluster | Perforation erosion degree/
% | The percentage of stages with heel bias/% |
Test well MaHW26X in
Mahu conglomerate
reservoir | 9.3-11.2 | 2 183.2-
3 567.3 | 60.0-
180.0 m3 | 77.3-80.4 | 11.0-18.0 | 6 | 3-8 | 15-352 | 60 |
A shale reservoir in
North America [25] | 13.5 | 1 223.0 | 3.0 t/m | 53.4 | 10.7 | 5 | 4-6 | 5-17 | 83 |
Wolfcamp shale
reservoir [43] | 12.0-15.0 | | 1.7-2.7 t/m | 60.0-80.0 | | 3-5 | | 50-120 | 66 |
Eagle Ford shale
reservoir [30] | | | | 60.0-105.0 | 4.5-6.0 | 10-23 | 1-12 | | 77 |
The difference and similarity of perforation erosion between the test well MaHW26X and horizontal wells in North America are as follows. ...


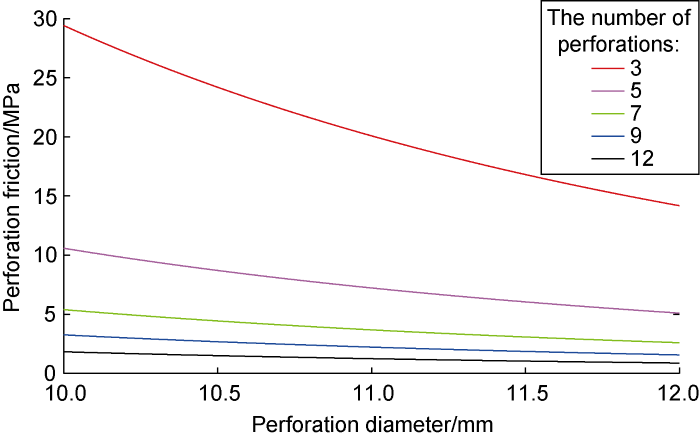

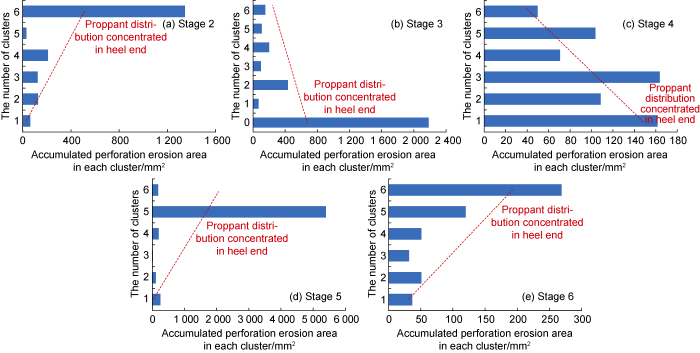
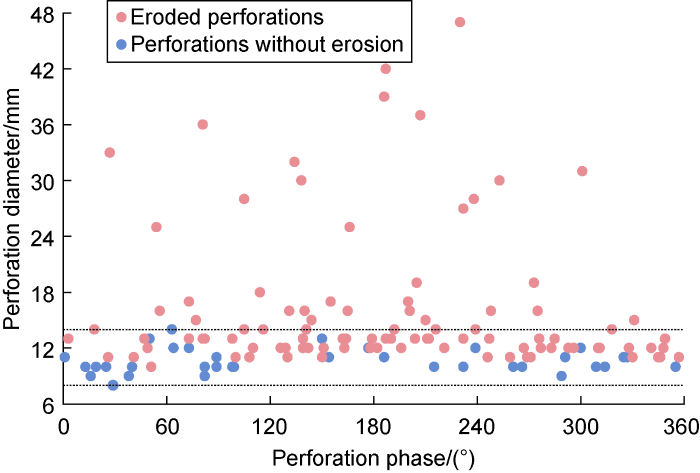
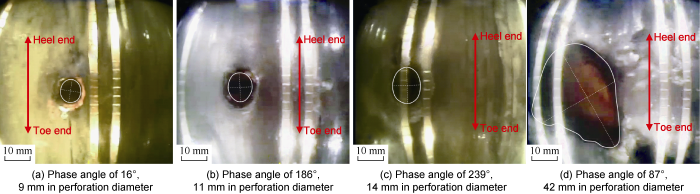
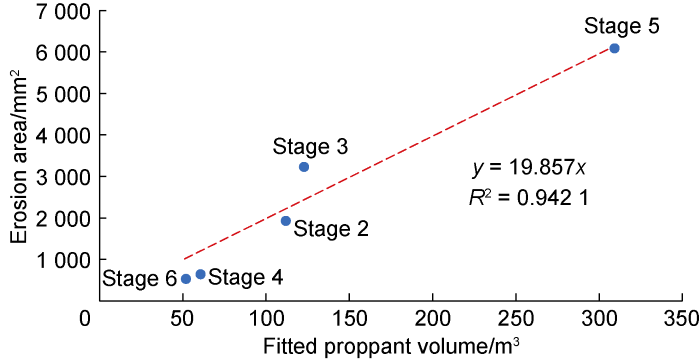
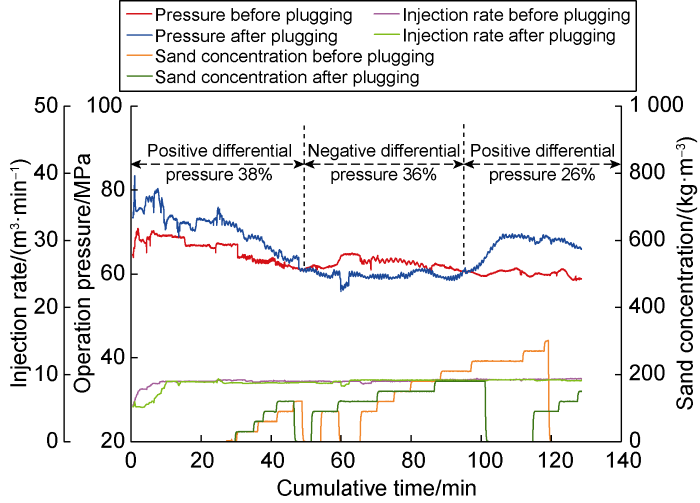
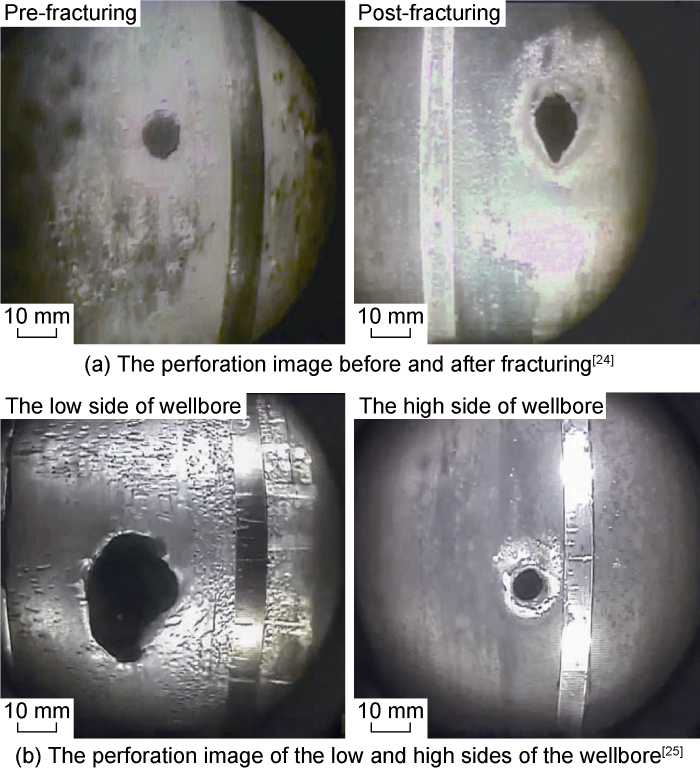
