Sinopec Major Science and Technology Project(JPE19007)
Abstract
A design idea of fidelity sampling cylinder while drilling based on surface nitrogen precharging and supplemented by downhole pressurization was proposed, and the working mode and optimization method of sampling parameters were discussed. The nitrogen chamber in the sampling cylinder functions as an energy storage air cushion, which can supplement the pressure loss caused by temperature change in the sampling process to some extent. The downhole pressurization is to press the sample into the sample chamber as soon as possible, and further increase the pressure of sample to make up for the pressure that the nitrogen chamber cannot provide. Through the analysis of working mode of the sampling fidelity cylinder, the non-ideal gas state equation was used to deduce and calculate the optimal values of fidelity parameters such as pre-charged nitrogen pressure, downhole pressurization amount and sampling volume according to whether the bubble point pressure of the sampling fluid was known and on-site emergency sampling situation. Besides, the influences of ground temperature on fidelity parameters were analyzed, and corresponding correction methods were put forward. The research shows that the fidelity sampling cylinder while drilling can effectively improve the fidelity of the sample. When the formation fluid sample reaches the surface, it can basically ensure that the sample does not change in physical phase state and keeps the same chemical components in the underground formation.
Keywords:sampling while drilling;
formation fluid;
sample fidelity;
bubble point pressure;
nitrogen pre-charge;
downhole pressurization;
parameter optimization
JIANG Chuanlong, YAN Tingjun, ZHANG Yang, SUN Tengfei, CHEN Zhongshuai, SUN Haoyu. An optimization method of fidelity parameters of formation fluid sampling cylinder while drilling. Petroleum Exploration and Development, 2022, 49(2): 458-467 doi:10.1016/S1876-3804(22)60039-9
Introduction
Formation fluid sampling while drilling technology (FSWD) is developed on the basis of cable fluid sampling, formation pressure testing while drilling and formation fluid analysis. It can quickly collect low- or not-polluted formation fluid when the reservoirs are opened. The obtained sample data is closer to the real situation of the formation, and can provide key parameters required for optimizing well completion and production design [1⇓⇓-4]. The sampling cylinder of the formation fluid sampling tools while drilling is very important to realize the sample "fidelity". If no fidelity measures are taken, the volume of the formation fluid sample in the sampling cylinder will shrink due to the decrease of temperature after reaching the ground from the high-temperature downhole environment. When the volume of the sample chamber remains unchanged, the pressure in the sample chamber will decrease accordingly. If the pressure drops below the bubble point pressure, the dissolved gas in the sample will escape and two phases (oil and gas) will appear in the sample chamber. After phase separation, the whole sample will not be restored and seriously distorted. The sample analysis data no longer represent the fluid properties of the real reservoir, which will affect the accuracy of subsequent exploration and development evaluation.
The research on formation fluid sampling while drilling technology has been going on for more than 20 years in foreign countries, but it is basically in the primary stage in China[5⇓⇓⇓⇓⇓⇓-12]. Baker Hughes Company of the United States proposes to use energy storage media to pressurize formation fluid samples. In fact, it is a double-piston air cushion pressurization method, which is feasible and mature. For this pressurization method, YOU et al. [13] and TAN [14] proposed a pressure calculation formula of pre-charged nitrogen when developing the sampling cylinder of cable sampler. But the formula doesn’t consider the influence of temperature and pressure on the sample and cylinder. LIU [15] proposed a pressure maintaining method for fluid in the container considering the changes of temperature field and pressure field, when studying the pressure maintaining fidelity of natural gas hydrate sampler. But this sampler has no downhole pressurization device. An [16] discussed the pressure holding characteristics of a hydrate fidelity cylinder, gave the coupling characteristics of temperature field and pressure field of air cushion under pressurization, and then described the variation law of fluid pressure in the sample chamber. However, the fidelity cylinder lacks continuous pressurization source underground, resulting in limited application.
The commonly used fidelity methods mainly include downhole booster pump and piston air cushion. The method of simply pressurizing with pump has not been widely used in the industry due to the limitation of pump volume. Although the method of piston air cushion pressurization can significantly improve the fidelity of formation fluid samples, the pressure of pre-charged nitrogen depends on empirical judgment in field application and the fidelity effect is poor and inconvenient to use. In view of the limitations of the two methods, this paper puts forward the design idea of sampling fidelity while drilling cylinder based on surface pre-charging nitrogen method mainly and supplemented by downhole pressurization method, and discusses its working mode and sampling parameter optimization method, which is expected to achieve real sample fidelity.
1. Sampling cylinder structure and downhole working mode
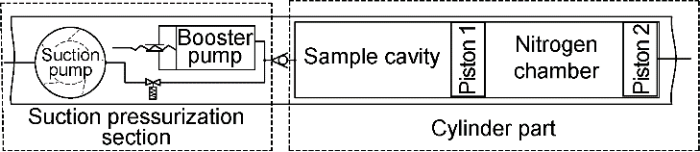
The sampling cylinder designed in this paper is composed of a sample chamber and a nitrogen chamber, which is separated by piston 1. The sampling cylinder is connected with a suction pump and a booster pump for sampling (Fig. 1). During sampling, the formation fluid enters the sample chamber from the left side of the sampling cylinder through the joint action of the suction pump and the booster pump. The positions of Piston 1 and Piston 2 are automatically adjusted according to the pressure in each chamber and downhole pressure, to play the role of pressure balance.
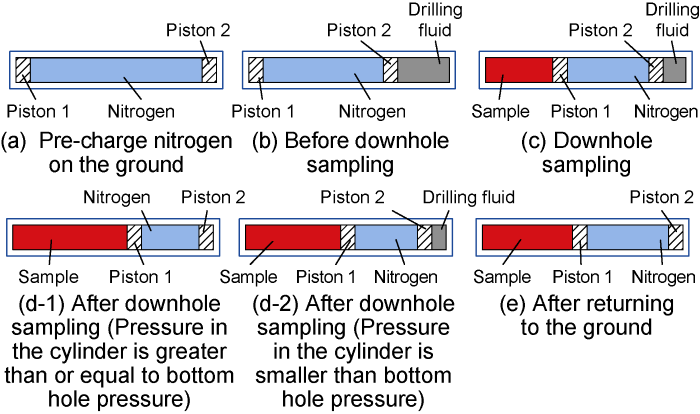
During the sampling process, the volume change of each chamber in the sample cylinder can be divided into five processes (Fig. 2): (1) Pre-charge nitrogen on the ground. Before sampling, precharge nitrogen into the nitrogen chamber on the ground, forcing Piston 1 and Piston 2 to be located at both ends of the sample cylinder. At this time, the gas volume of the nitrogen chamber reaches the maximum, that is, the total volume of the cylinder, and the cylinder temperature is the ground temperature (Fig. 2a). (2) Before downhole sampling, when the tool goes down to the sampling formation, the drilling fluid column pressure is higher than the pre-charged nitrogen pressure, so the drilling fluid pushes the Piston 2 to move to the left. When the pressure in the nitrogen chamber reaches equilibrium with the drilling fluid column pressure, Piston 2 will stop moving. At this time, the pressure in the nitrogen chamber is equal to the drilling fluid column pressure, and the temperature is the formation temperature (Fig. 2b). (3) During downhole sampling, when the pollution rate of the pumped formation fluid meets the sampling requirements, the valve of the sample chamber will open to allow fluid to enter the sample chamber through the booster pump and push the Piston 1 to move to the right. At this time, the pressure of the nitrogen chamber increases, which also drives the Piston 2 to move to the right and gradually discharging the drilling fluid (Fig. 2c). (4) When downhole sampling is completed, if the pressure in the cylinder is greater than or equal to the bottom hole pressure, the Piston 2 is located at the rightmost end of the cylinder (Fig. 2d-1); if the pressure in the cylinder is less than the bottom hole pressure, the Piston 2 is still a certain distance from the rightmost end of the cylinder (Fig. 2d-2), and there is drilling fluid at the right end of the cylinder. (5) After the sampling cylinder returns to the ground, the ground temperature is lower than that of the underground. Piston 2 moves to the rightmost end of the cylinder due to loss of drilling fluid column pressure, and the sample pressure in the sampling cylinder decreases. At this time, Piston 1 moves to the right, and the pressure in the nitrogen chamber acts as compensation to avoid phase change in the sample (Fig. 2e).
Fig. 2.
Working state change of sample chamber and pressure maintaining chamber in sampling cylinder.
2. Working state of sample cylinder during sampling
The inner diameter of the sampling cylinder is Di, the outer diameter is D0, the effective length of the sampling cylinder is L, the elastic modulus of the sampling cylinder material is E, and the Poisson's ratio is μ, the coefficient of linear expansion is α, the downhole sampling volume is Vs. The formation pressure is p, the atmospheric pressure is p0, and the bottom hole pressure increase is pa. In the process of surface nitrogen pre-charge, the states in the nitrogen chamber are T1, V1 and p1. After downhole sampling, the states in the nitrogen chamber are T2, V2 and p2. When returning to the ground, the states in the nitrogen chamber are T3, V3 and p3, and the sample volume is $V_{s}^{*}$. The working conditions of the sampling cylinder are as follows:
2.1. The process of sampling underground after nitrogen pre-charge
In the process of sampling underground after nitrogen pre-charge, the volume expansion of the sampling cylinder is caused by pressure change. It can be deduced from the elastic theory that the radial change of the cylinder under the action of internal and external pressure difference as follows:
The volume expansion of the sampling cylinder caused by temperature change can be obtained from the linear expansion coefficient formula, and the radial variation is:
2.2. The process of cylinder rising to the ground after downhole sampling
In the process of cylinder rising to the ground after downhole sampling, the volume expansion of the sampling cylinder is caused by pressure change. Similarly, it can be deduced from the elastic theory that the radial change of the cylinder under the action of internal and external pressure difference is:
2.3. The process of sampling cylinder rising from underground to ground
After the sampling cylinder rises from the underground to the ground, the decrease of temperature will cause the volume of the sampling cylinder to shrink, and the sample volume will decrease too. In this way, the actual pressure of the ground sample may be less than the ground design pressure of the sample, and the influence of temperature on the fidelity of the sample cannot be ignored. As the sampling cylinder rising from the underground to the ground, the external pressure of the sampling cylinder gradually decreases, the sample volume expands, and the internal pressure of the sample increases. To ensure the fidelity of the sample, the ground pressure of the sample should be slightly higher than the design pressure. Therefore, the rise of the internal pressure of the sample is conducive to the fidelity of the sample. Therefore, the impact of the change of the internal pressure of the sample on the fidelity of the sample is ignored here.
For the sampling cylinder, the intermediate process can be ignored, but focus on the start state of pre-charging nitrogen and the end state after retrieving sample. The radial variation of the cylinder in this process is:
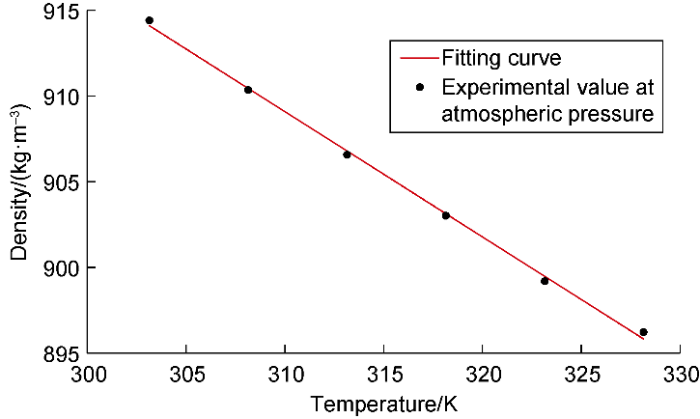
The density of crude oil samples is negatively correlated with temperature [17]. As shown in Fig. 3, the relationship between density and temperature of crude oil in a block of Shengli Oilfield under normal pressure is linear, which can be expressed as:
$\rho \text{=}-A{{T}_{0}}+B$
where A=0.73, B=1135.66, and the correlation coefficient R2 = 0.998 3.
Fig. 3.
Variation relationship between crude oil density and temperature in a block of Shengli Oilfield.
The ground pressure is approximately equal to the drilling fluid column pressure, and the drilling fluid density is ρdf, the downhole sample density is ρ2. The sample density on the ground is ρ3. According to the mass conservation, the sample volume in sample chamber on the ground is:
A, B and G in Eqs. (27) and (29) can be determined according to the actual reservoir parameters in sampling block. When the sampling cylinder returns to the surface from the bottom of the well, the sample volume change is:
If there is no nitrogen expansion compensation, the pressure drop in the sample chamber is large when the sample reaches the ground. After introducing the nitrogen chamber, the pressure drop caused by ΔVs is almost compensated by the nitrogen chamber. Nitrogen is non-ideal gas. The state equation of non-ideal gas is introduced to describe the state of nitrogen in the nitrogen chamber at three processes: surface pre-charge, downhole sampling and returning to the ground:
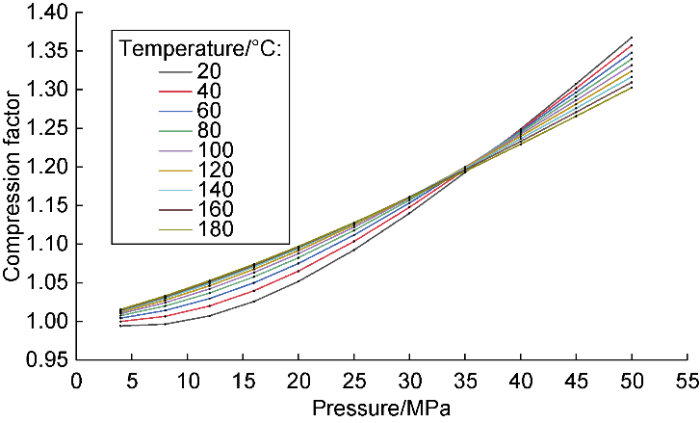
According to the experimental data of the compression factor of nitrogen under different temperatures and pressures published by American National Standards Institute (ANSI) [18], we selected 99 groups of data to draw the variation relationship between the compression factor of nitrogen with temperature and pressure (Fig. 4). When the pressure is higher than 10 MPa and the temperature is 20-180 °C, the compression factor is greater than 1. When the pressure is 5-35 MPa, the lower the temperature, the lower the compression factor is. When the pressure is higher than 35 MPa, the lower the temperature, the higher the compression factor.
Fig. 4.
Variation law of nitrogen compression factor with temperature and pressure.
Similarly, according to the nitrogen compression factor data released by ANSI, we took 220 groups of data and fitted with 1stOpt software to obtain the relationship function between nitrogen compression factor and temperature and pressure:
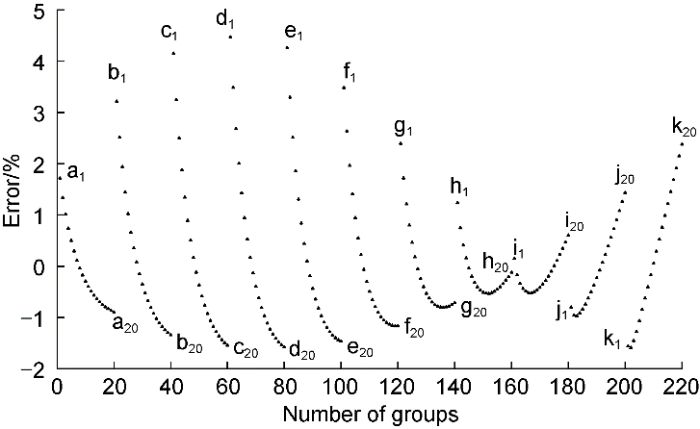
The distribution of the error rate of the comparison between the calculated values of the fitting formula and the look-up table values is shown in Fig. 5 (a, b,..., k in Fig. 5 represent the pressure of 4, 8, 12, 16, 20, 25, 30, 35, 40, 45, 50 MPa respectively, 11 pressure points in total; subscripts 1, 2,..., 20 represent the temperature of 10, 20,..., 200 °C, respectively, 20 temperature points in total). It can be seen that compared with the traditional look-up table calculation, the calculation error range of is -2% to 5%, which can be used in engineering calculation.
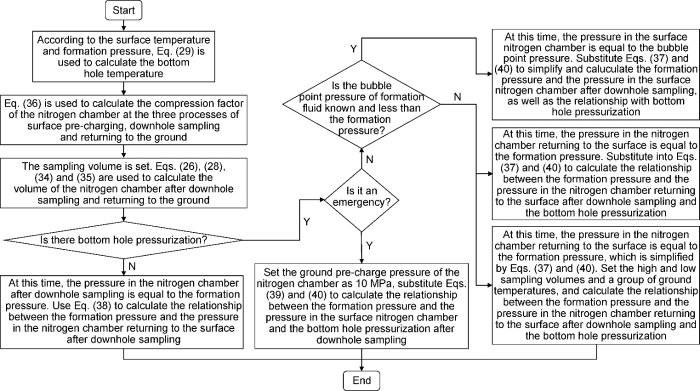
The optimization calculation of pre-charged nitrogen pressure (p1) and bottom hole pressurization (pa) is solved by MATLAB commercial software. The specific process is shown in Fig. 6.
Fig. 6.
Flow chart of parameter optimization calculation of pre-charged nitrogen pressure and bottom hole pressurization.
3. Sample fidelity parameter optimization
3.1. Unknown formation fluid bubble point pressure
When the bubble point pressure of formation fluid is unknown, the best fidelity sampling method is to ensure that the pressure when the sample is taken to the ground is equal to the formation pressure. At this time, p3=p, only the pre-charged nitrogen pressure and bottom hole pressurization under the corresponding sampling volume need to be calculated, which can be obtained from Eqs. (37) and (40):
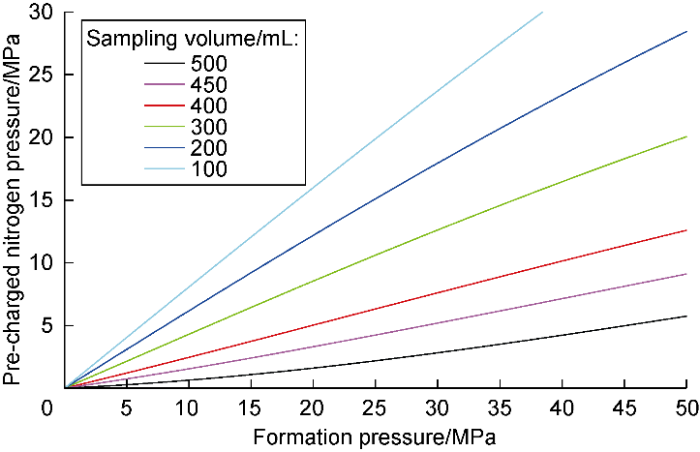
The following is a calculation example to illustrate the optimization process of fidelity parameters. The inner diameter of the sampling cylinder is 28 mm, the outer diameter is 36 mm, the original effective length of the pressure retaining container is 850 mm, the elastic modulus of the sampling cylinder material (beryllium copper) is 128 GPa, the Poisson's ratio is 0.3, and the linear expansion coefficient is 17.6×10⁻⁶ K-1, the maximum bottom hole pressurization is 20 MPa. The density of drilling fluid is 1100 kg/m3, the bulk modulus of elasticity of the sample is 1.67 GPa, and the atmospheric pressure is ignored. The ground temperature is 293.15 K, the linear fitting coefficients in Eq. (27) are A = 0.73, and B = 1135.66, and the ground temperature gradient is 3 °C/100 m.
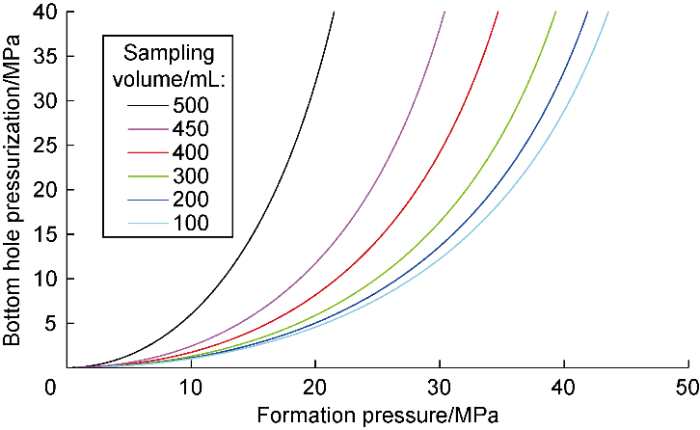
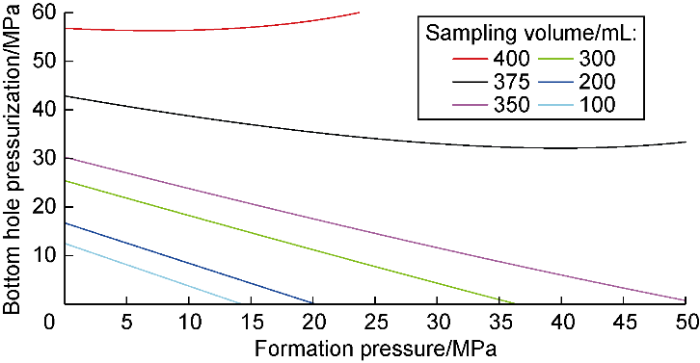
For convenient field application, the sampling volume is taken as a fixed value of 500, 450, 400, 300, 200, 100 mL, respectively, and the relationship curve between pre-charged nitrogen pressure, bottom hole pressurization and formation pressure is calculated by Eqs. (41) and (42) (Figs. 7 and 8). It can be seen that under the condition of the same sampling volume, the higher the formation pressure, the higher the pre-charged nitrogen pressure is required, and the greater the bottom hole pressurization. Assuming that the sampling volume is 400 mL and the formation pressure is 27.8 MPa, it can be seen from the drawing that the maximum pre-charged nitrogen pressure is 7 MPa and the minimum bottom hole pressurization is 19 MPa.
Fig. 8.
Relationship between bottom hole pressurization and formation pressure (p3 = p).
If only nitrogen is pre-charged, but no bottom hole pressurization, the pressure of the nitrogen chamber is consistent with the formation pressure when the sampling cylinder is at the bottom of the well, with p2=p. Substitute it into Eq. (38) to obtain the pressure when the sample from bottom hole returns to the ground (nitrogen chamber pressure):
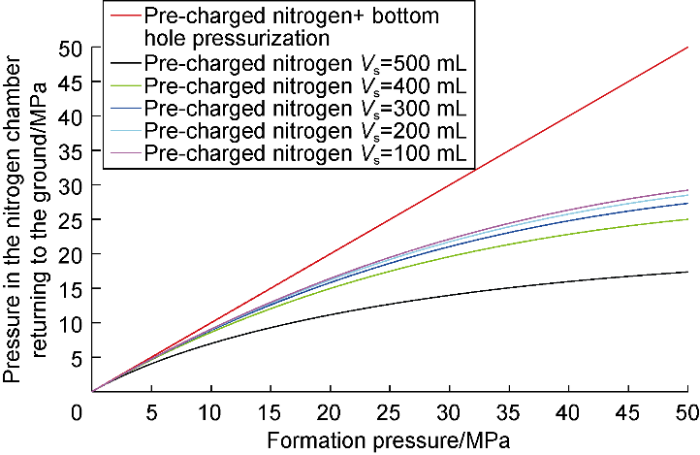
According to the above equation, the relationship between formation pressure and the pressure of sample returning to the surface is calculated at different sample volumes can be calculated, which are compared with the calculation results of “pre-charged nitrogen + bottom hole pressurization” sampling method under the same conditions (in Fig. 9, at different sampling volumes, the sample chamber pressure obtained by “pre-charging nitrogen + bottom hole pressurization” sampling method is consistent with the sampling formation pressure, so only one line is drawn in the figure). It can be seen that no matter what the sampling volume is, the nitrogen chamber pressure when the sample returns to the ground in the mode of “pre-charged nitrogen + bottom hole pressurization” is basically the same as the formation pressure, and the fidelity effect is good. There is a large gap between the pressure when the sample returns to the ground without bottom hole pressurization and the formation pressure, and the larger the sampling volume, the smaller the pressure when the sample returns to the ground, and the phase change of the sample occurs. This indicates that the fidelity effect of only pre-charged nitrogen is poor.
Fig. 9.
Comparison of surface sample pressure with and without bottom hole pressurization.
3.2. Known formation fluid bubble point pressure
When formation pressure is less than the bubble point pressure, sample fidelity can be achieved when ground sample pressure is equal to the formation pressure. Therefore, the optimization calculation method of pre-charged nitrogen pressure and bottom hole pressurization is the same as that at unknown formation fluid bubble point pressure case. When the formation pressure is greater than the bubble point pressure, the main optimization calculation is to ensure that the ground sample pressure is equal to pre-charged nitrogen pressure and bottom hole pressurization required by the bubble point pressure. At this time, p3 = pb. Substitute it into Eqs. (37) and (40) to obtain:
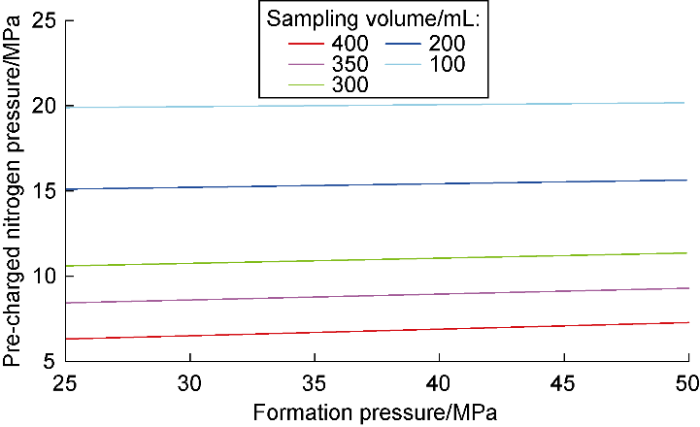
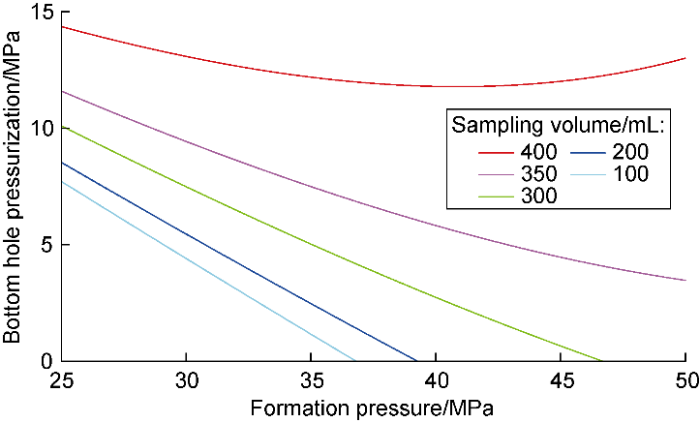
The following illustrates the optimization process of fidelity parameters with a calculation example. With the same sampling cylinder, formation and fluid parameters in section 3.2, and set the bubble point pressure as 25 MPa. Calculate the relationship curves between pre- charged nitrogen pressure, bottom hole pressurization and formation pressure at different sampling volumes through Eqs. (44) and (45) (Figs. 10 and 11). It can be seen that when the formation pressure is greater than 25 MPa, the pre-charged nitrogen pressure increases slowly with the increase of the formation pressure. The changing trend of the bottom hole pressurization is affected by the formation pressure and downhole sampling volume. When the sampling volume is less than 400 mL, the bottom hole pressurization decreases monotonically. When the sampling volume is greater than or equal to 400 mL, the bottom hole pressurization decreases first and then increases. From the Fig. 10 and Fig. 11, when the sampling volume is determined, the pre-charged nitrogen pressure and bottom hole pressurization are easily available according to the formation pressure. When the sampling volume is 300 mL, if the formation pressure is 42.5 MPa, it can be found that the pre-charged nitrogen pressure is 11.1 MPa and the bottom hole pressurization is 2.3 MPa. When the formation pressure is 50.0 MPa, it can be found that the pre-charged nitrogen pressure is 11.4 MPa and the bottom hole pressurization is 0. It can be seen from the curve that when the formation pressure is greater than 47.0 MPa, there is no need for bottom hole pressurization. At this point, the right end of the sampling cylinder is shown in Fig. 2d-2, and there is drilling fluid.
Fig. 11.
Relationship between bottom hole pressurization and formation pressure (p3 = pb).
3.3. Emergency situation of constant pressure nitrogen pre-charge
Pre-charge the sampling cylinder with nitrogen at constant pressure, and adjust the pressure of the sample chamber only by downhole pressurization on site. Within a certain sampling volume range, if the bubble point pressure of formation fluid is known, ensure that the sample pressure in the cylinder is not less than the bubble point pressure when it reaches the ground; if the bubble point pressure of formation fluid is unknown, ensure that the sample pressure in the cylinder is not less than the formation pressure after it reaches the ground.
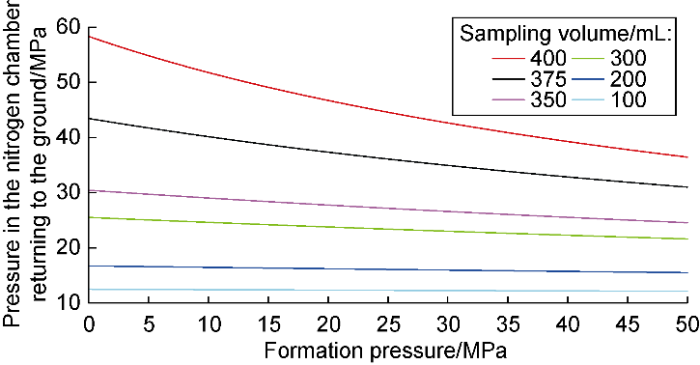
The pre-charged nitrogen pressure is set to be 10.0 MPa. Using the same sampling cylinder, formation and fluid, etc. parameters in the above example, to calculate the relationship curve between the sample pressure returned to the surface, bottom hole pressurization and formation pressure at different sampling volumes through Eqs. (39) and (40) (Figs. 12 and 13). When the formation pressure is 25 MPa, if it is necessary to ensure that the pressure of the sample returning to the ground is greater than or equal to 25 MPa, it can be seen from Fig. 12 that the sampling volume must be greater than or equal to 350 mL; when the upper limit of bottom hole pressurization is 20 MPa, the sampling volume of 300 or 350 mL can meet the requirements (Fig. 12). According to the interval conversion of sampling volume curves in Fig. 12 and Fig. 13, when the sampling volume is 310-355 mL, the pressure when the formation sample reaches the ground is not less than 25 MPa, which can achieve fidelity.
Fig. 13.
Relationship between bottom hole pressurization and formation pressure (p1 = 10.0 MPa).
4. Influence of ground temperature on fidelity calculation results
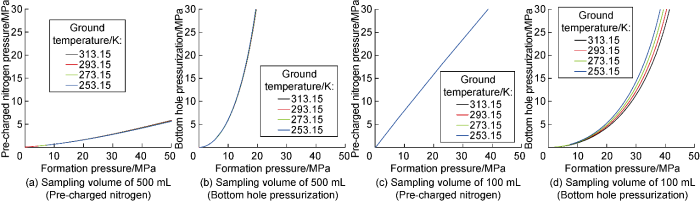
The effect of ground temperature on pre-charged nitrogen pressure and downhole pressurization can be calculated by Eqs. (41) and (42). Use the parameters of the above example, such as sampling cylinder, formation and fluid, etc. to analyze the relationship between pre-charged nitrogen pressure, bottom hole pressurization and formation pressure at different ground temperatures when the sampling volume is 500 and 100 mL, respectively (Fig. 14). It can be seen from the figure that when the sampling volume is 500, 100 mL, the change of ground temperature has little effect on the pre-charged nitrogen pressure, which can be ignored. However, the surface temperature has a certain impact on the bottom hole pressurization, especially when the sampling volume is small, the impact is more obvious. When ground temperature decreases, the bottom hole pressurization shows an increasing trend. In view of this, when the sampling volume is large (e.g. greater than or equal to 500 mL), the error of the optimized bottom hole pressurization is small and does not need to be corrected. When the sampling volume is small (100-500 mL), the calculated bottom hole pressurization error is large, which needs to be properly corrected. (1) When the formation pressure is less than 12 MPa, it does not need to be corrected; (2) When the formation pressure is greater than 12 MPa, the optimized bottom hole pressurization should be better corrected and the calculated value can be increased by 0-5 MPa.
Fig. 14.
Effect of ground temperature change on pre-charged nitrogen pressure and bottom hole pressurization.
5. Conclusions
The ground pre-charging nitrogen is taken as the primary method and downhole pressurization as the secondary method to ensure fidelity sampling while drilling. The nitrogen chamber acts as an energy storage cushion to supplement the pressure loss caused by temperature change in the sampling process to a certain extent. Downhole pressurization forces the sample into the sample chamber as soon as possible, improves the sample pressure and makes up for pressure not available from the nitrogen chamber.
The sampling cylinder supported by ground pre-charging nitrogen and downhole pressurization can effectively improve the fidelity of sample. After retrieved to the ground, it can basically ensure no changes in the physical phase of the sample, so the original chemical composition in the formation is still available.
Nomenclature
A, B—linear fitting coefficients, dimensionless;
D0—outer diameter of sampling cylinder, mm;
Di—inner diameter of sampling cylinder, mm;
$D_{\text{i1-2}}^{\text{*}}$—inner diameter of cylinder after nitrogen pre-charge on the ground and reaches the underground sampling interval, mm;
$D_{\text{i1-3}}^{\text{*}}$— inner diameter of cylinder from nitrogen pre-charge to sampling and reaching the ground, mm;
$D_{\text{i2-3}}^{\text{*}}$—inner diameter of cylinder rising to the ground after downhole sampling, mm;
$D_{\text{0 }}^{\text{*}}$—the outer diameter of the cylinder after nitrogen pre-charge on the ground and reaches the downhole sampling interval, mm;
E—elastic modulus of beryllium copper, MPa;
E0—bulk elastic modulus of formation fluid, MPa;
g—gravitational acceleration, m/s2;
G—ground temperature gradient, °C/100 m;
L—effective length of sampling cylinder, mm;
$L_{\text{1-2}}^{\text{*}}$—effective length of the cylinder after the ground nitrogen pre-charge and reaches downhole sampling interval, mm;
$L_{\text{1-3}}^{\text{*}}$—effective length of cylinder from nitrogen pre-charge to sampling and reaching the ground, mm;
$L_{\text{2-3}}^{\text{*}}$—effective length of cylinder rising to the ground after downhole sampling, mm;
p—formation pressure, MPa;
p0—atmospheric pressure, MPa;
p1—pre-charged nitrogen pressure, MPa;
p2—pressure in nitrogen chamber after downhole sampling, MPa;
p3—pressure in the nitrogen chamber returning to the ground, MPa;
pb—bubble point pressure, MPa;
pa—bottom hole pressurization, MPa;
T—nitrogen ambient temperature, °C;
T0—ambient temperature of crude oil, K;
T1—ground temperature, K;
T2—bottom hole temperature, K;
T3—ground temperature of sample returning, K;
V1—volume of ground pre-charged nitrogen, mL;
V1-2—volume of cylinder after nitrogen pre-charge on the ground and reaches the downhole sampling interval, mL;
V2—volume of nitrogen chamber after downhole sampling, mL;
V2-3—volume of cylinder when it rises to the ground after downhole sampling, mL;
V3—volume of nitrogen chamber when returning to the ground, mL;
Vdf—volume of drilling fluid entering the right end of piston 2 in the sampling cylinder as shown in Fig. 2d-2, mL;
Vs—downhole sampling volume, mL;
$V_{s}^{*}$—sample volume when returning to the ground, mL;
Z—nitrogen compression factor, dimensionless;
Z1—compression factor of ground pre-charged nitrogen, dimensionless;
Z2—nitrogen compression factor after downhole sampling, dimensionless;
Z3—compression factor of nitrogen returning to the ground, dimensionless;
α—Linear expansion coefficient of beryllium copper, K-1;
ΔDp1-2—radial variation of cylinder under internal and external pressure difference during the process of pre-charged nitrogen on the ground to underground sampling interval, mm;
ΔDp1-3—radial variation of cylinder under internal and external pressure difference from pre-charging nitrogen to sampling and reaching the ground, mm;
ΔDp2-3—radial variation of cylinder under internal and external pressure difference during rising to the ground after downhole sampling, mm;
ΔDt1-2—change of inner diameter of sampling cylinder caused by temperature change during the process of pre-charging nitrogen on the ground to underground sampling interval, mm;
ΔDt1-3—change in inner diameter of sampling cylinder caused by temperature change from pre-charging nitrogen to sampling to reaching the ground, mm;
ΔDt2-3—change in inner diameter of sampling cylinder caused by temperature change during rising to the ground after downhole sampling, mm;
ΔLp1-2—change of effective length of sampling cylinder caused by pressure change during the process of pre-charging nitrogen on the ground to underground sampling interval, mm;
ΔLp1-3—change in effective length of sampling cylinder caused by temperature change from pre-charging nitrogen to sampling to reaching the ground, mm;
ΔLp2-3—the change in the effective length of the sampling cylinder caused by the pressure change of the cylinder when it rises to the ground after downhole sampling, mm;
ΔLt1-2—change in effective length of sampling cylinder caused by temperature change during the process of pre-charging nitrogen on the ground to underground sampling interval, mm;
ΔLt1-3—change in effective length of sampling cylinder caused by temperature change from pre-charging nitrogen to sampling to reaching the ground, mm;
ΔLt2-3—change in effective length of sampling cylinder caused by temperature change during rising to the ground after downhole sampling, mm;
Δp—pressure difference in sample cavity caused by sample volume shrinkage, MPa;
ΔVs—volume change of sample, mL;
μ—Poisson's ratio, dimensionless;
ρ—Crude oil density, kg/m3;
ρ2—sample density during downhole sampling, kg/m3;
ρ3—sample density after returning to the ground, kg/m3;
SANCHEZF G.Innovative single-phase tank technology for in-situ sample validation enhances fluid sampling integrity. Kuala Lumpur: Society of Petroleum Engineers International Petroleum Technology Conference, 2013.
New progress of wireline logging technology abroad
1
2008
... Formation fluid sampling while drilling technology (FSWD) is developed on the basis of cable fluid sampling, formation pressure testing while drilling and formation fluid analysis. It can quickly collect low- or not-polluted formation fluid when the reservoirs are opened. The obtained sample data is closer to the real situation of the formation, and can provide key parameters required for optimizing well completion and production design [1⇓⇓-4]. The sampling cylinder of the formation fluid sampling tools while drilling is very important to realize the sample "fidelity". If no fidelity measures are taken, the volume of the formation fluid sample in the sampling cylinder will shrink due to the decrease of temperature after reaching the ground from the high-temperature downhole environment. When the volume of the sample chamber remains unchanged, the pressure in the sample chamber will decrease accordingly. If the pressure drops below the bubble point pressure, the dissolved gas in the sample will escape and two phases (oil and gas) will appear in the sample chamber. After phase separation, the whole sample will not be restored and seriously distorted. The sample analysis data no longer represent the fluid properties of the real reservoir, which will affect the accuracy of subsequent exploration and development evaluation. ...
Advancing fluid property
1
2007
... Formation fluid sampling while drilling technology (FSWD) is developed on the basis of cable fluid sampling, formation pressure testing while drilling and formation fluid analysis. It can quickly collect low- or not-polluted formation fluid when the reservoirs are opened. The obtained sample data is closer to the real situation of the formation, and can provide key parameters required for optimizing well completion and production design [1⇓⇓-4]. The sampling cylinder of the formation fluid sampling tools while drilling is very important to realize the sample "fidelity". If no fidelity measures are taken, the volume of the formation fluid sample in the sampling cylinder will shrink due to the decrease of temperature after reaching the ground from the high-temperature downhole environment. When the volume of the sample chamber remains unchanged, the pressure in the sample chamber will decrease accordingly. If the pressure drops below the bubble point pressure, the dissolved gas in the sample will escape and two phases (oil and gas) will appear in the sample chamber. After phase separation, the whole sample will not be restored and seriously distorted. The sample analysis data no longer represent the fluid properties of the real reservoir, which will affect the accuracy of subsequent exploration and development evaluation. ...
1
2013
... Formation fluid sampling while drilling technology (FSWD) is developed on the basis of cable fluid sampling, formation pressure testing while drilling and formation fluid analysis. It can quickly collect low- or not-polluted formation fluid when the reservoirs are opened. The obtained sample data is closer to the real situation of the formation, and can provide key parameters required for optimizing well completion and production design [1⇓⇓-4]. The sampling cylinder of the formation fluid sampling tools while drilling is very important to realize the sample "fidelity". If no fidelity measures are taken, the volume of the formation fluid sample in the sampling cylinder will shrink due to the decrease of temperature after reaching the ground from the high-temperature downhole environment. When the volume of the sample chamber remains unchanged, the pressure in the sample chamber will decrease accordingly. If the pressure drops below the bubble point pressure, the dissolved gas in the sample will escape and two phases (oil and gas) will appear in the sample chamber. After phase separation, the whole sample will not be restored and seriously distorted. The sample analysis data no longer represent the fluid properties of the real reservoir, which will affect the accuracy of subsequent exploration and development evaluation. ...
Study on multi sampling technology for formation testing
1
2013
... Formation fluid sampling while drilling technology (FSWD) is developed on the basis of cable fluid sampling, formation pressure testing while drilling and formation fluid analysis. It can quickly collect low- or not-polluted formation fluid when the reservoirs are opened. The obtained sample data is closer to the real situation of the formation, and can provide key parameters required for optimizing well completion and production design [1⇓⇓-4]. The sampling cylinder of the formation fluid sampling tools while drilling is very important to realize the sample "fidelity". If no fidelity measures are taken, the volume of the formation fluid sample in the sampling cylinder will shrink due to the decrease of temperature after reaching the ground from the high-temperature downhole environment. When the volume of the sample chamber remains unchanged, the pressure in the sample chamber will decrease accordingly. If the pressure drops below the bubble point pressure, the dissolved gas in the sample will escape and two phases (oil and gas) will appear in the sample chamber. After phase separation, the whole sample will not be restored and seriously distorted. The sample analysis data no longer represent the fluid properties of the real reservoir, which will affect the accuracy of subsequent exploration and development evaluation. ...
Research progress and application of FCT during drilling
1
2008
... The research on formation fluid sampling while drilling technology has been going on for more than 20 years in foreign countries, but it is basically in the primary stage in China[5⇓⇓⇓⇓⇓⇓-12]. Baker Hughes Company of the United States proposes to use energy storage media to pressurize formation fluid samples. In fact, it is a double-piston air cushion pressurization method, which is feasible and mature. For this pressurization method, YOU et al. [13] and TAN [14] proposed a pressure calculation formula of pre-charged nitrogen when developing the sampling cylinder of cable sampler. But the formula doesn’t consider the influence of temperature and pressure on the sample and cylinder. LIU [15] proposed a pressure maintaining method for fluid in the container considering the changes of temperature field and pressure field, when studying the pressure maintaining fidelity of natural gas hydrate sampler. But this sampler has no downhole pressurization device. An [16] discussed the pressure holding characteristics of a hydrate fidelity cylinder, gave the coupling characteristics of temperature field and pressure field of air cushion under pressurization, and then described the variation law of fluid pressure in the sample chamber. However, the fidelity cylinder lacks continuous pressurization source underground, resulting in limited application. ...
ERCT and its application in Bohai oilfield
1
2011
... The research on formation fluid sampling while drilling technology has been going on for more than 20 years in foreign countries, but it is basically in the primary stage in China[5⇓⇓⇓⇓⇓⇓-12]. Baker Hughes Company of the United States proposes to use energy storage media to pressurize formation fluid samples. In fact, it is a double-piston air cushion pressurization method, which is feasible and mature. For this pressurization method, YOU et al. [13] and TAN [14] proposed a pressure calculation formula of pre-charged nitrogen when developing the sampling cylinder of cable sampler. But the formula doesn’t consider the influence of temperature and pressure on the sample and cylinder. LIU [15] proposed a pressure maintaining method for fluid in the container considering the changes of temperature field and pressure field, when studying the pressure maintaining fidelity of natural gas hydrate sampler. But this sampler has no downhole pressurization device. An [16] discussed the pressure holding characteristics of a hydrate fidelity cylinder, gave the coupling characteristics of temperature field and pressure field of air cushion under pressurization, and then described the variation law of fluid pressure in the sample chamber. However, the fidelity cylinder lacks continuous pressurization source underground, resulting in limited application. ...
SDC-Ⅰ formation pressure tester while drilling
1
2011
... The research on formation fluid sampling while drilling technology has been going on for more than 20 years in foreign countries, but it is basically in the primary stage in China[5⇓⇓⇓⇓⇓⇓-12]. Baker Hughes Company of the United States proposes to use energy storage media to pressurize formation fluid samples. In fact, it is a double-piston air cushion pressurization method, which is feasible and mature. For this pressurization method, YOU et al. [13] and TAN [14] proposed a pressure calculation formula of pre-charged nitrogen when developing the sampling cylinder of cable sampler. But the formula doesn’t consider the influence of temperature and pressure on the sample and cylinder. LIU [15] proposed a pressure maintaining method for fluid in the container considering the changes of temperature field and pressure field, when studying the pressure maintaining fidelity of natural gas hydrate sampler. But this sampler has no downhole pressurization device. An [16] discussed the pressure holding characteristics of a hydrate fidelity cylinder, gave the coupling characteristics of temperature field and pressure field of air cushion under pressurization, and then described the variation law of fluid pressure in the sample chamber. However, the fidelity cylinder lacks continuous pressurization source underground, resulting in limited application. ...
Technical progress of formation testing and downhole fluid sampling and analysis
1
2012
... The research on formation fluid sampling while drilling technology has been going on for more than 20 years in foreign countries, but it is basically in the primary stage in China[5⇓⇓⇓⇓⇓⇓-12]. Baker Hughes Company of the United States proposes to use energy storage media to pressurize formation fluid samples. In fact, it is a double-piston air cushion pressurization method, which is feasible and mature. For this pressurization method, YOU et al. [13] and TAN [14] proposed a pressure calculation formula of pre-charged nitrogen when developing the sampling cylinder of cable sampler. But the formula doesn’t consider the influence of temperature and pressure on the sample and cylinder. LIU [15] proposed a pressure maintaining method for fluid in the container considering the changes of temperature field and pressure field, when studying the pressure maintaining fidelity of natural gas hydrate sampler. But this sampler has no downhole pressurization device. An [16] discussed the pressure holding characteristics of a hydrate fidelity cylinder, gave the coupling characteristics of temperature field and pressure field of air cushion under pressurization, and then described the variation law of fluid pressure in the sample chamber. However, the fidelity cylinder lacks continuous pressurization source underground, resulting in limited application. ...
New sampling technology for formation fluid analysis while drilling and its application
1
2013
... The research on formation fluid sampling while drilling technology has been going on for more than 20 years in foreign countries, but it is basically in the primary stage in China[5⇓⇓⇓⇓⇓⇓-12]. Baker Hughes Company of the United States proposes to use energy storage media to pressurize formation fluid samples. In fact, it is a double-piston air cushion pressurization method, which is feasible and mature. For this pressurization method, YOU et al. [13] and TAN [14] proposed a pressure calculation formula of pre-charged nitrogen when developing the sampling cylinder of cable sampler. But the formula doesn’t consider the influence of temperature and pressure on the sample and cylinder. LIU [15] proposed a pressure maintaining method for fluid in the container considering the changes of temperature field and pressure field, when studying the pressure maintaining fidelity of natural gas hydrate sampler. But this sampler has no downhole pressurization device. An [16] discussed the pressure holding characteristics of a hydrate fidelity cylinder, gave the coupling characteristics of temperature field and pressure field of air cushion under pressurization, and then described the variation law of fluid pressure in the sample chamber. However, the fidelity cylinder lacks continuous pressurization source underground, resulting in limited application. ...
Development of wireline formation testing technology and its role evolution in formation and reservoir evaluation
1
2010
... The research on formation fluid sampling while drilling technology has been going on for more than 20 years in foreign countries, but it is basically in the primary stage in China[5⇓⇓⇓⇓⇓⇓-12]. Baker Hughes Company of the United States proposes to use energy storage media to pressurize formation fluid samples. In fact, it is a double-piston air cushion pressurization method, which is feasible and mature. For this pressurization method, YOU et al. [13] and TAN [14] proposed a pressure calculation formula of pre-charged nitrogen when developing the sampling cylinder of cable sampler. But the formula doesn’t consider the influence of temperature and pressure on the sample and cylinder. LIU [15] proposed a pressure maintaining method for fluid in the container considering the changes of temperature field and pressure field, when studying the pressure maintaining fidelity of natural gas hydrate sampler. But this sampler has no downhole pressurization device. An [16] discussed the pressure holding characteristics of a hydrate fidelity cylinder, gave the coupling characteristics of temperature field and pressure field of air cushion under pressurization, and then described the variation law of fluid pressure in the sample chamber. However, the fidelity cylinder lacks continuous pressurization source underground, resulting in limited application. ...
3D pore-scale modeling of nanofluids-enhanced oil recovery
1
2021
... The research on formation fluid sampling while drilling technology has been going on for more than 20 years in foreign countries, but it is basically in the primary stage in China[5⇓⇓⇓⇓⇓⇓-12]. Baker Hughes Company of the United States proposes to use energy storage media to pressurize formation fluid samples. In fact, it is a double-piston air cushion pressurization method, which is feasible and mature. For this pressurization method, YOU et al. [13] and TAN [14] proposed a pressure calculation formula of pre-charged nitrogen when developing the sampling cylinder of cable sampler. But the formula doesn’t consider the influence of temperature and pressure on the sample and cylinder. LIU [15] proposed a pressure maintaining method for fluid in the container considering the changes of temperature field and pressure field, when studying the pressure maintaining fidelity of natural gas hydrate sampler. But this sampler has no downhole pressurization device. An [16] discussed the pressure holding characteristics of a hydrate fidelity cylinder, gave the coupling characteristics of temperature field and pressure field of air cushion under pressurization, and then described the variation law of fluid pressure in the sample chamber. However, the fidelity cylinder lacks continuous pressurization source underground, resulting in limited application. ...
Logging- while-drilling formation dip interpretation based on long short-term memory
1
2021
... The research on formation fluid sampling while drilling technology has been going on for more than 20 years in foreign countries, but it is basically in the primary stage in China[5⇓⇓⇓⇓⇓⇓-12]. Baker Hughes Company of the United States proposes to use energy storage media to pressurize formation fluid samples. In fact, it is a double-piston air cushion pressurization method, which is feasible and mature. For this pressurization method, YOU et al. [13] and TAN [14] proposed a pressure calculation formula of pre-charged nitrogen when developing the sampling cylinder of cable sampler. But the formula doesn’t consider the influence of temperature and pressure on the sample and cylinder. LIU [15] proposed a pressure maintaining method for fluid in the container considering the changes of temperature field and pressure field, when studying the pressure maintaining fidelity of natural gas hydrate sampler. But this sampler has no downhole pressurization device. An [16] discussed the pressure holding characteristics of a hydrate fidelity cylinder, gave the coupling characteristics of temperature field and pressure field of air cushion under pressurization, and then described the variation law of fluid pressure in the sample chamber. However, the fidelity cylinder lacks continuous pressurization source underground, resulting in limited application. ...
Development and application of single phase formation fluid sampling barrel
1
2013
... The research on formation fluid sampling while drilling technology has been going on for more than 20 years in foreign countries, but it is basically in the primary stage in China[5⇓⇓⇓⇓⇓⇓-12]. Baker Hughes Company of the United States proposes to use energy storage media to pressurize formation fluid samples. In fact, it is a double-piston air cushion pressurization method, which is feasible and mature. For this pressurization method, YOU et al. [13] and TAN [14] proposed a pressure calculation formula of pre-charged nitrogen when developing the sampling cylinder of cable sampler. But the formula doesn’t consider the influence of temperature and pressure on the sample and cylinder. LIU [15] proposed a pressure maintaining method for fluid in the container considering the changes of temperature field and pressure field, when studying the pressure maintaining fidelity of natural gas hydrate sampler. But this sampler has no downhole pressurization device. An [16] discussed the pressure holding characteristics of a hydrate fidelity cylinder, gave the coupling characteristics of temperature field and pressure field of air cushion under pressurization, and then described the variation law of fluid pressure in the sample chamber. However, the fidelity cylinder lacks continuous pressurization source underground, resulting in limited application. ...
A pressure holding device for formation fluid sampling bottle
1
2015
... The research on formation fluid sampling while drilling technology has been going on for more than 20 years in foreign countries, but it is basically in the primary stage in China[5⇓⇓⇓⇓⇓⇓-12]. Baker Hughes Company of the United States proposes to use energy storage media to pressurize formation fluid samples. In fact, it is a double-piston air cushion pressurization method, which is feasible and mature. For this pressurization method, YOU et al. [13] and TAN [14] proposed a pressure calculation formula of pre-charged nitrogen when developing the sampling cylinder of cable sampler. But the formula doesn’t consider the influence of temperature and pressure on the sample and cylinder. LIU [15] proposed a pressure maintaining method for fluid in the container considering the changes of temperature field and pressure field, when studying the pressure maintaining fidelity of natural gas hydrate sampler. But this sampler has no downhole pressurization device. An [16] discussed the pressure holding characteristics of a hydrate fidelity cylinder, gave the coupling characteristics of temperature field and pressure field of air cushion under pressurization, and then described the variation law of fluid pressure in the sample chamber. However, the fidelity cylinder lacks continuous pressurization source underground, resulting in limited application. ...
Research on the structure of gas hydrate drilling sampler
1
2010
... The research on formation fluid sampling while drilling technology has been going on for more than 20 years in foreign countries, but it is basically in the primary stage in China[5⇓⇓⇓⇓⇓⇓-12]. Baker Hughes Company of the United States proposes to use energy storage media to pressurize formation fluid samples. In fact, it is a double-piston air cushion pressurization method, which is feasible and mature. For this pressurization method, YOU et al. [13] and TAN [14] proposed a pressure calculation formula of pre-charged nitrogen when developing the sampling cylinder of cable sampler. But the formula doesn’t consider the influence of temperature and pressure on the sample and cylinder. LIU [15] proposed a pressure maintaining method for fluid in the container considering the changes of temperature field and pressure field, when studying the pressure maintaining fidelity of natural gas hydrate sampler. But this sampler has no downhole pressurization device. An [16] discussed the pressure holding characteristics of a hydrate fidelity cylinder, gave the coupling characteristics of temperature field and pressure field of air cushion under pressurization, and then described the variation law of fluid pressure in the sample chamber. However, the fidelity cylinder lacks continuous pressurization source underground, resulting in limited application. ...
Study on pressure holding characteristics of new type natural gas hydrate fidelity tube
1
2014
... The research on formation fluid sampling while drilling technology has been going on for more than 20 years in foreign countries, but it is basically in the primary stage in China[5⇓⇓⇓⇓⇓⇓-12]. Baker Hughes Company of the United States proposes to use energy storage media to pressurize formation fluid samples. In fact, it is a double-piston air cushion pressurization method, which is feasible and mature. For this pressurization method, YOU et al. [13] and TAN [14] proposed a pressure calculation formula of pre-charged nitrogen when developing the sampling cylinder of cable sampler. But the formula doesn’t consider the influence of temperature and pressure on the sample and cylinder. LIU [15] proposed a pressure maintaining method for fluid in the container considering the changes of temperature field and pressure field, when studying the pressure maintaining fidelity of natural gas hydrate sampler. But this sampler has no downhole pressurization device. An [16] discussed the pressure holding characteristics of a hydrate fidelity cylinder, gave the coupling characteristics of temperature field and pressure field of air cushion under pressurization, and then described the variation law of fluid pressure in the sample chamber. However, the fidelity cylinder lacks continuous pressurization source underground, resulting in limited application. ...
Determination and correlation of viscosity and density of crude oil related systems under high temperature and high pressure
1
2016
... The density of crude oil samples is negatively correlated with temperature [17]. As shown in Fig. 3, the relationship between density and temperature of crude oil in a block of Shengli Oilfield under normal pressure is linear, which can be expressed as: ...
A thermodynamic property formulation for ethylene from the freezing line to 450K at pressures to 260MPa
1
1986
... According to the experimental data of the compression factor of nitrogen under different temperatures and pressures published by American National Standards Institute (ANSI) [18], we selected 99 groups of data to draw the variation relationship between the compression factor of nitrogen with temperature and pressure (Fig. 4). When the pressure is higher than 10 MPa and the temperature is 20-180 °C, the compression factor is greater than 1. When the pressure is 5-35 MPa, the lower the temperature, the lower the compression factor is. When the pressure is higher than 35 MPa, the lower the temperature, the higher the compression factor. ...


