


Introduction
Tight gas is one type of major unconventional resources[1]. With the technological developments in horizontal well drilling and extensive hydraulic fracturing, efficient exploitation of these resources has become easier. Although hydraulic fractures typically provide a pathway for the reservoir fluids to be delivered to the horizontal wellbore, sometimes the hydraulic fracturing quality is not within acceptable levels, preventing the achievement of expected recovery. In some cases, re-fracturing can be a cost-effective option to improve the hydraulic fracture quality and consequently, recovery from existing horizontal wells. For example, a comprehensive study discovered the re-stimulation potential in tight sandstone gas reservoirs in the Rocky Mountains[2,3]. Characterization of hydraulic fractures is an important step for selecting re-fracturing wells, while the quantified characterization and interpretation of hydraulic-fracture characteristics rely on high-quality well logs, drilling, and surface microseismic monitoring data. These surveys require well shut-in or delay of production right after the hydraulic fracturing is completed, and will increase operational costs of the operating company. Therefore, it is necessary to find more economic and practical methods to select re-fracturing candidates.
In a number of studies on hydraulic fracture quality description and re-fracturing candidates selection before, analyzing production data has been the fundamental approach[4,5,6]. Production-based selection typically limits the analysis to wells with unsatisfactory production[7]. Artificial intelligence based methods have been successfully applied in selecting re-fracturing wells, which primarily use artificial neural networks for production prediction purposes[8,9,10]. By using artificial neural networks, Kulga et al. [11] built an inverse model of hydraulic fracture characteristics in tight sandstone gas reservoir with the production history and initial conditions, which can reflect physical characteristics of hydraulic fractures after training by available data. In addition, some experience-based approaches have been proposed[12]; however, they are only suitable for specific areas, and cannot be generalized to areas with different characteristics.
Artificial intelligence methods, in general, offer effective decision-making protocols by extracting useful information from multiple sets of available data. Some artificial intelligence methods such as fuzzy logic, utilize human reasoning and rule-based systems for prediction or classification[13].
Fuzzy logic offers a way of dealing with imprecision and uncertainty through the definition of membership function and membership degree. This prevents drawing clear boundaries between categorical definitions and indicates physical problems in a more realistic manner.
In this study, we developed a fuzzy-logic based decision-making protocol to characterize the hydraulic fracturing quality of a tight sandstone gas reservoir and determine that whether there is room for improvement. In the model building stage, Subject Matter Experts (SME) are needed to define rules related to reservoir characteristics, operational parameters, initial conditions, production and hydraulic fracture quality. Then a fuzzy inference system is developed which receives known (measured) reservoir characteristics, operational parameters, initial conditions and production as inputs, and predicts the hydraulic fracture quality according to the aforementioned SME-defined rules to find out if a well is suitable for re-fracturing. The rules are defined with proven reservoir engineering knowledge, and the data is from a literature survey of existing tight sandstone gas reservoirs[12,13,14]. It is assumed that if two wells have similar initial conditions, operational parameters, reservoir characteristics, and hydraulic-fracture quality, then they should be comparable in production. Similarly, if two wells have similar attributes except hydraulic fracture quality and different production performances, then the well with higher production should have better hydraulic fracturing quality. A similar assumption was successfully utilized in a recent study to characterize the discrete-fracture network of shale reservoirs[15]. In the following sections, specific details of the developed methodology, results obtained and conclusions drawn are presented.
1. Methodology
1.1. Fuzzy-inference systems
Different from Aristotelian logic which looks at the world in a bivalent manner, such as black and white, or 0 and 1, fuzzy logic was first introduced as a way to represent variation or imprecision in logic[16]. Fuzzy logic allows us to use the natural language to mimic human-reasoning in the computational environment. This is achieved by defining the membership function and several categories for given variables. Fuzzy inference (or reasoning) generates a distribution map for a given set of inputs into the output parameter by using the membership function. Among a number of fuzzy inference methods, Mamdani-type fuzzy inference[17] is the most commonly used one and it includes three steps: (1) Fuzzification of the input variables; (2) Inference: evaluation and aggregation of the rule outputs; (3) Defuzzification. These three steps (Fig. 1) are linked to a fuzzy knowledge base. This knowledge base is constructed by subject matter experts to reflect the real human knowledge through the use of fuzzy if-then rules, which are defined by membership functions and relationships between variables in the system.
Fig. 1.
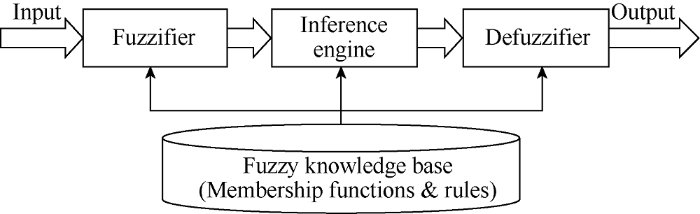
Fig. 1.
Mamdani-type fuzzy inference system[18].
In the fuzzification process, converting the crisp input to a linguistic variable using the membership function in the fuzzy knowledge base. As an example, Fig. 2 shows fuzzy membership functions for two variables: temperature and humidity. These functions help to convert the crisp input values to linguistic variables. For example, according to these functions, 2.2 °C (36 °F) corresponds to 30% cool and 70% freezing, and 60% humidity corresponds to 100% medium humidity. In this way, rather than assigning a certain category to a given value, we can define the degree of membership. This approach achieves flexibility by introducing linguistic definition and human reasoning for a given quantity of a given variable.
Fig. 2.
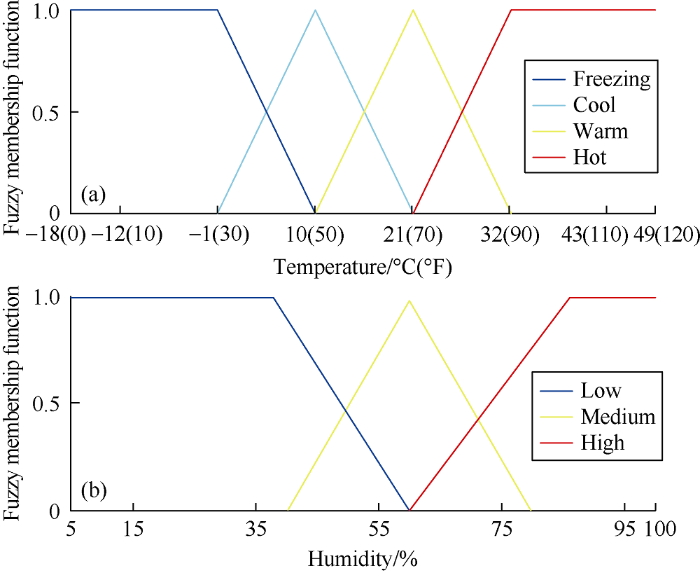
Fig. 2.
Fuzzy membership functions for temperature (a) and humidity (b).
After the fuzzification process, the inference engine is used to convert the fuzzy input (linguistic variables coming from the fuzzification) into fuzzy output using the fuzzy if-then rules defined earlier. These rules are defined by SMEs who are knowledgeable about the problem under consideration according to human reasoning. For example, if we are trying to work out the fan speed of an air-conditioning unit at the temperature of 2.2 °C (36 °F) and humidity of 60%, we may define rules such as the following: (1) Rule 1: If Temperature is FREEZING, Humidity is MEDIUM, Fan Speed should be LOW; (2) Rule 2: If Temperature is COOL, Humidity is MEDIUM, Fan Speed should be MEDIUM. All rules must be defined by all possible combinations of related variables. When there are multiple variables involved, and if there are multiple categories for each variable, then the number of rules that must be defined as the product of numbers of categories for each variable. When all rules are defined, the inference system would recognize the rules need to be processed (Fig. 3). For instance, in the example above, only the two afore-mentioned rules would be processed as the values of temperature and humidity are input. As shown in Fig. 4, the outcomes of these rules are graphically aggregated in the membership function of the output parameter (in this case, the fan speed of the air-conditioning unit).
Fig. 3.
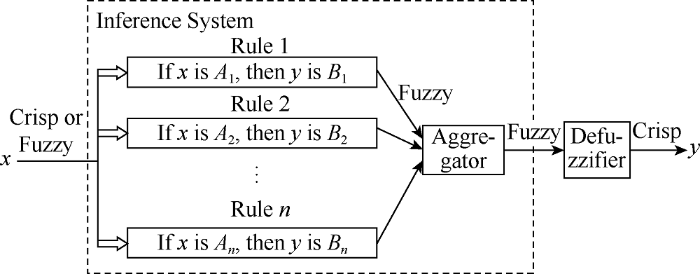
Fig. 3.
Fuzzy inference system.
Fig. 4.
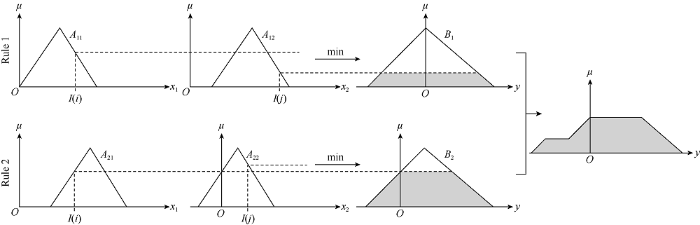
Fig. 4.
Aggregation of rules using the graphical Mamdani inference method with crisp input values[19].
After the aggregation process, the defuzzification is done by converting the area covered by the aggregated curve to a crisp value. This is done by calculating the center of gravity.
In this study, FuzzyR package in R Statistical Computing Environment is used to design and simulate fuzzy-logic system[20].
1.2. Parametric representation of the re-fracturing well selection
The re-fracturing well selection is represented with five indexes, and each index is linked to three parameters. These indexes and associated parameters are: (1) Hydraulic-fracture quality index: fracture permeability, fracture width, and fracture length. (2) Reservoir index: thickness, porosity, permeability of reservoir. (3) Initial condition index: temperature, drainage area, initial pressure. (4) Operational index: bottom-hole flowing pressure, number of hydraulic fractures, horizontal section length. (5) Production index: initial production rate, cumulative production after 3 years, cumulative production after 5 years.
According to a recently acquired data-set[14], low, medium (most-likely), and high values for all parameters were defined (Table 1). The value of each index was defined as a number ranging between 1 and 100. Trapezoidal membership functions were defined for each category of each variable corresponding to the low-medium-high values. The starting point, midpoint and end point of abscissa in the trapezoidal membership function diagram corresponding to the low, medium and high values respectively. An example is shown in Fig. 5 for the hydraulic-fracture quality. These membership functions control the corresponding categories for different values of each parameter. For example, trapezoidal membership function for fracture length is defined in the following way: If fracture length is less than 228.6 m (750 ft), it is considered as 100% LOW. If fracture length is 228.6-304.8 m (750-1000 ft), it belongs to LOW and MID categories at varying degrees. If fracture length is between 304.8 m (1000 ft) and 457.2 m (1500 ft), it is considered as 100% MID. If fracture length is between 457.2 m (1500 ft) and 533.4 m (1750 ft), it has varying degrees of membership for LOW and MID categories. If fracture length is greater than 533.4 m (1750 ft), it is considered as 100% HIGH.
Table 1 Associated parameters and corresponding values for the re-fracturing well selection.
| Category | Hydraulic-fracture quality | Reservoir characteristics | Initial conditions | ||||||
|---|---|---|---|---|---|---|---|---|---|
| Fracture length/m(ft) | Fracture permeability/μm2 | Fracture width/mm(in) | Thickness/ m(ft) | Porosity/ % | Permeability/ 10-3 μm2 | Temperature/ °C(°F) | Drainage area/ km2(acre) | Initial pressure/ MPa(psi) | |
| LOW | 152.4(500) | 1 | 2.54(0.10) | 15.2(50) | 3 | 0.000 001 | 26.7(80) | 0.16(40) | 6.9(1 000) |
| MID | 381.0(1 250) | 50 | 6.35(0.25) | 68.6(225) | 14 | 0.050 000 | 82.2(180) | 4.05(1 000) | 31.0(4 500) |
| HIGH | 609.6(2 000) | 100 | 10.16(0.40) | 121.9(400) | 25 | 0.100 000 | 137.8(280) | 8.09(2 000) | 55.2(8 000) |
| Category | Operational parameters | Well performance | |||||||
| Bottom-hole flowing pressure/ MPa(psi) | Number of hydraulic fractures | Length of the horizontal-well/ m(ft) | Initial production rate/ (104 m3•d-1)(MMSCF•d-1) | 3-year cumulative recovery/ 108 m3(BCF) | 5-year cumulative recovery/ 108 m3(BCF) | ||||
| LOW | 0.1(15) | 1 | 304.8(1 000) | 2.8(1) | 0.03(0.1) | 0.03(0.1) | |||
| MID | 13.8(2 000) | 15 | 1 371.6(4 500) | 566.0(200) | 14.15(50) | 16.98(60) | |||
| HIGH | 27.6(4 000) | 30 | 2 438.4(8 000) | 1 132.0(400) | 113.20(400) | 176.88(625) | |||
Fig. 5.
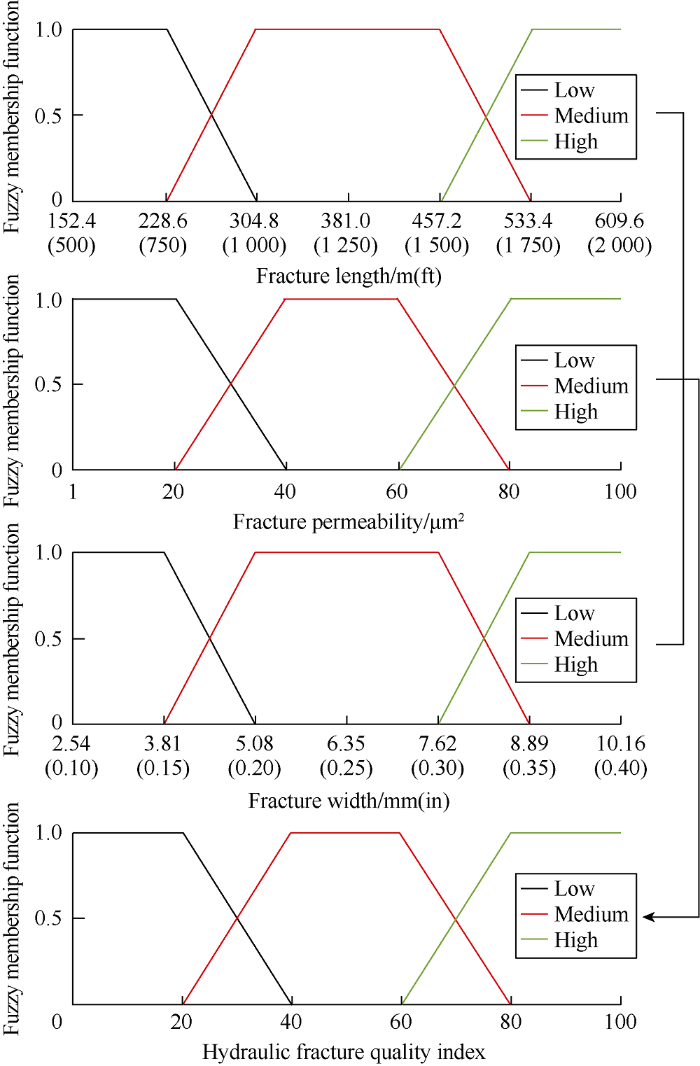
Fig. 5.
Hydraulic-fracture quality index and trapezoidal membership functions of its related parameters.
Depending on the quantity of a given parameter, corresponding categories are assigned. This triggers the associated rules related to that parameter. According to the associated rules, the defuzzification process assigns a crisp value for the output parameter, which is the hydraulic-fracture quality index for this case. An example rule is given as follows: IF Fracture Length is HIGH, Fracture Perm is HIGH, Fracture Width is MID; THEN Hydraulic Fracture Quality Index must be: HIGH. Since there are 3 input variables and 3 categories in each index, rules number must be defined as 33=27. All the associated rules of hydraulic fracture quality are listed in Table 2.
Table 2 Rules to characterize the hydraulic-fracture quality index.
| Rules | Rules parameters/index categories | |||
|---|---|---|---|---|
| Fracture length | Fracture permeability | Fracture width | Hyd. Frac. Qual. Index | |
| 1 | HIGH | HIGH | HIGH | HIGH |
| 2 | HIGH | HIGH | MID | HIGH |
| 3 | HIGH | HIGH | LOW | HIGH |
| 4 | HIGH | MID | HIGH | HIGH |
| 5 | HIGH | MID | MID | MID |
| 6 | HIGH | MID | LOW | MID |
| 7 | HIGH | LOW | HIGH | MID |
| 8 | HIGH | LOW | MID | MID |
| 9 | HIGH | LOW | LOW | MID |
| 10 | MID | HIGH | HIGH | HIGH |
| 11 | MID | HIGH | MID | MID |
| 12 | MID | HIGH | LOW | MID |
| 13 | MID | MID | HIGH | MID |
| 14 | MID | MID | MID | MID |
| 15 | MID | MID | LOW | MID |
| 16 | MID | LOW | HIGH | MID |
| 17 | MID | LOW | MID | MID |
| 18 | MID | LOW | LOW | LOW |
| 19 | LOW | HIGH | HIGH | HIGH |
| 20 | LOW | HIGH | MID | MID |
| 21 | LOW | HIGH | LOW | LOW |
| 22 | LOW | MID | HIGH | MID |
| 23 | LOW | MID | MID | MID |
| 24 | LOW | MID | LOW | LOW |
| 25 | LOW | LOW | HIGH | LOW |
| 26 | LOW | LOW | MID | LOW |
| 27 | LOW | LOW | LOW | LOW |
For the re-fracturing candidate selection, we set up another fuzzy inference system to judge whether a well is a good candidate for re-fracturing. This fuzzy inference system would process a new set of rules related to the reservoir characteristics, initial conditions, operational parameters, production and hydraulic fracture quality to give an output of the re-fracturing potential as a function of the existing hydraulic fracturing quality as shown in Fig. 6. The re-fracturing potential index can be found by subtracting the hydraulic fracturing quality index from 100. For example, if the reservoir index is HIGH and operational index is HIGH, the initial condition index is HIGH, the production index is LOW. Then the hydraulic fracture quality index must be LOW, therefore, the re-fracturing potential would be HIGH. Since there are 4 input variables and each variable has 3 categories, in this case, the number of rules that must be defined is 34=81.
Fig. 6.
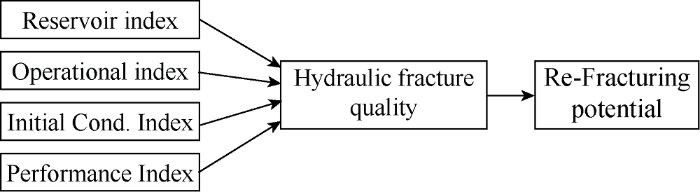
Fig. 6.
Structure of the fuzzy inference system for determining the re-fracturing potential of a given well.
1.3. Sample calculation of hydraulic fracturing quality
To demonstrate how the fuzzy inference system works to calculate a given index, an example calculation is given. In this example, the fracture is 304.8 m (1000 ft) in length, 30 μm2 in permeability and 5.08 mm (0.2 in) in width.
The fracture length of 304.8 m (1000 ft) falls into the 100% MID category with a membership function value of 1, only “If fracture length is MID” rule is triggered. The fracture perme-ability of 30 μm2 (50% MID, 50% LOW) falls into the transition zone between LOW and MID categories right in the middle of this zone, membership function values of 0.5 for both categories should be used. In this case, two rules are triggered: “If fracture permeability is LOW” and “If fracture permeability is MID”. Fracture width of 5.08 mm (0.2 in) falls into the 100% MID category with a membership function value of 1, only “If fracture width is MID” rule is triggered. It can be seen from the above analysis that 2 rules must be considered, that is rules 14 and 17 in Table 2. These two rules have fracture length and fracture width in the same category, but fracture permeability in different categories, and the hydraulic fracture quality in the same category of MID. This is the same with the outcome based on human reasoning.
The processing course of these rules is shown in Fig. 7. Mamdani inference method was used and all associated membership functions of the variables were considered, and the minimum one was transferred to the output, namely, the hydraulic fracture quality index. The reason that we used the minimum one is because these rules include AND operator. After repeating this process for both rules 14 and 17, the areas covered by the output variable membership functions were plotted and the overlapped area is extracted. Using the center of gravity method, the point that corresponds to the center of the area was found. The value on the x-axis is the value of the output variable. In this case, it is 50. Different input values could trigger different rules, so different categorical membership functions could be used in the output parameter, and different combined areas and thus different output values would be obtained.
Fig. 7.
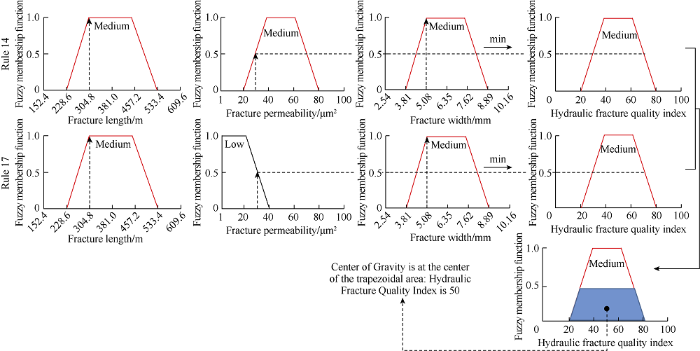
Fig. 7.
Aggregation of rules for the example case using the graphical Mamdani inference method and center of gravity calculation.
2. Results and discussion
To test the proposed re-fracturing well selection methodology, two cases were analyzed.
(1) Case 1: The cumulative gas production data presented in an earlier study[21] of a 1219.2 m (4000 ft) horizontal well with 30 fractures in the Granite Wash Formation and other average value of reservoir characteristic parameters in the same layer[22,23,24] as shown in Table 3 were used. The hydraulic fractures have a length of 170.1 m (558 ft), permeability of 9903 μm2, and width of 4.83 mm (0.19 in). According to the fuzzy inference system developed for quantifying the hydraulic-fracture quality, this kind of hydraulic fracture has a quality index of 16, corresponding to a 100% LOW category (Fig. 8). This means this well has a HIGH potential for re-fracturing. This is the conclusion drawn under given hydraulic fracture characteristics. If the hydraulic fracture information is not available, and what is available includes reservoir physical properties, operational (controllable) parameters, initial conditions and measured production data, the method presented in this paper was used to evaluate re-fracturing potential, and the result was compared with the evaluation result in the case with hydraulic fracture information available to verify this method. The results show that the reservoir characteristic index was 22.6, operational index was 59.2, initial condition index was 50.0, and the production index was 15.3. These four indices were input into the fuzzy inference system to find out the re-fracturing potential as shown in Fig. 9. This system quantified the re-fracturing potential as 84, which falls into the HIGH category. This matches with the result in the case with given hydraulic-fracture characteristics, and proves that the decision-making protocol presented in this paper is effective.
Table 3 Data used in the study cases and calculated results of the indices.
| Parameter/index | Granite Wash | Williams Fork |
|---|---|---|
| Fracture length | 170.1 m (558 ft) | 277.5 m (910.3 ft) |
| Fracture permeability | 9.903 μm2 | 8.793μm2 |
| Fracture width | 4.83 mm (0.19 in) | 5.69 mm (0.224 in) |
| Hydraulic-fracture quality index | 16 | 41 |
| Reservoir thickness | 20.4 m (67 ft) | 59.9 m (196.5 ft) |
| Porosity | 9.1% | 10% |
| Permeability | 0.001 27×10-3 μm2 | 0.019×10⁻³ μm2 |
| Reservoir characteristic index | 22.6 | 48.9 |
| Temperature | 93.3 °C(200 °F) | 60 °C(140 °F) |
| Drainage area | 0.67 km2 (165.3 acre) | 1.51 km2 (371.9 acre) |
| Initial pressure | 41.4 Mpa (6000 psi) | 27.6 Mpa (4000 psi) |
| Initial Condition Index | 50 | 50 |
| Bottom-hole flowing pressure | 8.4 MPa (1215 psi) | 6.9 MPa (1000 psi) |
| Number of hydraulic fractures | 30 | 10 |
| Length of the horizontal section | 1219.2 m (4000 ft) | 609.6 m (2000 ft) |
| Operational Index | 59.2 | 43.2 |
| Initial production rate | 36.5×10⁴ m3/d (12.912 MMSCF/d) | 415.2×10⁴ m3/d (146.7 MMSCF/d) |
| 3-year cumulative recovery | 0.85×10⁸ m3 (3 BCF) | 3.85×10⁸ m3 (13.6 BCF) |
| 5-year cumulative recovery | 1.02×10⁸ m3 (3.6 BCF) | 4.56×10⁸ m3 (16.1 BCF) |
| Performance index | 15.3 | 27.7 |
Fig. 8.
Fig. 8.
Quantification of hydraulic fracture quality for Case-1 using fracture length, permeability, and width.
Fig. 9.

Fig. 9.
Quantification of re-fracturing potential for Case-1 using reservoir characteristic, operational parameter, initial condition, and production.
(2) Case 2: The data of Williams Fork Formation in Colorado in US from published studies[2-3, 25] was used. The data is shown in Table 3. The fractures have a length of 277.5 m (910.3 ft), permeability of 8.793 μm2, and width of 5.69 mm (0.224 in). The hydraulic-fracture quality index calculated is 41 (Fig. 10), corresponding to the MID category and very close to the transition region of LOW-MID category, indicating that the well is MID in re-fracturing potential, close to MID-HIGH. As shown in Table 3, reservoir characteristic index was 48.9, operational index was 43.2, initial condition index was 50, and production index was 27.7. Fig. 11 shows the output of the fuzzy-inference system after inputting these indices. The re-fracturing potential index was 67, belonging to MID-HIGH category. This is consistent with the result obtained in the case with known hydraulic fracture information, proving again the method proposed in this paper works well.
Fig. 10.
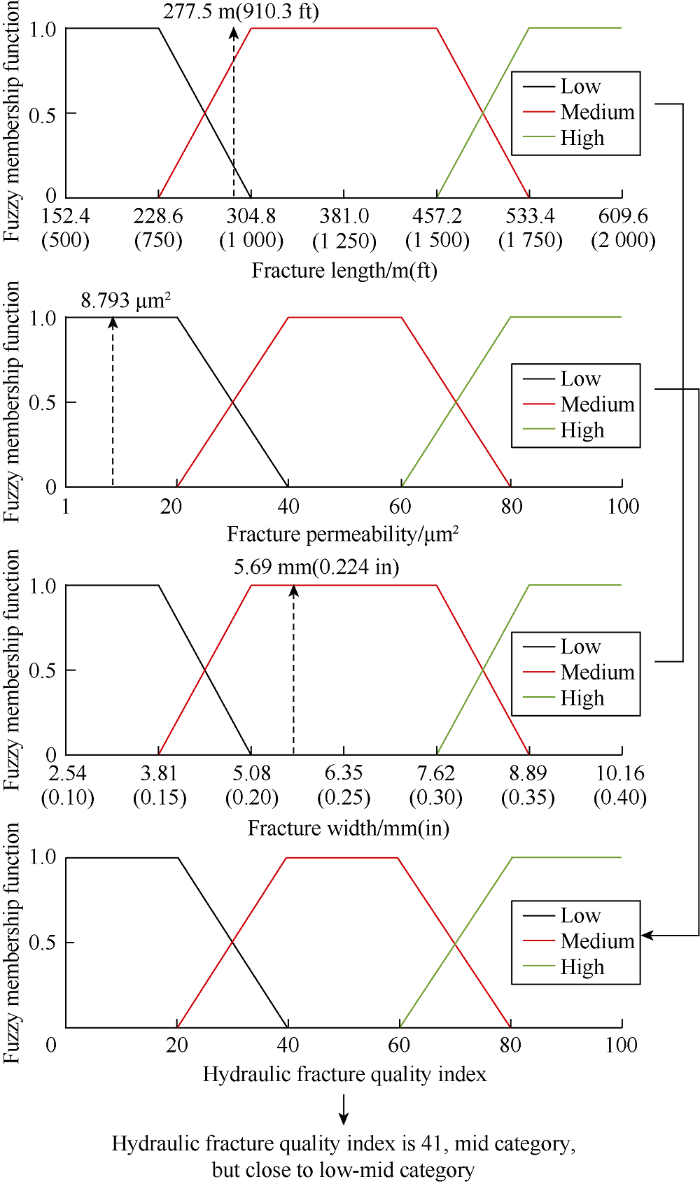
Fig. 10.
Quantification of hydraulic fracture quality for Case-2 using fracture length, permeability, and width.
Fig. 11.
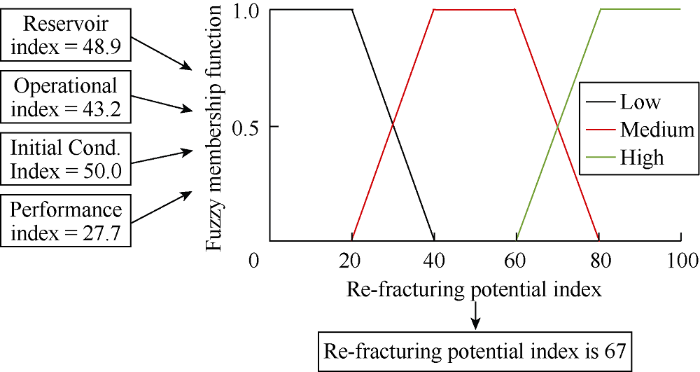
Fig. 11.
Quantification of re-fracturing potential for Case-2 using reservoir characteristic, operational parameter, initial condition, and production.
3. Conclusions
An artificial-intelligence based decision-making protocol has been developed for tight sandstone gas reservoirs to identify candidate wells with re-fracturing potential. The decision protocol is based on fuzzy inference in which all related parameters are converted into fuzzy variables with membership functions of LOW-MID-HIGH categories. These parameters altogether are used to output dimensionless, representative indices (reservoir, operational parameter, initial condition, production, and hydraulic-fracture quality, etc.). When reser- voir, operational, initial condition and production indices are used as input, the hydraulic fracture quality index can be out- put, and then re-fracturing potential index can be worked out.
This method incorporates human-reasoning into linguistic rules, and can process a large number of rules simultaneously to reach the goal of quick evaluation or decision (while humans can process one rule at a time). Case studies show this protocol can evaluate the re-fracturing potential accurately.
By changing input and output parameters, and re-defining membership functions and related rules, the methodology can be promoted to other types of reservoirs.
Nomenclature
An—category of the variable in the nth rule;
A11, A12—categories of variables 1 and 2 in rule 1;
A21, A22—categories of variables 1 and 2 in rule 2;
Bn—category of output parameter in the nth rule;
I(i), I(j)—input values of variables 1 and 2;
n—number of rules;
x—input variable;
x1, x2—variables 1 and 2;
y—output parameter;
μ—membership function value, with range of [0,1].
Reference
Global unconventional gas resource assessment
Restimulation technology for tight gas sand wells
Restimulation of tight gas sand wells in the Rocky Mountain Region
A diagnostic technique for restimulation candidate selection
Selecting candidate wells for refracturing using production data
Big-data analytics for production-data classification using feature detection: Application to restimulation-candidate selection
Restimulation candidate selection methodologies and treatment optimization
Artificial neural networks identify restimulation candidates in the Red Oak Field
Development of an intelligent systems approach for restimulation candidate selection
The definitive identification of candidate wells for refracturing
Characterization of tight-gas sand reservoirs from horizontal-well performance data using an inverse neural network
DOI:10.1016/j.jngse.2018.08.017 URL [Cited within: 1]
Refracs: Why do they work, and why do they fail in 100 published field studies?
Fuzzy sets
DOI:10.1016/S0019-9958(65)90241-X URL [Cited within: 2]
Development of a data-driven forecasting tool for hydraulically fractured, horizontal wells in tight-gas sands
Mapping the natural fracture network in Utica Shale using artificial intelligence (AI)
Shale analytics: Data-driven analytics in unconventional resources
An experiment in linguistic synthesis with a fuzzy logic controller
DOI:10.1016/S0020-7373(75)80002-2 URL [Cited within: 1]
Microelectronic design of fuzzy logic-based systems. 1st ed
Fuzzy logic with engineering applications. 2nd ed
A fuzzy toolbox for the R programming language: IEEE International Conference on Fuzzy Systems Proceedings
Texas panhandle granite wash formation: Horizontal development solutions
Open hole multi- stage completion system in unconventional plays: Efficiency, effectiveness and economic
A comparison of proppant placement, well performance, and estimated ultimate recovery between horizontal wells completed with multi- cluster plug & perf and hydraulically activated frac ports in a tight gas reservoir
Unconventional oil and gas resources handbook
Optimization of hydraulic fracture treatment in the Williams Fork Formation of the Mesaverde Group
