


Introduction
Because the nuclear magnetic resonance relaxation mechanism is related to the hydrogen atoms in formation, it can provide pore and fluid information that is not related to the lithology of the formation[1]. Nuclear magnetic resonance technology is widely used to evaluate the reservoir pore structure in petroleum logging. The NMR T2 spectra can be used to accurately calculate the total porosity of the reservoir, which, combined with the capillary pressure curve, enables continuous analysis of the pore structure of complex reservoirs[2]. The T2 spectral response characteristics can also reflect the reservoir’s wettability and fluid viscosity[3], and other information. There are five methods for identifying fluid properties using nuclear magnetic resonance technology, the difference spectrum method (DMS) and the time method (TDA) have theoretical support, while the shift spectrum method (SSM), the diffusion analysis method (DIFAN) and the enhancement diffusion method (EDM) are mainly empirical methods, which can not solve the problem of overlapping of T2 spectra between oil and water[4]. These five methods have low fluid recognition ability in low-porosity reservoirs. In the past, the scholars in China and abroad have proposed some new methods to identify the properties of fluids using nuclear magnetic resonance technology. In 2015, JIANG et al.[5] used the factor analysis method proposed by JAIN et al.[6] to evaluate the exploitability and quality of shale oil and gas reservoirs, confirming that this technology has great potential in identifying fluid properties. In 2016, Hu et al.[7] proposed to use the T2 spectral information measured in the mode of long waiting time and short echo interval to construct the T2 spectra in completely water-containing state, and tell the fluid properties by comparing the differences between the measured T2 spectra and the constructed T2 spectra of water. This method has better effect in identifying fluids in medium-high porosity and permeability reservoirs, but has lower identification accuracy in tight reservoirs[7]. From the previous studies, the application value of nuclear magnetic resonance technology in identifying fluids in low permeability reservoirs needs to be further researched.
Taking the Mesozoic Ordos Basin as an example, we decomposed the T2 spectra from the perspective of signal processing and found that the NMR T2 spectrum could be decomposed into 2-5 independent component spectra. Based on the NMR theory, these component spectra can be determined as clay bound water component, capillary bound fluid component, micro-pore fluid component and marco-pore fluid component. The core nuclear magnetic resonance experiment results in the states of oil driving water and water driving oil were compared and analyzed to study the characteristics of T2 spectra of free oil and free water and the characteristics of T2 spectrum components of core containing oil and water. Finally, a new method to identify fluid properties using nuclear magnetic resonance technology has been worked out. By using this method to decompose the standard T2 spectra, the T2 component spectral characteristics under the macro T2 spectrum can be further analyzed, using these microscopic features to identify properties of fluids in low porosity and permeability reservoirs has a good application effect.
1. Characteristics of NMR T2 spectrum and decomposition method
1.1. The T2 spectrum
The NMR tool measures the relaxation signals of hydrogen atoms, and uses the CPMG pulse sequences to represent the echo signals. Through the attenuation process of echo signals, the transverse relaxation time (T2 time) can be calculated, and the echo amplitude decays exponentially at the rate of 1/T2[1,2] (Fig. 1a). This process can be fitted with the multi-exponential formula:
where $t\text{=2}n\tau $
Fig. 1.
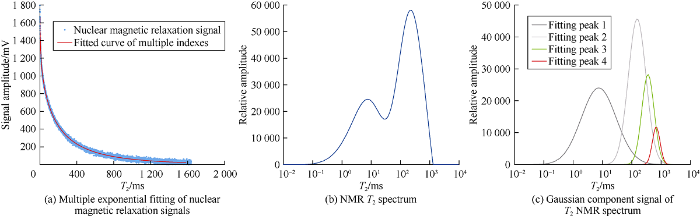
Fig. 1.
NMR T2 spectral characteristics and Gaussian component signals.
The T2 spectrum can be obtained by multi-exponential inversion fitting of the hydrogen atom spin echoes using formula (1) (Fig. 1b). In order to improve the signal-to-noise ratio (SNR) during the inversion of the T2 spectra, the T2 spectrum can be accumulated multiple times in depth domain to improve the accuracy of T2 spectral inversion. To improve the calculation quality and speed, a large number of basis functions are also used in this process.
Studies have shown that the T2 spectra can be regarded as the result of linear superposition of multiple normal distribution curves. Both the characterization of echo strings and inversion process of the T2 spectrum use statistical principles and methods. The central limit theorem points out that given an arbitrary sample population, n samples are randomly selected from the population for m times in total, and then the m groups of samples are accumulated and the average values of them are calculated. The distribution of the average values is approximately normal[8]. From the measurement and inversion process of T2 spectrum, we know that T2 spectrum is in accordance with the normal distribution. Therefore, it can be accurately fitted with multiple independent normal distribution curves (Fig. 1c). Conversely, the T2 spectrum can be decomposed into multiple component spectra, and the information of pore and fluid is included in these component spectra.
1.2. NMR T2 spectral decomposition
In signal processing, the signal that conforms to the normal distribution is called a Gaussian signal, and the T2 spectrum is the signal that reflects the reservoir pore and fluid information. In this paper, these Gaussian signals of the T2 spectra are called T2 component spectra. A single Gaussian signal (Fig. 2) can be expressed by the following formula:
Therefore, to decompose the T2 spectrum into T2 component spectra, the a and σ need to be derived using signal processing methods. After the component spectra are obtained, the fitted T2 spectrum can be obtained by multi-Gaussian fitting (hereinafter referred to as T2° spectrum). Generally, the confidence of fitting between T2° spectrum and T2 spectrum can reach more than 99%, and the T2 spectrum information is completely retained. And so, using T2 component spectra to analyze the pore structure and fluid properties of the reservoir is feasible.
Fig. 2.
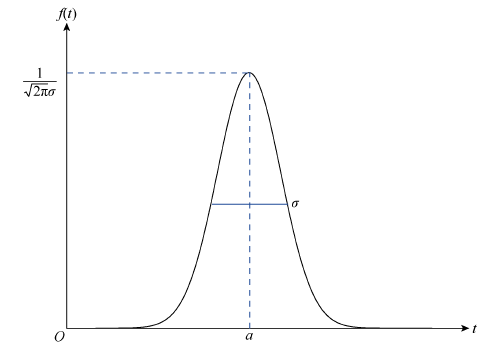
Fig. 2.
Characteristics of single Gaussian signal.
1.2.1. Peak seeking of NMR T2 spectrum
The NMR T2 spectrum in this paper is represented by 128 data points. These data points are arranged in sequence according to the serial number to form a linearly scaled T2 spectrum (Fig. 3a-c). These data points are sequentially distributed on the logarithmic time axis of T2 to obtain the T2 spectrum with petrophysical significance shown in Fig. 1b. The signal processing is usually completed on a linear scale. The linear scale is used in the calculation process, and after the decomposition is completed, it is restored to the logarithmic time axis.
Fig. 3.
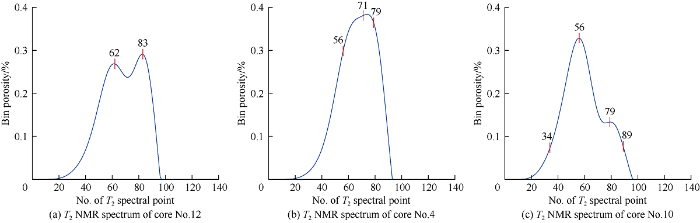
Fig. 3.
Peak positions of Gaussian components corresponding to different T2 spectrum.
The peak seeking of the T2 spectrum is to find the peak center (a) of multiple Gaussian components of the T2 spectrum. When classifying the T2 spectrum by conventional methods, the local maximum value is usually considered to be the peak center (see 62 and 83 in Fig. 3a). However, for the T2 spectrum shown in Fig. 3b, almost only one peak can be found by methods such as local maximum and window search methods (see 71 in Fig. 3b). By using the signal processing method, two other hidden peaks can be found (see 56 and 79 in Fig. 3b). The T2 spectrum shown in Fig. 3c is a common type, which has two hidden peaks (see 34, 89 in Fig. 3c) except for two obvious peaks (see 56 and 79 in Fig. 3c). To find these hidden peaks, we need to use signal processing algorithms, such as derivative method, convolution method, and wavelet transform method to achieve accurate peak seeking.
Comparison shows that the wavelet transform algorithm has the best peak-seeking effect and easy computation. The signal spectrum is transformed into a wavelet space, and the shape information in the wavelet coefficients is used to seek the peak information of the spectrum without additional processing of the T2 spectrum. This algorithm can seek the local maximum peaks and hidden peaks, is high in calculation accuracy, and requires fewer parameters. It can also provide a and σ[9]. After obtaining these two pieces of basic information, you can use equation (2) to accurately fit the T2 spectrum.
1.2.2. Decomposition and fitting of the T2 spectrum
Fitting the T2 spectrum with multiple Gaussian functions optimally can obtain a highly accurate T2° spectrum. The decomposition process is divided into two steps: First, the wavelet transform is used to find the peaks to obtain a and σ, the number of peaks in T2 spectrum corresponds to the number of (a, σ) groups, and the number of Gaussian functions. Then these functions are used to achieve accurate fitting of the original T2 spectrum, when the fitting confidence is over 98%, the resulting Gaussian component is the desired T2 component spectra (Fig. 4).
Fig. 4.
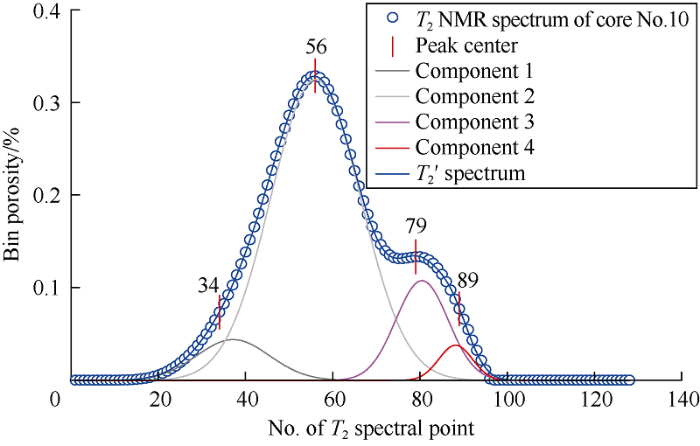
Fig. 4.
Decomposition of T2 spectrum by optimization Gaussian. algorithm.
Gaussian fitting algorithm uses the Gaussian function (equation 2) to approximate the T2 spectral point data in the optimal fitting tool. This method does not require very accurate a and σ. By using the least square method to optimize the fitting process and control the error range, the accurate T2° spectrum can be obtained after enough iterations (Fig. 4).
To decompose the T2 spectrum in Fig. 4 (the blue circles in the figure are the experimental data points), four peak center values were found using the wavelet transform peak-finding operation (see 34, 56, 79, 89 in Fig. 4). The a and σ of these four peaks were input into the optimal fitting tool, and four Gaussian components were returned (see components 1-4 in Fig. 4). Comparison shows the original T2 spectrum (blue circles) and the fitted T2° spectrum (blue solid line) almost completely coincide. In this way, the information of original T2 spectrum is accurately decomposed into four components. The peak center values output by the optimal fitting tool are 37.146, 56.074, 80.445, 88.154, which have a little difference from the peak center values input, the fitting correlation coefficient reaches 99.9%, indicating high fitting accuracy.
To further evaluate the decomposition accuracy, the porosity information reflected by the T2 spectrum was analyzed. The area enclosed by the T2 spectrum and the horizontal axis is equal to the total porosity of the core. Through integral calculation, it is found that the total porosity reflected by the original T2 spectrum is equal to the total porosity reflected by the fitted T2' spectrum (Table 1). The component porosity of components 1-4 and their ratios to the total porosity were also calculated. We can see from Table 1 that the sum of the four component porosities is equal to the total porosity of the T2' spectrum. The component 2 and component 3 account for a larger proportion, the component 1 takes the third place and component 4 is the smallest, which reflect the composition of macropores, mesopores, small pores and micropores in the core. T2 component spectra not only completely retain the information of the original T2 spectrum, but also reasonably decompose the information of the total pores.
Table 1 Original T2 spectrum and T2° spectrum porosity.
| Spectrum | Name | Component porosity/% | Component ratio/% | Total porosity/% |
|---|---|---|---|---|
| Original T2 spectrum | Component 1 | 0.925 0 | 8.17 | 11.325 4 |
| Component 2 | 8.409 2 | 74.26 | ||
| Fitted T2° spectrum | Component 3 | 1.622 6 | 14.33 | 11.324 1 |
| Component 4 | 0.367 4 | 3.24 |
2. Petrophysical significance of the component spectra
2.1. T2 spectral distribution characteristics of crude oil and water in free state
Fluids in water-wet reservoirs are divided into: clay-bound water, capillary-bound water and movable fluids. Oil, gas and water are often in different positions in the pores, and most of the oil and gas exist in the marcopores[10]. The movable fluid is usually a mixture of oil and water.
To clarify the response characteristics of the oil and water phases on the component spectrum and to identify fluid properties by using component spectrum, the T2 spectra of crude oil, primary formation water and the NaCl2 solution prepared in laboratory were measured. The crude oil and primary formation water were from the reservoirs in Chang 2, Chang 6 and Chang 7 members of Mesozoic Yanchang Formation, in Ordos Basin (Fig. 5a-5e). The NaCl2 solutions had salinities of 6 000 mg/L and 80 000 mg/L, respectively. The primary formation waters of Chang 2, Chang 6 and Chang 7 had salinities of 45 815, 56 488 and 43 926 mg/L, respectively (Fig. 5a and 5d). Only one peak was obtained by decomposing T2 spectrum of water sample with the above method. The T2 spectra peaks of the two NaCl2 solutions almost coincide at 2 800 ms, the T2 spectral peaks of the three types of primary formation water are distributed between 100 and 600 ms. The spectrum of formation water significantly shifted to the left compared with the NaCl2 solution T2 spectrum, and the water sample’s T2 spectrum distribution has no obvious correlation with the formation water salinity. The formation water analysis data shows that the main chemical ions in the primary formation water include K+, Na+, Ca2+, Mg2+, Cl-, SO42-, CO32-, and HCO3-. Due to the influence of HCO3- concentration on T2 spectrum, the T2 spectrum of the primary formation water is not as concentrated as the NaCl2 solution.
Fig. 5.
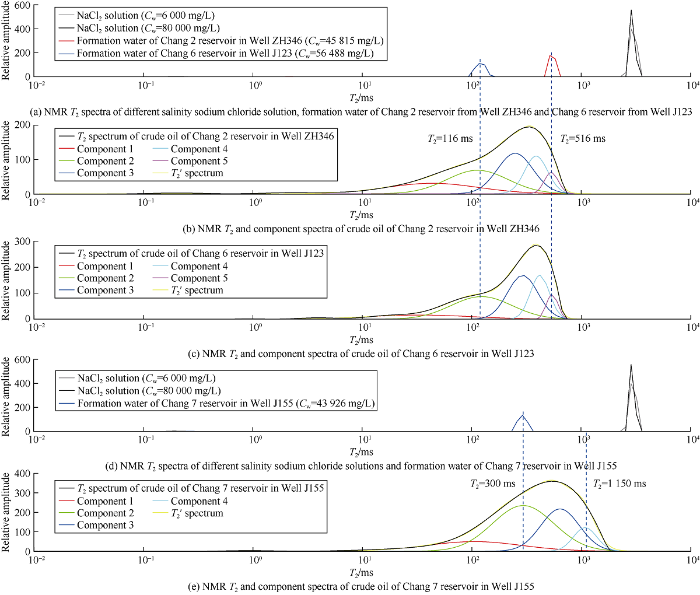
Fig. 5.
T2 spectra and component spectrum characteristics of crude oil and formation water in Chang 2, Chang 6 and Chang 7 members of Ordos Basin.
The nuclear magnetic free relaxation characteristics of crude oil are related to its composition, viscosity and temperature. The crude oils of Mesozoic reservoirs in the Ordos Basin are basically light oil (Table 2), with a density range of 0.825-0.849 g/cm3 in Jurassic Yan 4+5 Member to Triassic Chang 10 Member, and an average density of 0.838 g/cm3, a viscosity range of 4.66-6.90 mPa·s, and an average viscosity of 8.83 mPa·s. Except crude oils from Chang 7 and Chang 10 with viscosity of less than 5.00 mPa·s, oils from the other members have little variation in viscosity. The crude oils have a water cut range of 0.76%-9.00%, in which the Jurassic Yan 6 Member has the smallest and the Triassic Chang 2 Member has the larger water cut, and the water appears in forms of emulsified water and residual free water. The crude oil samples measured in this experiment were from Chang 2, Chang 6 and Chang 7 members in the Ordos Basin, and have close densities of 0. 847, 0.834, 0.837 g/cm3 respectively, and an average density of 0.839 g/cm3. The oil samples differ widely in viscosity. At 50 °C, the crude oil samples from Chang 2, Chang 6 and Chang 7 have a viscosity of 6.90, 5.67, and 4.70 mPa·s, respectively. Because crude oil is a mixture of different types of hydrocarbons, the response of nuclear magnetic relaxation time is not single, instead, it consists of a set of relaxation time distributions with a large span[11]. The relaxation time of Chang 2 and Chang 6 oils is 10-1 000 ms, and that of Chang 7 oil is 10-2 000 ms (Fig. 5b, c and e). Since the crude oil from Chang 7 is lower in viscosity than those from Chang 2 and Chang 6, and their distribution characteristics of the T2 spectra are also significantly different. After the T2 spectra of crude oil are decomposed, five components are obtained from the crude oils from Chang 2 and Chang 6 (Fig. 5b and c), in which component 2 and component 5 are basically consistent with the T2 spectrum peaks of formation waters from Chang 2 and Chang 6 (Fig. 5a). Since the crude oil samples were all sampled from oil-water reservoirs, it can be considered that component 2 and component 5 are the peaks of free water or emulsified water in crude oil. Component 3 and component 4 are the T2 component spectra of crude oil, and the peaks of the two components of crude oil are between 116-516 ms.
Table 2 Statistics of properties of crude oil samples from various Mesozoic reservoirs in Ordos Basin.
| Formation | Density/ (g·cm-3) | Temperature of density measurement/°C | Viscosity/ (mPa·s) | Temperature of viscosity measurement/°C | Water content/% | Asphaltene content/% | Freezing point/°C | Initial boiling point/°C | |
|---|---|---|---|---|---|---|---|---|---|
| System | Memeber | ||||||||
| Jurassic | Yan4 + 5 | 0.836 | 20 | 6.84 | 50 | 3.09 | 0.44 | 18.48 | 68.03 |
| Yan6 | 0.834 | 20 | 5.67 | 50 | 0.76 | 3.71 | 18.47 | 66.51 | |
| Yan7 | 0.839 | 20 | 5.64 | 50 | 1.29 | 2.92 | 19.65 | 67.75 | |
| Yan8 | 0.841 | 20 | 6.17 | 50 | 2.78 | 3.71 | 18.72 | 70.71 | |
| Yan9 | 0.837 | 20 | 6.38 | 50 | 3.99 | 2.32 | 19.25 | 74.27 | |
| Yan10 | 0.840 | 20 | 5.76 | 50 | 2.35 | 0.89 | 18.40 | 72.77 | |
| Triassic | Chang 1 | 0.836 | 20 | 6.54 | 50 | 4.37 | 0.90 | 18.05 | 67.09 |
| Chang 2 | 0.847 | 20 | 6.90 | 50 | 9.00 | 1.84 | 18.62 | 72.43 | |
| Chang 3 | 0.841 | 20 | 5.72 | 50 | 4.09 | 2.03 | 18.36 | 69.56 | |
| Chang 4 + 5 | 0.849 | 20 | 5.58 | 50 | 3.21 | 2.33 | 19.25 | 71.60 | |
| Chang 6 | 0.834 | 20 | 5.67 | 50 | 5.83 | 1.76 | 20.29 | 69.14 | |
| Chang 7 | 0.837 | 20 | 4.70 | 50 | 2.26 | 0.63 | 18.01 | 66.31 | |
| Chang 8 | 0.838 | 20 | 5.64 | 50 | 2.20 | 1.80 | 18.60 | 69.32 | |
| Chang 9 | 0.834 | 20 | 5.59 | 50 | 2.67 | 20.22 | 68.92 | ||
| Chang 10 | 0.825 | 20 | 4.66 | 50 | 5.15 | 21.69 | 67.14 | ||
After decomposing the T2 spectrum of crude oil from Chang 7, four components were obtained (Fig. 5e), the component 2 corresponds to the T2 spectrum peak of formation water in Chang 7, it can be regarded as the peak of free water or emulsified water, component 3 and component 4 are the T2 spectrum components of crude oil, the peaks of the two components of the crude oil are between 300 and 1150 ms.
Based on the component spectrum characteristics of the crude oil and primary formation water, the T2 component spectrum of residual free water and emulsified water in the crude oil can be separated to highlight the crude oil component spectrum and determine the location of the main component spectrum peaks of the crude oil. In water-wet rocks, the surface of crude oil and rock particles in the pores is isolated by capillary bound water, and the nuclear magnetic resonance relaxation of crude oil is mainly manifested as free relaxation[12]. The T2 spectral peak with a longer relaxation time is usually contributed by the hydrogen nucleus in the most movable light components of crude oil. The T2 spectral peak with a shorter relaxation time corresponds to the hydrogen nucleus in the heavy components with restricted motion in crude oil [11]. Excluding the component spectra of water in the T2 spectrum, oil samples from Chang 2, Chang 6 and Chang 7, all have two more obvious long relaxation component spectra (component 3 and component 4), only because of the different viscosity of the crude oil samples, they differ in distribution position. This phenomenon can be used to qualitatively identify the fluid properties in water-wet reservoirs.
2.2. T2 component spectral characteristics of the oil and water in rock pores
Previous studies suggested that when the reservoir fluid is the wetting phase, its free relaxation is often negligible, but the non-wetting phase fluid still has free relaxation because it is not in contact with the surface of the rock particles, and when the fluid exists in marcopores, even the free relaxation of wetting phase will have strong impact on the relaxation process of the hydrogen nucleus[13]. This point has been confirmed by the nuclear NMR experiment T2 spectrum decomposition.
Fig. 6a shows the T2 spectra of NaCl2 solutions with different salinities and formation water in free state. Fig. 6b shows the T2 spectrum and component spectra of core No 23-16 from Chang 6 in Ordos (water-wet core sample, withφ=13.2%, K=0.874×10⁻³μm2) with 100% water content. Fig. 6c shows the T2 spectrum and component spectra of the crude oil from Chang 6 of Well J123 in the Ordos basin. Fig. 6d shows the T2 spectrum and component spectra of the same core in Fig. 6b containing bound water and movable oil.
Fig. 6.
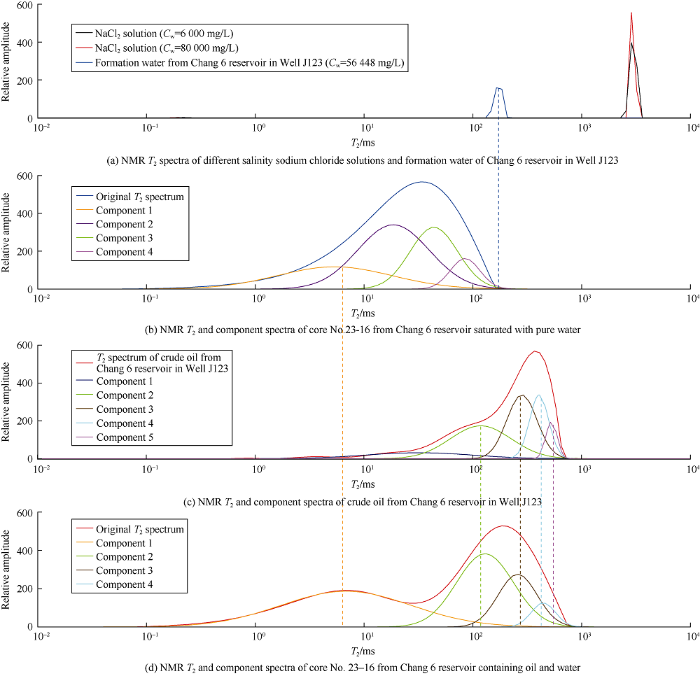
Fig. 6.
Characteristics of T2 decomposition spectra of the same core containing oil and water in Chang 6 of Ordos Basin.
Analyzing the spectrum peaks of the formation water in free state (Fig. 6a) and the spectrum peaks in restricted pore space (Fig. 6b) shows that the spectrum peaks in the restricted pores move to the left and disperse significantly (see the blue peak in Fig. 6b). At this point, the T2 component spectra can be used to evaluate the pore structure. According to the nuclear magnetic resonance theory, the four component spectra can be given clear rock physical significance. In Fig. 6b, component 1 is clay bound water, component 2 is capillary bound water, component 3 is micropore water and component 4 is macropore water.
When all the movable fluids in the pores are displaced by oil, the core T2 spectrum (see red spectrum in Fig. 6d) has a significant left shift of peaks than the T2 spectrum in the free state of crude oil (see red spectrum in Fig. 6c), while the position of the spectrum peak of the clay bound water is basically unchanged (see component 1 in Fig. 6b and d), which is consistent with the traditional understanding. From the analysis in section 2.1, we can see that in Fig. 6c, component 2 and component 5 are considered to be the spectrum peaks of formation water, and component 3 and component 4 are the peaks of crude oil. Comparing Fig. 6c and Fig. 6d, the positions of the spectrum peaks of component 3 and component 4 of the crude oil in the free state and the restricted pore space remain unchanged basically. This just proves that in the restricted pore space, the non-wetting phase fluid (crude oil) still has free relaxation. Only this phenomenon is masked by the macroscopic appearance of the original T2 spectrum, and is not easily recognized. After T2 spectrum decomposition, this phenomenon is relatively obvious in the component spectra. In contrast, the component spectrum of the wet phase fluid (water) is more complicated and needs to be studied separately. However, this does not affect us to identify fluid properties using this feature of the crude oil component spectrum in water-wet conditions.
2.3. T2 component spectral characteristics at different oil saturations
Six cores of the Chang 6 reservoir in the mature development zone in the northern Ordos Basin were selected for NMR experiments. They have an average porosity of 15.03%, a maximum porosity of 18.80%, and a minimum porosity of 13.20%; an average permeability of 4.22×10⁻³ μm2, a minimum permeability of 0.87×10⁻³ μm2, and a maximum permeability of 9.05×10⁻³ μm2. In the experiments, the T2 spectra of the cores saturated with water during oil displacing water process and T2 spectra at different oil saturations during water displacing oil process were collected. The study shows that with the change of oil saturation, the peak position of T2 spectrum changes regularly. Take the core from Chang 6 in Well LJ36-361 (No: 23-16, with ϕ of 13.2% and K of 0.87×10⁻³ μm2, water-wet sample) as an example (Fig. 7), the T2 spectra under these six states were decomposed to obtain four component spectra respectively.
Fig. 7.
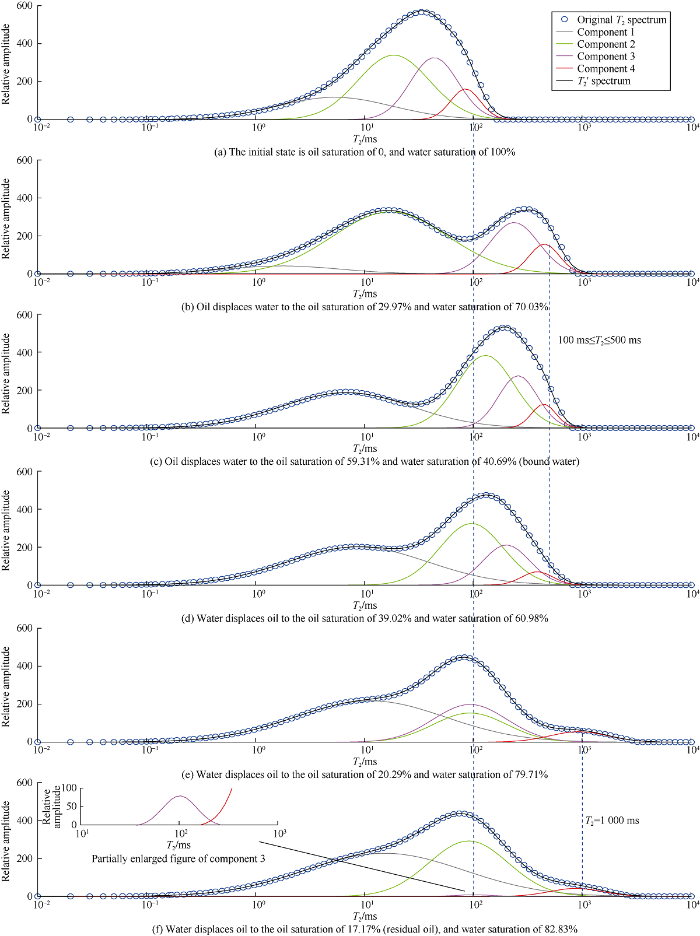
Fig. 7.
T2 decomposition spectral characteristics of the same core from Chang 6 reservoir in Well LJ36-361 at different oil saturations.
Fig. 7a shows the measured T2 spectrum of the core fully saturated with formation water with a salinity of 85 000 mg/L (water type is CaCl2 type) after oil washing and salt washing. The peaks of four component spectra are located at 5-100 ms. Since the water saturation of the rock sample is 100%, these four component spectra are signals of water, and their distribution characteristics directly reflect the pore structure of the core. Fig. 7b, c shows the spectra during oil displacing water process. The oil saturation in the Fig. 7b state is 29.97%, the water saturation is 70.03%. The oil saturation in the Fig. 7c is 59.31%, and the water saturation is 40.69% (bound water saturation). Fig. 7d, f shows the spectra during water displacing oil process, the oil saturation in Fig. 7d is 39.02%, the water saturation is 60.98%. The oil saturation in Fig. 7e is 20.29%, the water saturation is 79.71%. The oil saturation in Fig. 7f is 17.17% (residual oil saturation), the water saturation is 82.83%. In the whole displacement process, the peak positions of components 2, 3 and 4 have strong regularity. When the oil saturation is greater than or equal to about 30% (Fig. 7b-7d), the peaks of components 3 and 4 appear at the same time from 165 to 500 ms. At this point, part of the bound water in the capillary represented by component 2 is also displaced by oil, consequently, the peak of component 2 moved to the right (Fig. 7c and 7d). In the water flooding process (Fig. 7e and 7f), as the oil saturation decreases below 30%, the spectral peak position of component 4 is basically unchanged, but the signal amplitude becomes smaller, and the component 3 becomes slightly smaller in amplitude and shifts slightly to the left in peak position. When the oil saturation continues to decrease, the peaks position of component 3 and component 2 gradually change from basic to full coincidence (Fig. 7d-7f), indicating that the oil in component 3 is completely displaced. When the oil content is reduced to the residual level (Fig. 7f), the component 4 becomes lower in amplitude gradually and longer in relaxation time, indicating some residual crude oil is left in the macropores.
To analyze the processes of oil displacing water and water displacing oil in the core by T2 spectrum decomposition method, it can be clearly seen that the clay bound water (component 1) has not changed much in the whole processes. Part of capillary bound water (component 2) is displaced by oil during oil displacing water process, causing the component 2 spectral peak to shift to the right, but under the action of the capillary, this part of water doesn’t change during the subsequent water-displacing oil process, and the position of the component 2 peak hardly changes either (Fig. 7c-f). For the small pores (component 3), the peak shifts to the right as the amount of oil injected increases; while in the water displacing oil process, with the decrease of oil saturation, the peak position gradually shifts to the left, until it coincides (or disappears) with component 2, indicating that all the oil in the micropores is displaced out. The macropores (component 4) are first filled with oil during oil displacing water process, and its amplitude signal decreases first when the oil saturation decreases. When the oil saturation is close to the residual oil state, its peak position stabilizes at 1000 ms and doesn’t change any more.
In conclusion, when the rock contains oil, the components 3 and 4 (the spectral peaks fall between 165 ms and 500 ms) after the T2 spectrum decomposition represent most of the information of movable oil, and the remaining components are the information of water and worthless bound and residual oil. This conclusion is basically consistent with the analysis result of the T2 spectrum when the crude oil relaxes freely (Fig. 5). By decomposing the T2 spectrum and studying the distribution position of the component spectral peaks on the time axis of T2, if the reservoir in Chang 6 has a strong component spectral peak signals at 165-500 ms, it can be concluded that the reservoir contains oil; while if the peak is outside this area, the reservoir contains water.
3. Identification of oil and water layers by the T2 spectral decomposition method
3.1. Identification of oil layer
Well L16 is a petroleum exploration well in the north of Ordos Basin. In Chang 6 reservoir, the oil layers and oil-water layers of 20.2 m thick combined were interpreted from logging (see track 5 in Fig. 8). The core taken from this section is fine sandstone with oil spots, and the reservoir has a core analysis porosity of 14.50%, analysis permeability of 0.98×10⁻³ μm2, acoustic moveout of 240.31 μs/m, density of 2.43 g/cm3, and resistivity of 9.4 Ω•m. The well was tested by hydraulic sand blasting and fracturing. The oil layers at 1 876 m and 1 884 m were perforated and fractured with fracturing fluid of slick water plus crosslinked guanidine gum with 35.0 m3 of sand added (sand ratio of 20%), at the injection rate of 1.6 m3/min. In test production at tubing displacement of 1.4 m3/min and casing displacement of 0.2 m3/min, the well obtained a pure industrial oil flow of 55.42 t/d, proving the two layers were oil layers.
Fig. 8.
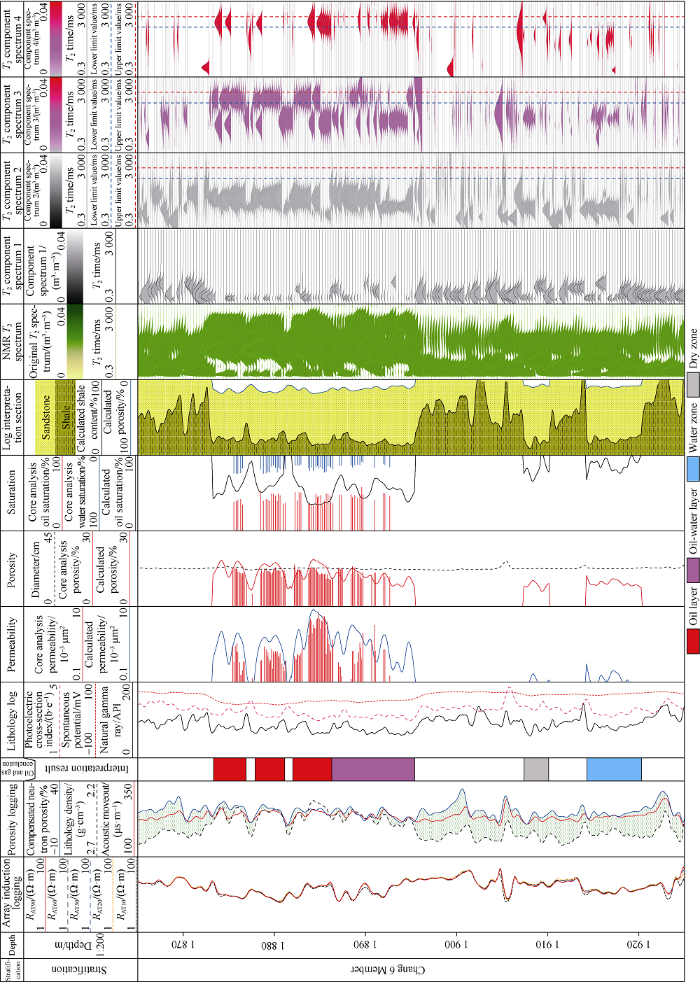
Fig. 8.
Log interpretation results of Chang 6 Member in Well Ll16.
The NMR data of this well was collected by the domestic multi-frequency NMR logging tool. The T2 spectrum inversion results are shown in track 11 of Fig. 8. On this basis, the T2 spectral decomposition method was used to obtain four T2 component spectra (see tracks 12-15 in Fig. 8), where T2 component spectra 1 and 2 are relatively continuous in the depth domain, because almost all strata have clay bound water and capillary bound water. But the component spectra 3 and 4 are partially missing with depth, especially component spectrum 4 is severely missing, reflecting that macropores are not developed. Spectral peak distribution lines of Chang 6 member reservoir crude oil with the lower limit of 165 ms and upper limit of 500 ms was added on T2 component spectra 2, 3 and 4. If the component spectral peaks are located in this interval (Fig. 8 between the blue line and the red line in tracks 14 and 15), the corresponding reservoir contains movable oil, the denser the peak, the higher the oil content is, otherwise the reservoir does not contain oil.
This can be used to verify the effectiveness of identifying fluid properties by T2 decomposition method. On the whole, the reservoir has hardly any T2 component spectrum 1 (depth 1 873-1 895 m). This is because of the low contents of clay and clay bound water. The component spectrum 2 is more developed, indicating that more micropores (i.e. capillary) are developed in the reservoir, and the component spectrum peak deviates greatly from 165 to 500 ms (see track 13 in Fig. 8), which is interpreted as capillary bound water. The top of the reservoir interpreted as oil layer (depth 1 873-1 886 m) has more component spectrum 3, and the main peaks are distributed in the oil peak interval, although the component spectrum 4 is less, almost all the spectrum peaks are distributed in 165-500 ms, indicating that the macropores and mesopores in this layer are filled with crude oil. The two calcareous interlayers within this depth range (at depth of 1 877.5 m and 1 881.5 m) have component spectra 3 and 4 both deviating from the oil peak range, showing they don’t contain oil, which is consistent with conventional log interpretation.
In the bottom of the oil-bearing section (depth 1 886-1 895 m), the top part has peak of component spectrum 3 mostly in the oil peak range, and the bottom part has peak of component spectrum 4 almost all in the range of oil peak. Hence, it is considered that the top part only has micropores and contains oil. The bottom part has both large and small pores, but oil only in the large pores and water in the small pores, and it is interpreted as an oil-water layer.
It can be seen from Fig. 8 that the non-oil layers differ obviously from oil layers in all component spectra. Non-oil layers have component spectra 1 and 2 in continuous distribution, and poor component spectra 3 and 4, and all peaks not within the range of oil peaks.
In Well L16, only the Chang 6 Member was tested, and the other layers haven’t been perforated. The well had an oil production of 2.04 t per day and a water cut of 72.3% initially, and after stabilizing in production, had a daily oil production of 1.42 t and a water cut of 69.4%. The data of formation testing and production are consistent with the results of NMR T2 component spectral analysis, proving T2 spectral decomposition method can identify fluid properties correctly.
3.2. Identification of water layer
Well Y80 encountered a sand body of 32 m in Chang 6 with depth of 1 683-1 715 m (Fig. 9). The coring data showed that it was oil-spot fine sandstone. The characteristics of the reservoir are as follows: the analysis porosity is 12.80%, analysis permeability is 0.65×10⁻³ μm2, acoustic moveout is 241.12 μs/m, density is 2.44 g/cm3, resistivity is 12.6 Ω•m. According to the conventional log data, 1691-1704 m section has higher oil content, so 1 691-1 693 m section was perforated and fractured at the injection rate of 1.4-1.8 m3/min. The fracturing fluid had 30.0 m3 of sand added and a sand ratio of 11.9%. The well was tested a daily water production of 30 m3, confirming that this layer is a water layer.
Fig. 9.

Fig. 9.
Log interpretation results of Chang 6 in Well Y80.
The NMR data of this well was also collected by the domestic multi-frequency NMR logging tool. The T2 spectrum (Fig. 9, track 11) was decomposed to obtain four T2 component spectra. The clay bound water in the reservoir (T2 component spectrum 1) is not developed, the same as the oil layer in Well L16, while they both have capillary bound water developed (T2 component spectrum 2) which is more continuous in the depth domain. In Well Y80, the T2 component spectra 3 and 4 representing oil information do not fall in 165-500 ms on T2 time axis (Fig. 9 between the blue and red lines in track 14 and 15), most of the peaks are on the lower limit of 165 ms. Moreover, the T2 component spectrum 4 is relatively sparse, indicating macropores are not developed. At 1 691-1 704 m, the T2 component spectrum 3 is slightly sparse in longitudinal distribution, which is interpreted as water layer according to the distribution characteristics of the T2 component spectra. At 1 705-1 714m, the T2 component spectrum 3 has good longitudinal continuity, with a few spectral peaks slightly larger than 165 ms. so it is comprehensively interpreted as an oily water layer. The analysis shows that when the T2 component spectrum is used to qualitatively identify oil and water, the interpretation conclusions are in good agreement with the oil test results.
4. Conclusions
According to the characteristics of nuclear magnetic resonance logging principle and T2 spectrum inversion process, it can be seen that T2 spectrum has a normal distribution characteristic on the transverse relaxation time axis (T2 time axis). Based on the theory of signal analysis, through two steps of peak-finding and optimization curve fitting, T2 spectrum can be decomposed at high precision. Based on the analysis of free relaxation characteristics of crude oil and formation water in reservoir and the T2 component spectrum characteristics at different oil saturations in the dynamic processes of oil displacing water and water displacing oil, a method to identify fluid property using T2 spectral decomposition method of NMR is proposed. The distribution position of the T2 component spectra on the T2 axis has clear petrophysical significance and can be taken as the basis for fluid identification. The following points need to be done when using this method. (1) The hidden peaks in the T2 spectra should be found accurately. (2) The fitting accuracy of each component spectrum should be high to ensure that the information of the original T2 is completely decomposed into each component spectrum. (3) For the identification of oil and water layers in different regions, the lower limit and upper limit of the oil component spectrum should be calibrated by rock physics experiments to determine the interpretation standard of the oil and water layers. The NMR T2 spectral decomposition method has been used to identify fluid properties, and the results have been verified by oil test and production test. This method can be used to identify the nature of fluids in reservoir qualitatively.
Nomenclature
Cw—salinity, mg/L;
K—permeability, 10-3μm2;
M(t)—the echo amplitude at time t, mV;
Mi(0)—the echo amplitude of the i-th relaxation component at time zero, mV;
n—number of echoes;
t—time, ms;
T2—transverse relaxation time, ms;
T2i—transverse relaxation time of the i-th relaxation component, ms;
a—the time corresponding to the peak center of the Gaussian component, ms;
σ—the peak width of the Gaussian component, ms;
τ—the interval time of the echo, ms;
ϕ—porosity, %.
Reference
Nuclear magnetic resonance features of low-permeability reservoirs with complex wettability
Some important issues for NMR logging applications in China
Evaluating producible hydrocarbons and reservoit quality in organic shale reservoirs using Nuclear Magnetic Resonance (NMR) factor analysis
Characterization of underlying pore and fluid structure using factor analysis on NMR data
Water spectrum method of NMR logging for identifying fluids
Improved peak detection in mass spectrum by incorporating continuous wavelet transform-based pattern matching
DOI:10.1093/bioinformatics/btl355
URL
PMID:16820428
[Cited within: 1]

MOTIVATION: A major problem for current peak detection algorithms is that noise in mass spectrometry (MS) spectra gives rise to a high rate of false positives. The false positive rate is especially problematic in detecting peaks with low amplitudes. Usually, various baseline correction algorithms and smoothing methods are applied before attempting peak detection. This approach is very sensitive to the amount of smoothing and aggressiveness of the baseline correction, which contribute to making peak detection results inconsistent between runs, instrumentation and analysis methods. RESULTS: Most peak detection algorithms simply identify peaks based on amplitude, ignoring the additional information present in the shape of the peaks in a spectrum. In our experience, 'true' peaks have characteristic shapes, and providing a shape-matching function that provides a 'goodness of fit' coefficient should provide a more robust peak identification method. Based on these observations, a continuous wavelet transform (CWT)-based peak detection algorithm has been devised that identifies peaks with different scales and amplitudes. By transforming the spectrum into wavelet space, the pattern-matching problem is simplified and in addition provides a powerful technique for identifying and separating the signal from the spike noise and colored noise. This transformation, with the additional information provided by the 2D CWT coefficients can greatly enhance the effective signal-to-noise ratio. Furthermore, with this technique no baseline removal or peak smoothing preprocessing steps are required before peak detection, and this improves the robustness of peak detection under a variety of conditions. The algorithm was evaluated with SELDI-TOF spectra with known polypeptide positions. Comparisons with two other popular algorithms were performed. The results show the CWT-based algorithm can identify both strong and weak peaks while keeping false positive rate low. AVAILABILITY: The algorithm is implemented in R and will be included as an open source module in the Bioconductor project.
Applications of NMR to oil well logging and formation evaluation
Analysis of core NMR data from laboratory measurements
Experimental results and study on nuclear magnetic resonance and viscosity of viscous oil samples
