Petroleum Exploration and Development Editorial Board, 2020, 47(4): 855-866 doi: 10.1016/S1876-3804(20)60101-X
A method and device for online magnetic resonance multiphase flow detection
DENG Feng,1,*, XIONG Chunming1, CHEN Shiwen1, CHEN Guanhong1, WANG Mengying1, LIU Huabing2, ZHANG Jianjun1, LEI Qun1, CAO Gang1, XU Dongping4, TAO Ye1, XIAO Lizhi3
1. PetroChina Research Institute of Petroleum Exploration & Development, Beijing 100083, China
2. Beijing Limecho Technology Co., Ltd, Beijing 100089, China
3. China University of Petroleum, Beijing 102249, China
4. Institute of Computing Technology, China Academy of Railway Sciences Corporation Limited, Beijing 100081, China
Supported by the National Natural Science Foundation of China. 51704327
Abstract
Most multiphase flow separation detection methods used commonly in oilfields are low in efficiency and accuracy, and have data delay. An online multiphase flow detection method is proposed based on magnetic resonance technology, and its supporting device has been made and tested in lab and field. The detection technology works in two parts: measure phase holdup in static state and measure flow rate in flowing state. Oil-water ratio is first measured and then gas holdup. The device is composed of a segmented magnet structure and a dual antenna structure for measuring flowing fluid. A highly compact magnetic resonance spectrometer system and intelligent software are developed. Lab experiments and field application show that the online detection system has the following merits: it can measure flow rate and phase holdup only based on magnetic resonance technology; it can detect in-place transient fluid production at high frequency and thus monitor transient fluid production in real time; it can detect oil, gas and water in a full range at high precision, the detection isn’t affected by salinity and emulsification. It is a green, safe and energy-saving system.
DENG Feng, XIONG Chunming, CHEN Shiwen, CHEN Guanhong, WANG Mengying, LIU Huabing, ZHANG Jianjun, LEI Qun, CAO Gang, XU Dongping, TAO Ye, XIAO Lizhi. A method and device for online magnetic resonance multiphase flow detection. [J], 2020, 47(4): 855-866 doi:10.1016/S1876-3804(20)60101-X
Introduction
At present, online and quantitative detection of multi-phase flow in oil and gas wells and pipelines is a problem that has drawn wide attention in the oil industry[1]. There is no reliable technology that can accurately measure the flow of each phase in the multi-phase flow without separating oil, gas and water. Traditional three-phase separating measurement methods (glass tube, tipping bucket, etc.) are less effective, with high cost, large footprint, and data delay, and cannot reflect the real transient fluid production at wellhead. In recent years, online multi-phase flow measurement technology and instruments have been widely concerned and gradually developed[2,3,4,5,6,7,8,9,10,11,12,13,14,15]. With this technology, produced fluid can be measured online at wellhead before stabilization, separation and full process treatment, etc. so that the influence of human factors is minimized and the results can truly reflect the transient performance of fluid at wellhead. It is of great significance for fine reservoir management, production distribution optimization and wellhead testing. However, the existing multi-phase flow detection technology still has some practical problems, including difficult instrument calibration, radioactivity, limited application range, complicated models for data interpretation and processing, and high maintenance cost. In addition, with the increase of development scale of unconventional oil and gas resources and unconventional oil and gas wells, multi- phase flow measurement have to face produced fluids with high gas content, high water cut, high viscosity, and high salinity. These factors will directly cause the measurement error of the existing flowmeters to increase exponentially, and even make it impossible to measure the multi-phase fluid. It is necessary to develop multi-phase flow detection device and methods that are accurate, reliable, to meet the requirement of real-time detection of oil and gas production.
Magnetic resonance (MR) technology is a green, efficient and accurate method for oil and gas detection. After years of research and practice, it has been widely used in well logging evaluation[16] and indoor petrophysical research. MR can qualitatively/quantitatively evaluate reservoir fluids by acquiring information on molecular scale[17]. Its unique measurement principle and method make it possible to simultaneously measure the flow rate and phase holdup of multiphase flow in theory, so it is highly possible to realize online multiphase flow detection with this technology. But it is difficult for existing laboratory MR technology and instruments to be directly applied to the quantitative detection of multiphase flow in oil and gas wells and pipelines strongly affected by fluid motion and harsh working environment[18,19,20,21]. It is necessary to develop new methods to meet the requirements of field application.
This paper proposes an online MR detection method for multiphase flow, and provides supporting hardware device, and describes indoor experiments and field applications.
1. Theory and method
1.1. Multiphase flowmeter
A multiphase flowmeter measures the flows of oil, gas and water without separating them. The essence of multiphase flow measurement is to measure the instantaneous flow rate (gas phase vg, water phase vw and oil phase vo), volume fraction (gas phase α, water phase β and oil phase γ) and density (gas phase ρg, water phase ρw and oil phase ρo) of each phase.
Now the unknowns increase to 8, making the measurement difficult.
In fact, the density of oil, gas and water can be measured in other production processes, so to measure mass flow is to measure the flow rate and holdup of each phase as well (generally oil and gas), like measuring volume flow. Currently, there are no commercial multiphase flowmeters for mass flow measurement. Existing commercial multi-phase flowmeters all detect volume flow. The MR flow detection technology presented in this paper is also for volume flow detection.
"Flow rate + phase holdup" is the measurement way of commercial multiphase flowmeters commonly used in the world. The difference is that the MR technology can simultaneously measure flow rate and phase holdup, while other multi-phase flowmeters need to use different technologies to complete the measurements of the two "in series". For example, Venturi, Coriolis force and cross-correlation are usually used to measure flow rate, and gamma energy spectrum and resistivity to measure phase holdup. The advantages of using a single technology to complete multi-phase flow measurement include the device only needs one probe and is easy to maintain, and the data obtained is in good connection.
1.2. Multiphase flow rate measurement by magnetic resonance
The MR technology for online continuous measurement of flowing fluid requires that the MR probe completes the measurement while maintaining continuous relative motion with the measured fluid. Different from traditional static measurement, flowing state has obvious influence on MR measurement (Fig. 1), so the application of MR technology in the online detection of multiphase flow in oil and gas wells needs to solve three new scientific problems: (1) How flow rate affects the magnetization efficiency of multiphase flow. (2) How flow rate affects the acquisition of MR echo signals. (3) How to measure and interpret multiphase fluid flow by magnetic resonance.
Fig. 1.
Schematics of MR measurement in flowing state.
The effect of flow rate on MR measurement can be reflected by the variation of the nuclear magnetization vector. Bloch equation[22] provides how the longitudinal component Mz, and transverse components Mx and My of the nuclear magnetization vector change with time in the direction of the static magnetic field in the rotating coordinate system:
Taking the measurement of Carr-Purcell-Meiboom-Gill (CPMG) pulse sequence as an example, assuming that the fluid is a mixture composed of i components, the signal amplitude during the magnetization process and echo acquisition process can be derived from the Bloch equation as:
MR measurement includes two processes, sample magnetization and echo acquisition. During the sample magnetization process, the fluid enters the probe and flows through the magnet for pre-magnetization. If the fluid rate is fast, and the magnet length is limited, the fluid often flows into the antenna detection area without sufficient magnetization (Tw<4T1), which will cause "under magnetization". In this case, the expression of X is:
$X\left( r \right)=\frac{{{L}_{\text{m}}}}{v\left( r \right){{T}_{\text{w}}}{{T}_{1,i}}}-\frac{1}{{{T}_{1,i}}}$
For example, the Newtonian fluid tube laminar flow, when fluid flows under the drive of pump pressure, according to fluid mechanics, the flow rate is:
$v\left( r \right)=\frac{\Delta p}{4\mu A}\left( {{R}^{2}}-{{r}^{2}} \right)$
It should be noted that the flow rate distribution functions in different flow regimes are different[23,24,25,26], and they will not be listed one by one here. Fluid flow will cause the first amplitude value of the echo string to be lower than that of the static measurement, and the faster the flow rate is, the greater the first amplitude value decreases. In practical applications, the reduction of the amplitude of the echo string means a decrease in the signal-to-noise ratio[27,28,29,30,31]. In order to get a higher signal-to-noise ratio and improve the measurement accuracy, it is expected a longer pre-magnetization of the multiphase flow, which is also one of the decisive parameters affecting the upper limit of flow measurement.
"Over-magnetization" also occurs during flow measurement. In some application scenarios that require frequent measurement (the flow regimes, flow rate or component change frequently), the separation between two measurements of echo string is very short, and the set Tw is short (Tw<4T1). In this case, what is collected by the antenna is actually the sum of the sample that has entered the antenna after magnetized and the sample that is being magnetized in the antenna:
$X\left( r \right)=\left\{ \begin{align} & \frac{-1}{{{T}_{\text{w}}}}\ln \left[ 1-\frac{v\left( r \right){{T}_{\text{w}}}}{A} \right]\approx \frac{v(r)}{A}\ \ \text{ }v\left( r \right){{T}_{\text{w}}}\ <\ A \\ & +\infty \quad \quad \quad \quad \quad \quad \quad \quad \quad \quad v\left( r \right){{T}_{\text{w}}}\ge A \\ \end{align} \right.$
In the process of echo acquisition, when the Nth echo is collected by the antenna, a part of the magnetized vector turned by the 90° pulse has left the antenna, and the sample that just enters the antenna has not been turned by the 90 ° pulse, so its echo signal cannot be collected. The expression of Y is derived as:
$Y\left( r \right)=-\frac{1}{t}\ln \left[ 1-\frac{v\left( r \right)t}{A} \right]\approx \frac{v(r)}{A}$
From equation (13), it is found that fluid flow causes additional attenuation of the signal of the echo string, and the attenuation amplitude is almost proportional to the flow rate, so the flow rate can be measured through the attenuation amplitude. Fig. 2 shows a schematic diagram of the additional attenuation of the signal caused by fluid flow. In static state, the attenuation of the echo string is e-exponential (relaxation attenuation) following the Bloch equation, while in flowing state, fluid flow will cause additional attenuation.
Fig. 2.
Influence of fluid flow on the process of MR echo acquisition.
Since the echo string measured in flowing state is the weighted sum of relaxation attenuation and flow-induced attenuation, in order to obtain the flow rate, it is necessary to remove normal relaxation attenuation in the echo string signal, and only keep the attenuation caused by fluid flow. The steps are as follows: (1) In the static state of fluid, collect a set of echo string Mstatic, and obtain a Mstatic-SVD curve after SVD (removing singulars)[32] and normalization (Fig. 3). (2) In the flowing state of fluid, collect a set of echo string Mflow by using the same parameters in the static state (interval TE and the number of echoes N), and obtain a Mflow-SVD curve after SVD and normalization (Fig. 3). (3) Divide Mflow-SVD by 1-Mstatic-SVD to eliminate the relaxation attenuation, and obtain a Mflow-SVD-SC curve (Fig. 3), which is the fitted echo string curve attenuated by fluid flow. After linearly fitting the Mflow-SVD-SC curve, we get a straight line Mflow-SVD-SC=1-v/A. Calculating it, we can get the average flow velocity v.
Fig. 3.
Curves from all steps of the flow rate measurement method.
It should be pointed out that experiments show that the echo string of conventional multiphase flow of oil, gas and water has a good linearity in the first 50 ms and can be used to calculate the flow rate. But this time should be shorter for the produced fluid with high viscosity. The reason why the echo string data is processed by SVD before corrected instead of directly using them is because the noise in the echo string data can be suppressed after SVD, so the noise in the echo string data won’t be amplified when reconstructing the data. In addition, the smaller the flow rate, the more significant the influence of the free attenuation of the fluid magnetization vector on the measurement of the flow rate will be, so correction is needed. When using the method, it is necessary to collect echo string signals in static state. How to use the method will be described in details later.
1.3. Phase holdup detection by magnetic resonance
The MR technology for quantitative analysis of fluid components based on relaxation time (T2 or T1) is called 1D MR technology, which uses CPMG pulse sequence and "reverse recovery" pulse sequence to measure phase holdup. The CPMG pulse sequence for acquiring T2 takes less time than the “reverse recovery” pulse sequence for acquiring T1, so the former is more advantageous in the time-dependent industrial online measurement environment such as flow measurement. However, it usually needs 0.5 to 5.0 min to get a T2, obviously, it is not suitable for measuring under flow state. Other means are needed to make the multiphase flow in the pipeline temporarily stationary when measuring phase holdup.
Generally in the multiphase flow, the T2 of the oil phase is the shortest, followed by the water phase, and the T2 of the gas phase is the longest. In theory, the three can be distinguished from their T2 spectra, but in fact, the signal of the gas phase is very weak and is hard to directly get due to the influence of pipeline pressure. Hence, a method that measures the oil-water ratio first and then the gas holdup has been proposed through study.
The oil-water ratio can be directly calculated using the areas of the oil peak and water peak on the T2 spectrum shown in Fig. 4:
Since the hydrogen index of water is 1, it is not reflected in equation (14), and the hydrogen index of oil Ho needs to be measured by indoor scale experiment. That is to collect the same volume of pure oil and pure water samples and place them in the MR probe to collect free induction delay (FID). The ratio of amplitudes of the two signals is Ho.
As the gas is low in hydrogen index, its MR signal is weak and is easy to be overwhelmed by noises. Especially when the pressure in the pipeline is low (less than 1 MPa), it is hard to get the signal of the gas phase. Therefore, a derivation method which can calculate the gas holdup without direct measurement is proposed.
First, for the multiphase flow in wells and pipelines, the following relationship is always satisfied:
${{A}_{\text{l}}}+{{A}_{\text{g}}}=1$
Assuming that the multiphase flow does not contain gas phase, the first amplitude value of the echo string acquired is:
In equation (17), Mpg is the amplitude of the signal acquired when the fluid in the pipeline is of entirely gas phase. This parameter is related to the pressure in the pipeline, and it is difficult to measure accurately. To deal with this problem, the signal of the gas phase should be filtered out, that is to add an interval which is 3 to 5 times the echo interval before the CPMG pulse sequence. In this way, the signal of the gas phase will rapidly decay, and the first amplitude of the echo string acquired will not include the contribution from the gas phase, and the T2 spectra from inversion won’t have a gas phase peak, namely:
${{M}_{\text{pg}}}=0$
Combine equations (14) to (18), the gas holdup Ag can be calculated.
It is worth noting that in the actual measurement, sometimes the gas phase in the multi-phase flow not only contains hydrocarbon gases, but also carbon dioxide, hydrogen sulfide, and air (in the case of not full-pipe flow) etc. It is impossible to distinguish all kinds of gases by the above method. To accurately measure the content of hydrocarbon gas, you can directly measure the T2 spectrum of the gas phase by pressurizing the pipeline (greater than 1 MPa).
It should be pointed out that the MR relaxation time used for measuring phase holdup can also directly detect fluid properties (such as viscosity, length of molecular chain, gravity, and hydrogen index, etc.) without additional measurement procedures.
2. Device development
The online MR multiphase flow detection system (MRMF) (Fig. 5) includes a MR probe, a spectrometer, valves and manifold. The MR probe is composed of aluminum alloy shell, magnet and its skeleton, antennas, fluid tube, temperature control system, thermal insulation and explosion-proof shell, which provides the necessary static magnetic field and RF field environment for MR measurement. The spectrometer includes electronic circuit and host computer software. The electronic circuit controls the transmission of antenna RF pulses and the reception and processing of echo signals. It also controls the temperature of the magnet and the valves. The host computer software is used for human-computer interaction. Its main functions include logic control of parameter input, data processing and interpretation, and data and curve display, etc. The valves and manifolds control the switch between "static and flow states ".
Since the application environment of the MRMF is oil and gas fields, compared with the conventional MR instruments used in laboratory, additional protection, explosion prevention and environmental adaptability need to be considered. Table 1 lists the main design parameters and indicators of the MRMF.
Table 1
Table 1Main design parameters and indicators of MRMF.
The continuous changes of the flow rate and flow regime of each phase of the multi-phase flow set very high requirements on the accuracy, reliability and timeliness of the MRMF. Specially designed, the MRMF probe is more complicated than a traditional NMR instrument for static measurement. The core components of the MR probe are the magnet and antenna, which are used to generate a static magnetic field and a radio frequency field, respectively.The MR probe uses permanent magnetic material to provide the required static magnetic field. The magnet cross-section is a Halbach structure[33,34], which can produce a uniform magnetic field inside the probe, and at the same time, the structure with the merit of "zero leakage" can improve the safety of the MRMF in field application. The magnet is a multi-stage structure in the axial direction and is divided into two parts: a pre-magnetized area and a detection area (Fig. 6). The magnetic field strength of the pre-magnetization area is designed to be slightly higher than that of the detection area to achieve rapid magnetization of the multiphase flow. The magnetic field distribution of the probe is shown in Fig. 6.
Fig. 6.
Magnet structure and distribution of axial magnetic field.
The antennas are like solenoids placed in the detection area. They can produce a radio frequency field and excite energy level transitions of protons in the sample. Then they receive MR signals and observe MR phenomenon. There are two antennas in the MRMF (Fig. 7). The primary antenna is placed in a uniform static magnetic field for collecting relaxation information, and the secondary antenna is placed in a uniform gradient static magnetic field for collecting diffusion information.
As an important part of the MRMF, the spectrometer generates pulse sequence and probe control commands, controls the antennas to transmit and amplify RF pulses and collect echo signals. The spectrometer has two parts: electronic circuit and host computer software (Fig. 8).
To meet field application, the MRMF spectrometer has more complicated functions than a traditional MR spectrometer. (1) It controls the valve set to switch between static state and flow state. (2) It controls the magnet temperature. (3) It enables intelligent data collection, processing and interpretation in full automation and unattended operation. (4) The Web-based host computer software ensures wireless control and data transmission via mobile phones and tablet computers, etc. when needed. (5) The spectrometer is compact and only 200 mm by 170 mm by 200 mm.
2.3. The valves and manifold
That the MRMF measures "phase holdup in the static state and flow rate in the flow state" relies on the controllable valve set and manifolds (Fig. 9). The MRMF device has two "T" valves, which are controlled by the spectrometer. In actual installation, the first ends of the two "T" valves are connected via the bypass pipeline, the second are connected to the fluid tube in the MR probe, and the third are used as the inlet/outlet of multi-phase flow, and connected to a wellhead Christmas tree, pipeline, metering room or the manifold of a technical station to introduce multiphase flow into the MRMF. In measuring flow rate under flow state, all the multiphase fluid flows through the fluid tube in the MR probe. In the static state to measure phase holdup, all the multi-phase fluid flows through the branch pipeline, and the fluid in the probe is static. It should be noted that the valves and manifolds are installed horizontally, and multiphase flow is measured in the state of horizontal pipe flow regime.
Fig. 9.
Schematic diagram of the valve set and manifold.
3. Laboratory calibration experiments
Laboratory calibration experiments can ensure that the MRMF works in an optimal state and the flow interpretation results are accurate and reliable. The calibration experiment was completed in the Multiphase Flow Laboratory of RIPED. The lab has a multiphase flow system (Fig. 10), which is composed of several units, including storage, external transmission, metering, mixing, separation, and re-injection. The controllable pump pumps single-phase fluid (white oil, pure water, air) to each phase of the single-phase flowmeter. Then they are mixed and measured in the MRMF. The measurement results of 3 single-phase flowmeters are used to calibrate and verify the results of the MRMF. The laboratory calibration experiment includes two parts: calibration of flow rate and calibration of phase holdup.
Switched the MRMF valve to the mode of flow state measurement, and then pumped multi-phase fluids at different flow rates and different proportions into the MRMF through the center console to fit the flow rate and determine the fitting parameters. The experiment was done at the magnet temperature of 25 °C, pipe pressure of 0.1 MPa, echo interval of 200 µs, echo number of 250, total liquid volume of 1-200 m3 (100 uniformly distributed points covering the measurable flow range of the MRMF).Fig. 11 shows the data of echo string and fitted flow rates after pumping multi-phase flows at different flow rates and the same oil-water-gas ratio (oil to water to gas = 1 to 1 to 0.2). Fig. 11b shows the measured flow rates and the pumped flow rates, which are very consistent, with a correlation coefficient of 0.974. It should be noted that in order to improve the accuracy of flow interpretation, the data of the first few echoes with better linearity in the echo string need to be intercepted for interpretation. The cutoff of the echo string was the first 50 ms when the flow rate was less than 50 m3/d, the first 20 ms when 50-100 m3/d, and the first 10 ms when higher than 100 m3/d in the experiment.
Fig. 11.
Experimental results of flow calibration.
3.2. Calibration experiment of phase holdup
Oil and water mixtures with different oil-water ratios were pumped into the MRMF. Once the oil-water ratio was changed, the MRMF valve was switched from the flow mode to the static mode, and then T2 was measured. The experiments were conducted at the magnet temperature of 25 °C, pipe pressure of 0.1 MPa, echo interval of 200 µs, echo number of 40 000, and the oil-water ratio of 0 to 1. Fig. 12a shows the T2 spectra. According to the ratio of the first amplitude of the echo string collected when the oil-water ratio is 0 and 1, respectively, the hydrogen index of the white oil is 0.98. Taking T2 = 0.5 s as the oil-water contact, that is the oil peak on the left and the water peak on the right, the areas of the spectral peaks on the left and right sides were calculated. By using equation (14), the oil-water ratio was calculated (Table 2). The average relative error is 2.20%.
Gas, and water mixtures at different gas holdups were pumped into the MRMF. Once the gas holdup was changed, the MRMF valve was switched from the flow state to the static state, and then the echo string was measured. The experiments were conducted at the magnet temperature of 25 °C, pipe pressure of 0.1 MPa, echo interval of 200 µs, echo number of 10 000, and gas holdup range of 0-90%. Fig. 12b shows the echo strings in the experiments. The gas holdup was calculated according to the first amplitude of the echo string. Table 3 lists the results, which have an average relative error of 3.10%.
Three-phase fluids with different oil-gas-water ratios were pumped into the MRMF. First, the gas holdup was estimated by collecting the first amplitude of the echo string, and then the oil-water ratio was estimated by T2 spectrum, and finally the respective holdups of the three phases were worked out. The experiments were done at the magnet temperature of 25 °C, pipe pressure of 0.1 MPa, echo interval of 200 µs, and echo number of 40 000. The experimental results are shown in Table 4. The average relative errors of the oil holdup, gas holdup and water holdup are 2.57%, 6.41%, and 2.86% respectively.
Table 4
Table 4The designed and measured phase holdups of three-phase fluids.
The multiphase fluids in oil and gas wells and pipelines are often emulsified. In this case, most multiphase flowmeters, especially volumetric flowmeters, cannot accurately analyze the phase holdup, but the advantages of MR technology now stands out. The MR multiphase flowmeter directly collects molecular information, and its measurement principle determines that it is theoretically not affected by emulsification. In order to confirm this conclusion, we conducted an experiment. Fig. 13 shows the T2 spectrum of emulsified crude oil from an oilfield measured by MRMF. According to the spectrum, the water cut of the crude oil is 71.2%, which is consistent with the result of dehydration analysis in the laboratory, proving that MRMF has unique merit in measuring emulsified multiphase flow.
The multiphase fluids produced from different oil fields and oil wells are different in salinity. It is necessary to analyze the effect of salinity on MR measurement. Fig. 14 shows the T2 of KCl, NaCl and CaCl2 at different concentrations. It can be seen that for the minerals contained in these three types of common formation water, even if the concentration of the minerals reaches 17%, the maximum difference in the T2 value of the waters is less than 700 ms, and the T2 of water is no less than 2s. Therefore, the water peak doesn’t overlap with the oil peak, and does not affect the measurement of the phase holdup. The field produced fluid may contain several minerals, but from the perspective of principle, as long as the fluid does not contain paramagnetic substances, the mixing of several kinds of minerals that have no obvious effect on MR measurement would also have little effect on the MR measurement.
Fig. 14.
The T2 of formation water samples containing different concentrations of minerals.
In fact, the measurement principle of MR determines that its measurement result isn’t affected not only by emulsification and salinity, but also by conductivity, temperature, viscosity, density and transparency that affect other flowmeters.
3.4. Results and discussion
Indoor experiments show that the accuracy of the calibrated MRMF result is better than the designed. For flow rate, by selecting an appropriate cut-off, the online measurement of flow rate can be obtained with high-frequency (0.5 times/s) and high-precision (the correlation coefficient is 0.974). For phase holdup, three-phase full-range detection, including oil, gas and water, can be achieved. For the detection accuracy of two-phase fluid, the relative error of the oil-water ratio is 2.2%, the relative error of the gas-water ratio is 3.1%. For the detection accuracy of three-phase fluid, the relative error of oil phase is 2.57%, the relative error of gas phase is 6.41%, and the relative error of water phase is 2.86%.
4. Field application
The MRMF system has been tested in the # 20 metering station in Dalaoyefu block, Jilin Oilfield (Fig. 15). The inlet and outlet flanges of the MRMF system are connected to the oil and gas pipelines in the metering station through hoses, and the well to be measured is selected by switching the valves in the metering station. All the 24 wells controlled by this metering station are old wells that have been producing by waterflooding for many years. Historical production data shows that the wells had an average water cut of 96% and gas produced intermittently. Starting from September 2, 2019, the 24 wells had been measured by the MRMF system for 3 months continuously. The equipment had been running stable without any abnormality. The MRMF parameters were set as follows: (1) For measuring the phase holdup in the static state, the echo interval was 200 µs, the number of echoes was 40 000, data were collected for 4 times, the frequency was 2 times/h. (2) For measuring the flow rate in the flowing state, the echo interval was 200 µs, the number of echoes was 250, data were collected for 4 times, the frequency was 0.15 times/h.
Fig. 15.
Application of MRMF in Dalaoyefu block, Jilin Oilfield.
To make comparison, both a tipping bucket flowmeter and a vehicle-mounted flowmeter were used. Their measurement results were compared with those from the MRMF, which show high consistency. Fig. 16 shows the measured flow rates of 6 well groups in 4 h each. The comparison shows: (1) The liquid production from the MRMF and that from the tipping flowmeter are in high consistency of 95.6% on average. (2) The MRMF measurement can show any abnormality of the flow rate. For example, the abnormal flow rate in well anulus 10-26, 8-28, 6-028 at 0.4h actually caused abnormally high pressure (readings on the pressure gauge), but the tipping bucket flowmeter only showed a little fluctuation. (3) The tipping bucket flowmeter can only measure the cumulative liquid production, while the MRMF can not only measure the cumulative liquid production, but also gas and water cut. (4) Although the flow regime in the well producing gas is complex, the MRMF can capture any fluctuation in the flow rate in time.
Fig. 16.
Curves of 6 wells measured in # 20 metering station in Dalaoyefu block, Jilin Oilfield.
5. Conclusions
The MRMF system (online multiphase flow detection based on magnetic resonance technology) "measures phase holdup at the static state and flow rate at the flowing state" simultaneously. It detects the flow rate of multiphase flow by using the attenuation rate of echo strings, and echo strings in the scenario with low flow rate can be corrected to enhance measurement precision. Without separating phases, it first estimates the oil-water ratio and then the gas holdup to realize the measurement of oil, gas and water holdups. The hardware device has been developed. It adopts a segmented magnet structure and a dual antenna structure, a highly compact MR spectrometer, and supporting intelligent software.
Lab calibration experiments show that the MRMF is superior to the popular multiphase flowmeters in measurement accuracy. The method and device have been proved feasible and reliable. The test of the technology in the Dalaoyefu block, Jilin Oilfield show the fluid production measured by the MRMF and that from a tipping bucket flowmeter have a consistency of 95.6%. Compared with other multiphase flow detection technologies, the MRMF have the obvious advantages: (1) It measures both flow rate and phase holdup simultaneously with only one technology. (2) It provides online in-situ detection, at high frequency and in real time, so it can monitor transient variations in well production, which are important and rich data for dynamic reservoir analysis. (3) It can measure oil, gas and water phases in a full range with high precision, not affected by salinity and emulsification. (4) It is green, safe and energy-saving.
Nomenclature
A — length of MR probe antenna, m;
Al — liquid holdup, %;
Ag — gas holdup, %;
Hi —hydrogen index of the ith component;
Ho —hydrogen index of oil;
Lm —length of the magnet, m;
M — mass flow, kg/s;
M0—magnetization in equilibrium state;
Mflow-SVD — echo string collected in the flowing state after SVD and normalization;
Mflow-SVD-SC — the quotient of Mflow-SVD and 1-Mstatic-SVD;
Mi —magnetization of the ith component in the fluid sample at the end of the magnetization process;
Mpg —amplitude of the signal collected when the fluid in the pipeline is entirely gas;
Mpl — the amplitude of the signal collected when the fluid in the pipeline is entirely liquid;
Mm — the initial amplitude of the echo string measured;
Mstatic — the echo string collected in static state;
Mstatic-SVD — echo string collected in static state after SVD and normalization;
Mw — amplitude of the signal collected when the fluid in the pipeline is entirely water;
Mx and My — transverse components of the nuclear magnetization vector in the rotating coordinate system in the direction of the static magnetic field;
Mz — longitudinal component of the nuclear magnetization vector in the rotating coordinate system in the direction of the static magnetic field;
N — number of echoes;
n — number of fluid components;
Q — volume flow rate, m3/s;
r — distance from a point on the cross section of the pipeline to the center point, m;
R — inner diameter of the pipeline, m;
Row — oil-water ratio;
si — amplitude of the echo signal collected;
S — cross-section area of the pipeline, m2;
Si — saturation of the ith component, %;
So — area of the oil peak on the T2 spectrum, m2;
Sw — area of the water peak on the T2 spectrum, m2;
t — time for acquiring echo, s;
T1 — longitudinal relaxation time, s;
T2 — transverse relaxation time, s;
T1,i — longitudinal relaxation time of ith component, s;
T2,i — transverse relaxation time of ith component, s;
TE — echo interval, s;
Tw — magnetization time, s;
V — average flow rate, m/s;
v(r) — flow rate on the cross section of the pipeline r from the center point, m/s;
vg, vw, vo vg — flow rate of gas, water, oil phases, respectively, m/s;
X, Y — influencing factors of fluid flow on magnetization process and echo acquisition process, s-1;
α, β, γ — volume fraction of gas, water, and oil phases, %;
Δp — pressure difference at two ends of the pipeline, Pa;
μ — fluid viscosity, Pa·s;
ρg, ρw, ρo — density of gas, water and oil, respectively, kg/m3.
A numerical model for transit-time ultrasonic flowmeters operating under multiphase flow conditions previously presented by us is extended by mesh refinement and grid point redistribution. The method solves modified first-order stress-velocity equations of elastodynamics with additional terms to account for the effect of the background flow. Spatial derivatives are calculated by a Fourier collocation scheme allowing the use of the fast Fourier transform, while the time integration is realized by the explicit third-order Runge-Kutta finite-difference scheme. The method is compared against analytical solutions and experimental measurements to verify the benefit of using mapped grids. Additionally, a study of clamp-on and in-line ultrasonic flowmeters operating under multiphase flow conditions is carried out.
KARTUSHINSKYA, BALAKIN BV, KUTSENKO KV, et al.
Numerical study of gas-liquid flow morphology in a vertical flowmeter nozzle.
Thessaloniki, Greece: International Conference of Numerical Analysis and Applied Mathematics (ICNAAM 2017), 2017.
An algorithm for the construction of the magnetic system of a flowmeter of multiphase fluid media that assures its minimal weight and minimal overall dimensions is presented. The system guarantees high values of the magnetic induction in the working range of the flowmeter (0.5-1.0 T and greater) with high degree of homogeneity (less than (20-30)center dot 10(-6)) in required volumes.
COATES GR, XIAO LZ, PRAMMER MG. NMR Logging: Principles and applications. Texas: Gulf Professional Publishing, 2000.
Nuclear magnetic resonance (NMR) under motion has drawn significant attention in recent years. Motion of the NMR probe has serious effects on NMR measurement. For example, NMR logging normally runs at downhole condition with tool motion at a speed of 30 ft/min. We propose here methods for motion corrections of NMR data based on the quantitative analysis of motion effects on polarization and echo acquisition. We also produced a multi-functional NMR scanning system to verify the theoretical analysis. Presented experiments demonstrate that the theoretical and experimental results match very well.
WUBaosong, XIAOLizhi, LIXin, et al.
Sensor design and implementation for a downhole NMR fluid analysis laboratory
CASSONN. A flow equation for pigment oil-suspensions of the printing ink type: MILL C C. Rheology of disperse systems. London: Pergamon Press, 1959: 84.
... At present, online and quantitative detection of multi-phase flow in oil and gas wells and pipelines is a problem that has drawn wide attention in the oil industry[1]. There is no reliable technology that can accurately measure the flow of each phase in the multi-phase flow without separating oil, gas and water. Traditional three-phase separating measurement methods (glass tube, tipping bucket, etc.) are less effective, with high cost, large footprint, and data delay, and cannot reflect the real transient fluid production at wellhead. In recent years, online multi-phase flow measurement technology and instruments have been widely concerned and gradually developed[2,3,4,5,6,7,8,9,10,11,12,13,14,15]. With this technology, produced fluid can be measured online at wellhead before stabilization, separation and full process treatment, etc. so that the influence of human factors is minimized and the results can truly reflect the transient performance of fluid at wellhead. It is of great significance for fine reservoir management, production distribution optimization and wellhead testing. However, the existing multi-phase flow detection technology still has some practical problems, including difficult instrument calibration, radioactivity, limited application range, complicated models for data interpretation and processing, and high maintenance cost. In addition, with the increase of development scale of unconventional oil and gas resources and unconventional oil and gas wells, multi- phase flow measurement have to face produced fluids with high gas content, high water cut, high viscosity, and high salinity. These factors will directly cause the measurement error of the existing flowmeters to increase exponentially, and even make it impossible to measure the multi-phase fluid. It is necessary to develop multi-phase flow detection device and methods that are accurate, reliable, to meet the requirement of real-time detection of oil and gas production. ...
On-line automatic measurement methods of multiphase flow of the well in no separation
1
2014
... At present, online and quantitative detection of multi-phase flow in oil and gas wells and pipelines is a problem that has drawn wide attention in the oil industry[1]. There is no reliable technology that can accurately measure the flow of each phase in the multi-phase flow without separating oil, gas and water. Traditional three-phase separating measurement methods (glass tube, tipping bucket, etc.) are less effective, with high cost, large footprint, and data delay, and cannot reflect the real transient fluid production at wellhead. In recent years, online multi-phase flow measurement technology and instruments have been widely concerned and gradually developed[2,3,4,5,6,7,8,9,10,11,12,13,14,15]. With this technology, produced fluid can be measured online at wellhead before stabilization, separation and full process treatment, etc. so that the influence of human factors is minimized and the results can truly reflect the transient performance of fluid at wellhead. It is of great significance for fine reservoir management, production distribution optimization and wellhead testing. However, the existing multi-phase flow detection technology still has some practical problems, including difficult instrument calibration, radioactivity, limited application range, complicated models for data interpretation and processing, and high maintenance cost. In addition, with the increase of development scale of unconventional oil and gas resources and unconventional oil and gas wells, multi- phase flow measurement have to face produced fluids with high gas content, high water cut, high viscosity, and high salinity. These factors will directly cause the measurement error of the existing flowmeters to increase exponentially, and even make it impossible to measure the multi-phase fluid. It is necessary to develop multi-phase flow detection device and methods that are accurate, reliable, to meet the requirement of real-time detection of oil and gas production. ...
A proposed NMR solution for multi-phase flow fluid detection
1
2019
... At present, online and quantitative detection of multi-phase flow in oil and gas wells and pipelines is a problem that has drawn wide attention in the oil industry[1]. There is no reliable technology that can accurately measure the flow of each phase in the multi-phase flow without separating oil, gas and water. Traditional three-phase separating measurement methods (glass tube, tipping bucket, etc.) are less effective, with high cost, large footprint, and data delay, and cannot reflect the real transient fluid production at wellhead. In recent years, online multi-phase flow measurement technology and instruments have been widely concerned and gradually developed[2,3,4,5,6,7,8,9,10,11,12,13,14,15]. With this technology, produced fluid can be measured online at wellhead before stabilization, separation and full process treatment, etc. so that the influence of human factors is minimized and the results can truly reflect the transient performance of fluid at wellhead. It is of great significance for fine reservoir management, production distribution optimization and wellhead testing. However, the existing multi-phase flow detection technology still has some practical problems, including difficult instrument calibration, radioactivity, limited application range, complicated models for data interpretation and processing, and high maintenance cost. In addition, with the increase of development scale of unconventional oil and gas resources and unconventional oil and gas wells, multi- phase flow measurement have to face produced fluids with high gas content, high water cut, high viscosity, and high salinity. These factors will directly cause the measurement error of the existing flowmeters to increase exponentially, and even make it impossible to measure the multi-phase fluid. It is necessary to develop multi-phase flow detection device and methods that are accurate, reliable, to meet the requirement of real-time detection of oil and gas production. ...
Multiphase flow measurement system and method: US9068873B2
1
2015
... At present, online and quantitative detection of multi-phase flow in oil and gas wells and pipelines is a problem that has drawn wide attention in the oil industry[1]. There is no reliable technology that can accurately measure the flow of each phase in the multi-phase flow without separating oil, gas and water. Traditional three-phase separating measurement methods (glass tube, tipping bucket, etc.) are less effective, with high cost, large footprint, and data delay, and cannot reflect the real transient fluid production at wellhead. In recent years, online multi-phase flow measurement technology and instruments have been widely concerned and gradually developed[2,3,4,5,6,7,8,9,10,11,12,13,14,15]. With this technology, produced fluid can be measured online at wellhead before stabilization, separation and full process treatment, etc. so that the influence of human factors is minimized and the results can truly reflect the transient performance of fluid at wellhead. It is of great significance for fine reservoir management, production distribution optimization and wellhead testing. However, the existing multi-phase flow detection technology still has some practical problems, including difficult instrument calibration, radioactivity, limited application range, complicated models for data interpretation and processing, and high maintenance cost. In addition, with the increase of development scale of unconventional oil and gas resources and unconventional oil and gas wells, multi- phase flow measurement have to face produced fluids with high gas content, high water cut, high viscosity, and high salinity. These factors will directly cause the measurement error of the existing flowmeters to increase exponentially, and even make it impossible to measure the multi-phase fluid. It is necessary to develop multi-phase flow detection device and methods that are accurate, reliable, to meet the requirement of real-time detection of oil and gas production. ...
Lanzhou Haimo Technology Co. Ltd. Positron tomography device and method for multiphase flow: CN102565844B
1
2016
... At present, online and quantitative detection of multi-phase flow in oil and gas wells and pipelines is a problem that has drawn wide attention in the oil industry[1]. There is no reliable technology that can accurately measure the flow of each phase in the multi-phase flow without separating oil, gas and water. Traditional three-phase separating measurement methods (glass tube, tipping bucket, etc.) are less effective, with high cost, large footprint, and data delay, and cannot reflect the real transient fluid production at wellhead. In recent years, online multi-phase flow measurement technology and instruments have been widely concerned and gradually developed[2,3,4,5,6,7,8,9,10,11,12,13,14,15]. With this technology, produced fluid can be measured online at wellhead before stabilization, separation and full process treatment, etc. so that the influence of human factors is minimized and the results can truly reflect the transient performance of fluid at wellhead. It is of great significance for fine reservoir management, production distribution optimization and wellhead testing. However, the existing multi-phase flow detection technology still has some practical problems, including difficult instrument calibration, radioactivity, limited application range, complicated models for data interpretation and processing, and high maintenance cost. In addition, with the increase of development scale of unconventional oil and gas resources and unconventional oil and gas wells, multi- phase flow measurement have to face produced fluids with high gas content, high water cut, high viscosity, and high salinity. These factors will directly cause the measurement error of the existing flowmeters to increase exponentially, and even make it impossible to measure the multi-phase fluid. It is necessary to develop multi-phase flow detection device and methods that are accurate, reliable, to meet the requirement of real-time detection of oil and gas production. ...
The technical status of in-line multiphase flow meter in China
1
2019
... At present, online and quantitative detection of multi-phase flow in oil and gas wells and pipelines is a problem that has drawn wide attention in the oil industry[1]. There is no reliable technology that can accurately measure the flow of each phase in the multi-phase flow without separating oil, gas and water. Traditional three-phase separating measurement methods (glass tube, tipping bucket, etc.) are less effective, with high cost, large footprint, and data delay, and cannot reflect the real transient fluid production at wellhead. In recent years, online multi-phase flow measurement technology and instruments have been widely concerned and gradually developed[2,3,4,5,6,7,8,9,10,11,12,13,14,15]. With this technology, produced fluid can be measured online at wellhead before stabilization, separation and full process treatment, etc. so that the influence of human factors is minimized and the results can truly reflect the transient performance of fluid at wellhead. It is of great significance for fine reservoir management, production distribution optimization and wellhead testing. However, the existing multi-phase flow detection technology still has some practical problems, including difficult instrument calibration, radioactivity, limited application range, complicated models for data interpretation and processing, and high maintenance cost. In addition, with the increase of development scale of unconventional oil and gas resources and unconventional oil and gas wells, multi- phase flow measurement have to face produced fluids with high gas content, high water cut, high viscosity, and high salinity. These factors will directly cause the measurement error of the existing flowmeters to increase exponentially, and even make it impossible to measure the multi-phase fluid. It is necessary to develop multi-phase flow detection device and methods that are accurate, reliable, to meet the requirement of real-time detection of oil and gas production. ...
Research and application of multiphase flowmeter
1
2006
... At present, online and quantitative detection of multi-phase flow in oil and gas wells and pipelines is a problem that has drawn wide attention in the oil industry[1]. There is no reliable technology that can accurately measure the flow of each phase in the multi-phase flow without separating oil, gas and water. Traditional three-phase separating measurement methods (glass tube, tipping bucket, etc.) are less effective, with high cost, large footprint, and data delay, and cannot reflect the real transient fluid production at wellhead. In recent years, online multi-phase flow measurement technology and instruments have been widely concerned and gradually developed[2,3,4,5,6,7,8,9,10,11,12,13,14,15]. With this technology, produced fluid can be measured online at wellhead before stabilization, separation and full process treatment, etc. so that the influence of human factors is minimized and the results can truly reflect the transient performance of fluid at wellhead. It is of great significance for fine reservoir management, production distribution optimization and wellhead testing. However, the existing multi-phase flow detection technology still has some practical problems, including difficult instrument calibration, radioactivity, limited application range, complicated models for data interpretation and processing, and high maintenance cost. In addition, with the increase of development scale of unconventional oil and gas resources and unconventional oil and gas wells, multi- phase flow measurement have to face produced fluids with high gas content, high water cut, high viscosity, and high salinity. These factors will directly cause the measurement error of the existing flowmeters to increase exponentially, and even make it impossible to measure the multi-phase fluid. It is necessary to develop multi-phase flow detection device and methods that are accurate, reliable, to meet the requirement of real-time detection of oil and gas production. ...
Application and perspective of multiphase flow metering technologies for ocean oil and gas exploitation
1
2014
... At present, online and quantitative detection of multi-phase flow in oil and gas wells and pipelines is a problem that has drawn wide attention in the oil industry[1]. There is no reliable technology that can accurately measure the flow of each phase in the multi-phase flow without separating oil, gas and water. Traditional three-phase separating measurement methods (glass tube, tipping bucket, etc.) are less effective, with high cost, large footprint, and data delay, and cannot reflect the real transient fluid production at wellhead. In recent years, online multi-phase flow measurement technology and instruments have been widely concerned and gradually developed[2,3,4,5,6,7,8,9,10,11,12,13,14,15]. With this technology, produced fluid can be measured online at wellhead before stabilization, separation and full process treatment, etc. so that the influence of human factors is minimized and the results can truly reflect the transient performance of fluid at wellhead. It is of great significance for fine reservoir management, production distribution optimization and wellhead testing. However, the existing multi-phase flow detection technology still has some practical problems, including difficult instrument calibration, radioactivity, limited application range, complicated models for data interpretation and processing, and high maintenance cost. In addition, with the increase of development scale of unconventional oil and gas resources and unconventional oil and gas wells, multi- phase flow measurement have to face produced fluids with high gas content, high water cut, high viscosity, and high salinity. These factors will directly cause the measurement error of the existing flowmeters to increase exponentially, and even make it impossible to measure the multi-phase fluid. It is necessary to develop multi-phase flow detection device and methods that are accurate, reliable, to meet the requirement of real-time detection of oil and gas production. ...
Three- phase flow measurement in the petroleum industry
1
2013
... At present, online and quantitative detection of multi-phase flow in oil and gas wells and pipelines is a problem that has drawn wide attention in the oil industry[1]. There is no reliable technology that can accurately measure the flow of each phase in the multi-phase flow without separating oil, gas and water. Traditional three-phase separating measurement methods (glass tube, tipping bucket, etc.) are less effective, with high cost, large footprint, and data delay, and cannot reflect the real transient fluid production at wellhead. In recent years, online multi-phase flow measurement technology and instruments have been widely concerned and gradually developed[2,3,4,5,6,7,8,9,10,11,12,13,14,15]. With this technology, produced fluid can be measured online at wellhead before stabilization, separation and full process treatment, etc. so that the influence of human factors is minimized and the results can truly reflect the transient performance of fluid at wellhead. It is of great significance for fine reservoir management, production distribution optimization and wellhead testing. However, the existing multi-phase flow detection technology still has some practical problems, including difficult instrument calibration, radioactivity, limited application range, complicated models for data interpretation and processing, and high maintenance cost. In addition, with the increase of development scale of unconventional oil and gas resources and unconventional oil and gas wells, multi- phase flow measurement have to face produced fluids with high gas content, high water cut, high viscosity, and high salinity. These factors will directly cause the measurement error of the existing flowmeters to increase exponentially, and even make it impossible to measure the multi-phase fluid. It is necessary to develop multi-phase flow detection device and methods that are accurate, reliable, to meet the requirement of real-time detection of oil and gas production. ...
Fourier collocation approach with mesh refinement method for simulating transit-time ultrasonic flow meters under multiphase flow conditions.
1
2018
... At present, online and quantitative detection of multi-phase flow in oil and gas wells and pipelines is a problem that has drawn wide attention in the oil industry[1]. There is no reliable technology that can accurately measure the flow of each phase in the multi-phase flow without separating oil, gas and water. Traditional three-phase separating measurement methods (glass tube, tipping bucket, etc.) are less effective, with high cost, large footprint, and data delay, and cannot reflect the real transient fluid production at wellhead. In recent years, online multi-phase flow measurement technology and instruments have been widely concerned and gradually developed[2,3,4,5,6,7,8,9,10,11,12,13,14,15]. With this technology, produced fluid can be measured online at wellhead before stabilization, separation and full process treatment, etc. so that the influence of human factors is minimized and the results can truly reflect the transient performance of fluid at wellhead. It is of great significance for fine reservoir management, production distribution optimization and wellhead testing. However, the existing multi-phase flow detection technology still has some practical problems, including difficult instrument calibration, radioactivity, limited application range, complicated models for data interpretation and processing, and high maintenance cost. In addition, with the increase of development scale of unconventional oil and gas resources and unconventional oil and gas wells, multi- phase flow measurement have to face produced fluids with high gas content, high water cut, high viscosity, and high salinity. These factors will directly cause the measurement error of the existing flowmeters to increase exponentially, and even make it impossible to measure the multi-phase fluid. It is necessary to develop multi-phase flow detection device and methods that are accurate, reliable, to meet the requirement of real-time detection of oil and gas production. ...
Numerical study of gas-liquid flow morphology in a vertical flowmeter nozzle.
1
2017
... At present, online and quantitative detection of multi-phase flow in oil and gas wells and pipelines is a problem that has drawn wide attention in the oil industry[1]. There is no reliable technology that can accurately measure the flow of each phase in the multi-phase flow without separating oil, gas and water. Traditional three-phase separating measurement methods (glass tube, tipping bucket, etc.) are less effective, with high cost, large footprint, and data delay, and cannot reflect the real transient fluid production at wellhead. In recent years, online multi-phase flow measurement technology and instruments have been widely concerned and gradually developed[2,3,4,5,6,7,8,9,10,11,12,13,14,15]. With this technology, produced fluid can be measured online at wellhead before stabilization, separation and full process treatment, etc. so that the influence of human factors is minimized and the results can truly reflect the transient performance of fluid at wellhead. It is of great significance for fine reservoir management, production distribution optimization and wellhead testing. However, the existing multi-phase flow detection technology still has some practical problems, including difficult instrument calibration, radioactivity, limited application range, complicated models for data interpretation and processing, and high maintenance cost. In addition, with the increase of development scale of unconventional oil and gas resources and unconventional oil and gas wells, multi- phase flow measurement have to face produced fluids with high gas content, high water cut, high viscosity, and high salinity. These factors will directly cause the measurement error of the existing flowmeters to increase exponentially, and even make it impossible to measure the multi-phase fluid. It is necessary to develop multi-phase flow detection device and methods that are accurate, reliable, to meet the requirement of real-time detection of oil and gas production. ...
Investigation on the oil-water-gas measurements in viscous oil
1
2016
... At present, online and quantitative detection of multi-phase flow in oil and gas wells and pipelines is a problem that has drawn wide attention in the oil industry[1]. There is no reliable technology that can accurately measure the flow of each phase in the multi-phase flow without separating oil, gas and water. Traditional three-phase separating measurement methods (glass tube, tipping bucket, etc.) are less effective, with high cost, large footprint, and data delay, and cannot reflect the real transient fluid production at wellhead. In recent years, online multi-phase flow measurement technology and instruments have been widely concerned and gradually developed[2,3,4,5,6,7,8,9,10,11,12,13,14,15]. With this technology, produced fluid can be measured online at wellhead before stabilization, separation and full process treatment, etc. so that the influence of human factors is minimized and the results can truly reflect the transient performance of fluid at wellhead. It is of great significance for fine reservoir management, production distribution optimization and wellhead testing. However, the existing multi-phase flow detection technology still has some practical problems, including difficult instrument calibration, radioactivity, limited application range, complicated models for data interpretation and processing, and high maintenance cost. In addition, with the increase of development scale of unconventional oil and gas resources and unconventional oil and gas wells, multi- phase flow measurement have to face produced fluids with high gas content, high water cut, high viscosity, and high salinity. These factors will directly cause the measurement error of the existing flowmeters to increase exponentially, and even make it impossible to measure the multi-phase fluid. It is necessary to develop multi-phase flow detection device and methods that are accurate, reliable, to meet the requirement of real-time detection of oil and gas production. ...
An investigation of phase volume fraction measurement technology in multiphase flowmeter
1
2019
... At present, online and quantitative detection of multi-phase flow in oil and gas wells and pipelines is a problem that has drawn wide attention in the oil industry[1]. There is no reliable technology that can accurately measure the flow of each phase in the multi-phase flow without separating oil, gas and water. Traditional three-phase separating measurement methods (glass tube, tipping bucket, etc.) are less effective, with high cost, large footprint, and data delay, and cannot reflect the real transient fluid production at wellhead. In recent years, online multi-phase flow measurement technology and instruments have been widely concerned and gradually developed[2,3,4,5,6,7,8,9,10,11,12,13,14,15]. With this technology, produced fluid can be measured online at wellhead before stabilization, separation and full process treatment, etc. so that the influence of human factors is minimized and the results can truly reflect the transient performance of fluid at wellhead. It is of great significance for fine reservoir management, production distribution optimization and wellhead testing. However, the existing multi-phase flow detection technology still has some practical problems, including difficult instrument calibration, radioactivity, limited application range, complicated models for data interpretation and processing, and high maintenance cost. In addition, with the increase of development scale of unconventional oil and gas resources and unconventional oil and gas wells, multi- phase flow measurement have to face produced fluids with high gas content, high water cut, high viscosity, and high salinity. These factors will directly cause the measurement error of the existing flowmeters to increase exponentially, and even make it impossible to measure the multi-phase fluid. It is necessary to develop multi-phase flow detection device and methods that are accurate, reliable, to meet the requirement of real-time detection of oil and gas production. ...
A stratified flow multiphase flowmeter: USPTO 20180348035
1
2018
... At present, online and quantitative detection of multi-phase flow in oil and gas wells and pipelines is a problem that has drawn wide attention in the oil industry[1]. There is no reliable technology that can accurately measure the flow of each phase in the multi-phase flow without separating oil, gas and water. Traditional three-phase separating measurement methods (glass tube, tipping bucket, etc.) are less effective, with high cost, large footprint, and data delay, and cannot reflect the real transient fluid production at wellhead. In recent years, online multi-phase flow measurement technology and instruments have been widely concerned and gradually developed[2,3,4,5,6,7,8,9,10,11,12,13,14,15]. With this technology, produced fluid can be measured online at wellhead before stabilization, separation and full process treatment, etc. so that the influence of human factors is minimized and the results can truly reflect the transient performance of fluid at wellhead. It is of great significance for fine reservoir management, production distribution optimization and wellhead testing. However, the existing multi-phase flow detection technology still has some practical problems, including difficult instrument calibration, radioactivity, limited application range, complicated models for data interpretation and processing, and high maintenance cost. In addition, with the increase of development scale of unconventional oil and gas resources and unconventional oil and gas wells, multi- phase flow measurement have to face produced fluids with high gas content, high water cut, high viscosity, and high salinity. These factors will directly cause the measurement error of the existing flowmeters to increase exponentially, and even make it impossible to measure the multi-phase fluid. It is necessary to develop multi-phase flow detection device and methods that are accurate, reliable, to meet the requirement of real-time detection of oil and gas production. ...
A magnetic system based on permanent magnets for a flowmeter of multiphase fluid media
1
2014
... At present, online and quantitative detection of multi-phase flow in oil and gas wells and pipelines is a problem that has drawn wide attention in the oil industry[1]. There is no reliable technology that can accurately measure the flow of each phase in the multi-phase flow without separating oil, gas and water. Traditional three-phase separating measurement methods (glass tube, tipping bucket, etc.) are less effective, with high cost, large footprint, and data delay, and cannot reflect the real transient fluid production at wellhead. In recent years, online multi-phase flow measurement technology and instruments have been widely concerned and gradually developed[2,3,4,5,6,7,8,9,10,11,12,13,14,15]. With this technology, produced fluid can be measured online at wellhead before stabilization, separation and full process treatment, etc. so that the influence of human factors is minimized and the results can truly reflect the transient performance of fluid at wellhead. It is of great significance for fine reservoir management, production distribution optimization and wellhead testing. However, the existing multi-phase flow detection technology still has some practical problems, including difficult instrument calibration, radioactivity, limited application range, complicated models for data interpretation and processing, and high maintenance cost. In addition, with the increase of development scale of unconventional oil and gas resources and unconventional oil and gas wells, multi- phase flow measurement have to face produced fluids with high gas content, high water cut, high viscosity, and high salinity. These factors will directly cause the measurement error of the existing flowmeters to increase exponentially, and even make it impossible to measure the multi-phase fluid. It is necessary to develop multi-phase flow detection device and methods that are accurate, reliable, to meet the requirement of real-time detection of oil and gas production. ...
1
2000
... Magnetic resonance (MR) technology is a green, efficient and accurate method for oil and gas detection. After years of research and practice, it has been widely used in well logging evaluation[16] and indoor petrophysical research. MR can qualitatively/quantitatively evaluate reservoir fluids by acquiring information on molecular scale[17]. Its unique measurement principle and method make it possible to simultaneously measure the flow rate and phase holdup of multiphase flow in theory, so it is highly possible to realize online multiphase flow detection with this technology. But it is difficult for existing laboratory MR technology and instruments to be directly applied to the quantitative detection of multiphase flow in oil and gas wells and pipelines strongly affected by fluid motion and harsh working environment[18,19,20,21]. It is necessary to develop new methods to meet the requirements of field application. ...
NMR at low magnetic fields
1
2009
... Magnetic resonance (MR) technology is a green, efficient and accurate method for oil and gas detection. After years of research and practice, it has been widely used in well logging evaluation[16] and indoor petrophysical research. MR can qualitatively/quantitatively evaluate reservoir fluids by acquiring information on molecular scale[17]. Its unique measurement principle and method make it possible to simultaneously measure the flow rate and phase holdup of multiphase flow in theory, so it is highly possible to realize online multiphase flow detection with this technology. But it is difficult for existing laboratory MR technology and instruments to be directly applied to the quantitative detection of multiphase flow in oil and gas wells and pipelines strongly affected by fluid motion and harsh working environment[18,19,20,21]. It is necessary to develop new methods to meet the requirements of field application. ...
Effects and correction for mobile NMR measurement
1
2013
... Magnetic resonance (MR) technology is a green, efficient and accurate method for oil and gas detection. After years of research and practice, it has been widely used in well logging evaluation[16] and indoor petrophysical research. MR can qualitatively/quantitatively evaluate reservoir fluids by acquiring information on molecular scale[17]. Its unique measurement principle and method make it possible to simultaneously measure the flow rate and phase holdup of multiphase flow in theory, so it is highly possible to realize online multiphase flow detection with this technology. But it is difficult for existing laboratory MR technology and instruments to be directly applied to the quantitative detection of multiphase flow in oil and gas wells and pipelines strongly affected by fluid motion and harsh working environment[18,19,20,21]. It is necessary to develop new methods to meet the requirements of field application. ...
Sensor design and implementation for a downhole NMR fluid analysis laboratory
1
2012
... Magnetic resonance (MR) technology is a green, efficient and accurate method for oil and gas detection. After years of research and practice, it has been widely used in well logging evaluation[16] and indoor petrophysical research. MR can qualitatively/quantitatively evaluate reservoir fluids by acquiring information on molecular scale[17]. Its unique measurement principle and method make it possible to simultaneously measure the flow rate and phase holdup of multiphase flow in theory, so it is highly possible to realize online multiphase flow detection with this technology. But it is difficult for existing laboratory MR technology and instruments to be directly applied to the quantitative detection of multiphase flow in oil and gas wells and pipelines strongly affected by fluid motion and harsh working environment[18,19,20,21]. It is necessary to develop new methods to meet the requirements of field application. ...
Effects of motion in pulsed NMR logging
1
1990
... Magnetic resonance (MR) technology is a green, efficient and accurate method for oil and gas detection. After years of research and practice, it has been widely used in well logging evaluation[16] and indoor petrophysical research. MR can qualitatively/quantitatively evaluate reservoir fluids by acquiring information on molecular scale[17]. Its unique measurement principle and method make it possible to simultaneously measure the flow rate and phase holdup of multiphase flow in theory, so it is highly possible to realize online multiphase flow detection with this technology. But it is difficult for existing laboratory MR technology and instruments to be directly applied to the quantitative detection of multiphase flow in oil and gas wells and pipelines strongly affected by fluid motion and harsh working environment[18,19,20,21]. It is necessary to develop new methods to meet the requirements of field application. ...
A method for enhancing the vertical resolution of NMR logs
1
2000
... Magnetic resonance (MR) technology is a green, efficient and accurate method for oil and gas detection. After years of research and practice, it has been widely used in well logging evaluation[16] and indoor petrophysical research. MR can qualitatively/quantitatively evaluate reservoir fluids by acquiring information on molecular scale[17]. Its unique measurement principle and method make it possible to simultaneously measure the flow rate and phase holdup of multiphase flow in theory, so it is highly possible to realize online multiphase flow detection with this technology. But it is difficult for existing laboratory MR technology and instruments to be directly applied to the quantitative detection of multiphase flow in oil and gas wells and pipelines strongly affected by fluid motion and harsh working environment[18,19,20,21]. It is necessary to develop new methods to meet the requirements of field application. ...
Nuclear induction
1
1946
... The effect of flow rate on MR measurement can be reflected by the variation of the nuclear magnetization vector. Bloch equation[22] provides how the longitudinal component Mz, and transverse components Mx and My of the nuclear magnetization vector change with time in the direction of the static magnetic field in the rotating coordinate system: ...
Theoretical hydromechanics
1
2009
... It should be noted that the flow rate distribution functions in different flow regimes are different[23,24,25,26], and they will not be listed one by one here. Fluid flow will cause the first amplitude value of the echo string to be lower than that of the static measurement, and the faster the flow rate is, the greater the first amplitude value decreases. In practical applications, the reduction of the amplitude of the echo string means a decrease in the signal-to-noise ratio[27,28,29,30,31]. In order to get a higher signal-to-noise ratio and improve the measurement accuracy, it is expected a longer pre-magnetization of the multiphase flow, which is also one of the decisive parameters affecting the upper limit of flow measurement. ...
Fluidity and plasticity.
1
1922
... It should be noted that the flow rate distribution functions in different flow regimes are different[23,24,25,26], and they will not be listed one by one here. Fluid flow will cause the first amplitude value of the echo string to be lower than that of the static measurement, and the faster the flow rate is, the greater the first amplitude value decreases. In practical applications, the reduction of the amplitude of the echo string means a decrease in the signal-to-noise ratio[27,28,29,30,31]. In order to get a higher signal-to-noise ratio and improve the measurement accuracy, it is expected a longer pre-magnetization of the multiphase flow, which is also one of the decisive parameters affecting the upper limit of flow measurement. ...
1
1959
... It should be noted that the flow rate distribution functions in different flow regimes are different[23,24,25,26], and they will not be listed one by one here. Fluid flow will cause the first amplitude value of the echo string to be lower than that of the static measurement, and the faster the flow rate is, the greater the first amplitude value decreases. In practical applications, the reduction of the amplitude of the echo string means a decrease in the signal-to-noise ratio[27,28,29,30,31]. In order to get a higher signal-to-noise ratio and improve the measurement accuracy, it is expected a longer pre-magnetization of the multiphase flow, which is also one of the decisive parameters affecting the upper limit of flow measurement. ...
Measurement of consistency as applied to rubber-benzene solutions
1
1926
... It should be noted that the flow rate distribution functions in different flow regimes are different[23,24,25,26], and they will not be listed one by one here. Fluid flow will cause the first amplitude value of the echo string to be lower than that of the static measurement, and the faster the flow rate is, the greater the first amplitude value decreases. In practical applications, the reduction of the amplitude of the echo string means a decrease in the signal-to-noise ratio[27,28,29,30,31]. In order to get a higher signal-to-noise ratio and improve the measurement accuracy, it is expected a longer pre-magnetization of the multiphase flow, which is also one of the decisive parameters affecting the upper limit of flow measurement. ...
Miniature permanent magnet for table-top NMR
1
2003
... It should be noted that the flow rate distribution functions in different flow regimes are different[23,24,25,26], and they will not be listed one by one here. Fluid flow will cause the first amplitude value of the echo string to be lower than that of the static measurement, and the faster the flow rate is, the greater the first amplitude value decreases. In practical applications, the reduction of the amplitude of the echo string means a decrease in the signal-to-noise ratio[27,28,29,30,31]. In order to get a higher signal-to-noise ratio and improve the measurement accuracy, it is expected a longer pre-magnetization of the multiphase flow, which is also one of the decisive parameters affecting the upper limit of flow measurement. ...
On the signal-to-noise ratio of nuclear magnetic resonance oscillator spectrometers
1
2001
... It should be noted that the flow rate distribution functions in different flow regimes are different[23,24,25,26], and they will not be listed one by one here. Fluid flow will cause the first amplitude value of the echo string to be lower than that of the static measurement, and the faster the flow rate is, the greater the first amplitude value decreases. In practical applications, the reduction of the amplitude of the echo string means a decrease in the signal-to-noise ratio[27,28,29,30,31]. In order to get a higher signal-to-noise ratio and improve the measurement accuracy, it is expected a longer pre-magnetization of the multiphase flow, which is also one of the decisive parameters affecting the upper limit of flow measurement. ...
The signal-to-noise ratio of the nuclear magnetic resonance experiment
1
1976
... It should be noted that the flow rate distribution functions in different flow regimes are different[23,24,25,26], and they will not be listed one by one here. Fluid flow will cause the first amplitude value of the echo string to be lower than that of the static measurement, and the faster the flow rate is, the greater the first amplitude value decreases. In practical applications, the reduction of the amplitude of the echo string means a decrease in the signal-to-noise ratio[27,28,29,30,31]. In order to get a higher signal-to-noise ratio and improve the measurement accuracy, it is expected a longer pre-magnetization of the multiphase flow, which is also one of the decisive parameters affecting the upper limit of flow measurement. ...
BLüMICH B. Single-sided NMR
1
2011
... It should be noted that the flow rate distribution functions in different flow regimes are different[23,24,25,26], and they will not be listed one by one here. Fluid flow will cause the first amplitude value of the echo string to be lower than that of the static measurement, and the faster the flow rate is, the greater the first amplitude value decreases. In practical applications, the reduction of the amplitude of the echo string means a decrease in the signal-to-noise ratio[27,28,29,30,31]. In order to get a higher signal-to-noise ratio and improve the measurement accuracy, it is expected a longer pre-magnetization of the multiphase flow, which is also one of the decisive parameters affecting the upper limit of flow measurement. ...
Method for eliminating ringing during a nuclear magnetic resonance measurement: U.S. Patent 6121774
1
2000
... It should be noted that the flow rate distribution functions in different flow regimes are different[23,24,25,26], and they will not be listed one by one here. Fluid flow will cause the first amplitude value of the echo string to be lower than that of the static measurement, and the faster the flow rate is, the greater the first amplitude value decreases. In practical applications, the reduction of the amplitude of the echo string means a decrease in the signal-to-noise ratio[27,28,29,30,31]. In order to get a higher signal-to-noise ratio and improve the measurement accuracy, it is expected a longer pre-magnetization of the multiphase flow, which is also one of the decisive parameters affecting the upper limit of flow measurement. ...
Solving Fredholm integrals of the first kind with tensor product structure in 2 and 2.5 dimensions
1
2002
... Since the echo string measured in flowing state is the weighted sum of relaxation attenuation and flow-induced attenuation, in order to obtain the flow rate, it is necessary to remove normal relaxation attenuation in the echo string signal, and only keep the attenuation caused by fluid flow. The steps are as follows: (1) In the static state of fluid, collect a set of echo string Mstatic, and obtain a Mstatic-SVD curve after SVD (removing singulars)[32] and normalization (Fig. 3). (2) In the flowing state of fluid, collect a set of echo string Mflow by using the same parameters in the static state (interval TE and the number of echoes N), and obtain a Mflow-SVD curve after SVD and normalization (Fig. 3). (3) Divide Mflow-SVD by 1-Mstatic-SVD to eliminate the relaxation attenuation, and obtain a Mflow-SVD-SC curve (Fig. 3), which is the fitted echo string curve attenuated by fluid flow. After linearly fitting the Mflow-SVD-SC curve, we get a straight line Mflow-SVD-SC=1-v/A. Calculating it, we can get the average flow velocity v. ...
Design of permanent multipole magnets with oriented rare earth cobalt material
1
1980
... The continuous changes of the flow rate and flow regime of each phase of the multi-phase flow set very high requirements on the accuracy, reliability and timeliness of the MRMF. Specially designed, the MRMF probe is more complicated than a traditional NMR instrument for static measurement. The core components of the MR probe are the magnet and antenna, which are used to generate a static magnetic field and a radio frequency field, respectively.The MR probe uses permanent magnetic material to provide the required static magnetic field. The magnet cross-section is a Halbach structure[33,34], which can produce a uniform magnetic field inside the probe, and at the same time, the structure with the merit of "zero leakage" can improve the safety of the MRMF in field application. The magnet is a multi-stage structure in the axial direction and is divided into two parts: a pre-magnetized area and a detection area (Fig. 6). The magnetic field strength of the pre-magnetization area is designed to be slightly higher than that of the detection area to achieve rapid magnetization of the multiphase flow. The magnetic field distribution of the probe is shown in Fig. 6. ...
Proposal for a permanent magnet system with a constant gradient mechanically adjustable in direction and strength
1
2016
... The continuous changes of the flow rate and flow regime of each phase of the multi-phase flow set very high requirements on the accuracy, reliability and timeliness of the MRMF. Specially designed, the MRMF probe is more complicated than a traditional NMR instrument for static measurement. The core components of the MR probe are the magnet and antenna, which are used to generate a static magnetic field and a radio frequency field, respectively.The MR probe uses permanent magnetic material to provide the required static magnetic field. The magnet cross-section is a Halbach structure[33,34], which can produce a uniform magnetic field inside the probe, and at the same time, the structure with the merit of "zero leakage" can improve the safety of the MRMF in field application. The magnet is a multi-stage structure in the axial direction and is divided into two parts: a pre-magnetized area and a detection area (Fig. 6). The magnetic field strength of the pre-magnetization area is designed to be slightly higher than that of the detection area to achieve rapid magnetization of the multiphase flow. The magnetic field distribution of the probe is shown in Fig. 6. ...


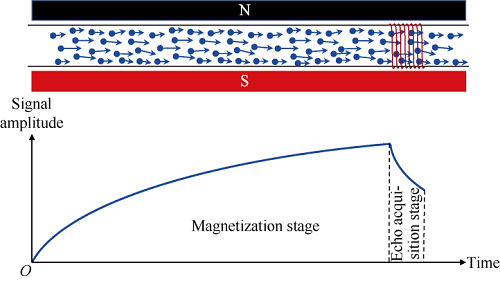
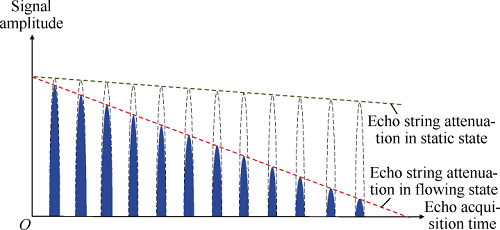
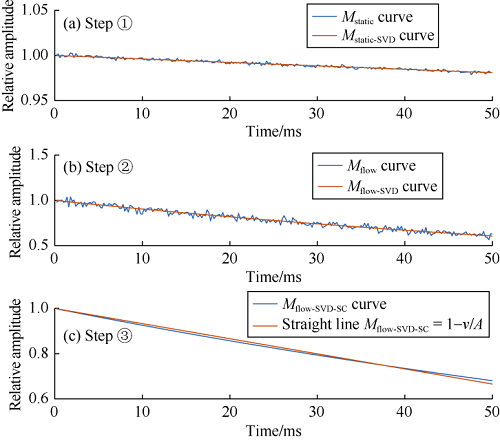
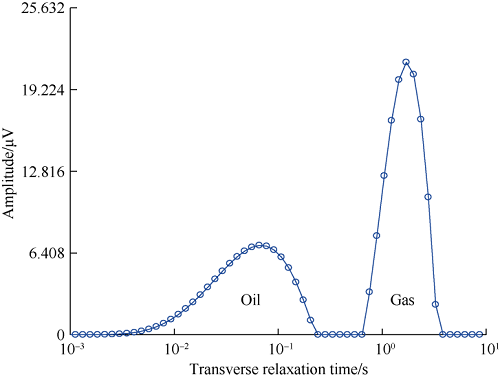

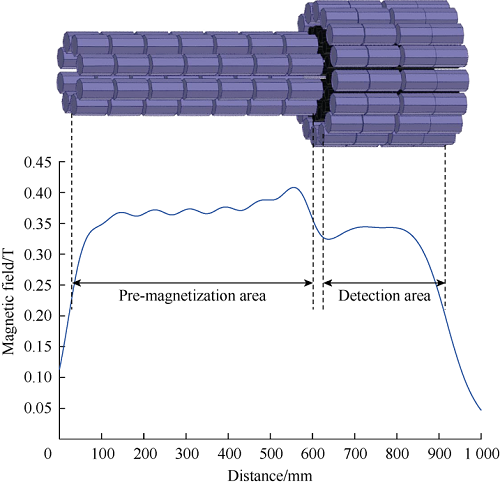
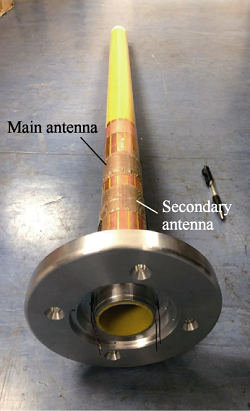

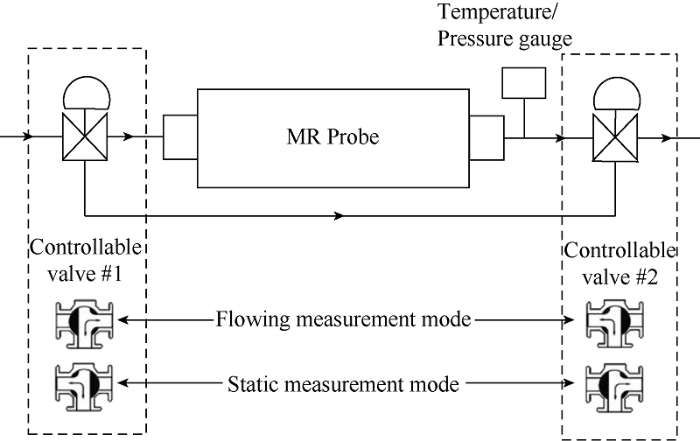
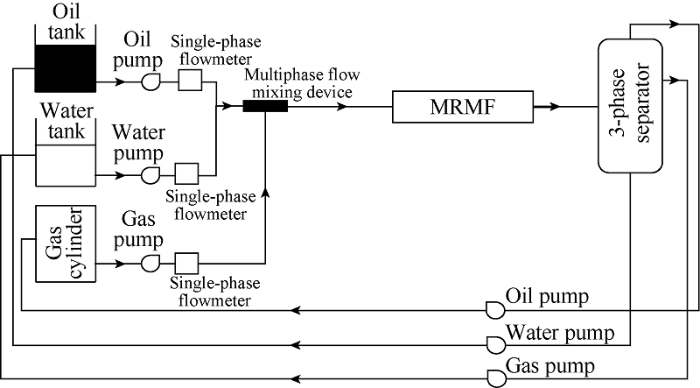
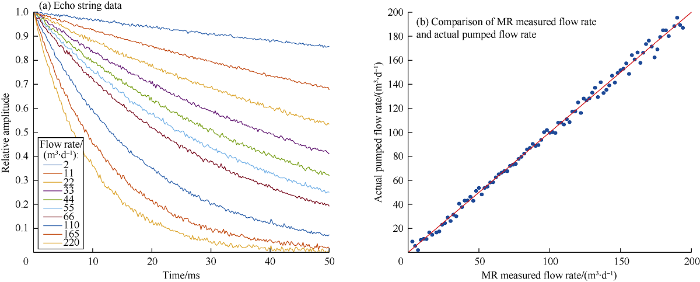
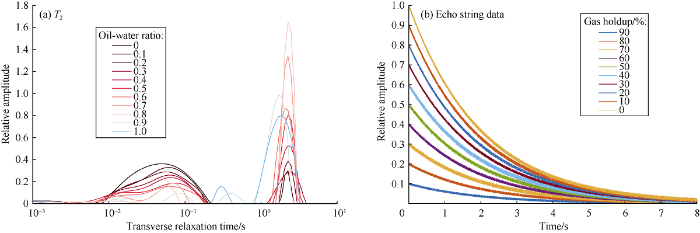
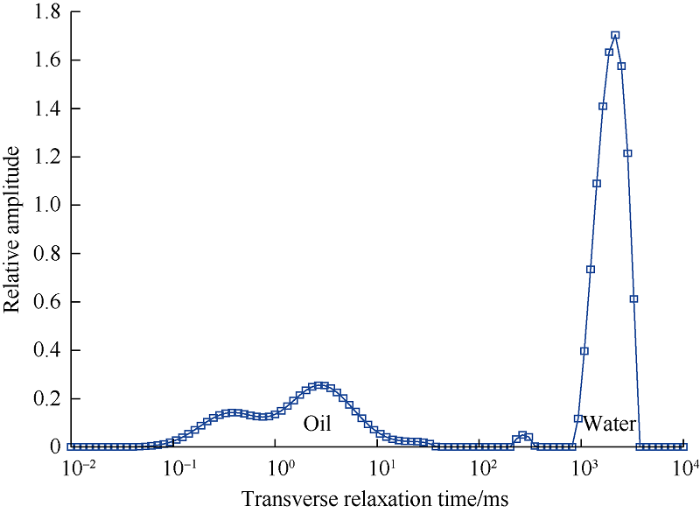
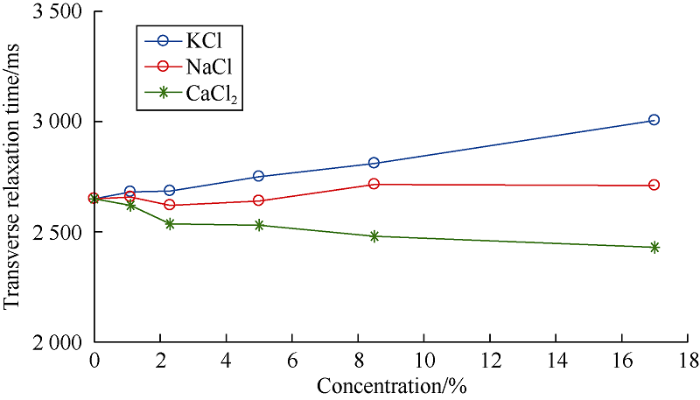

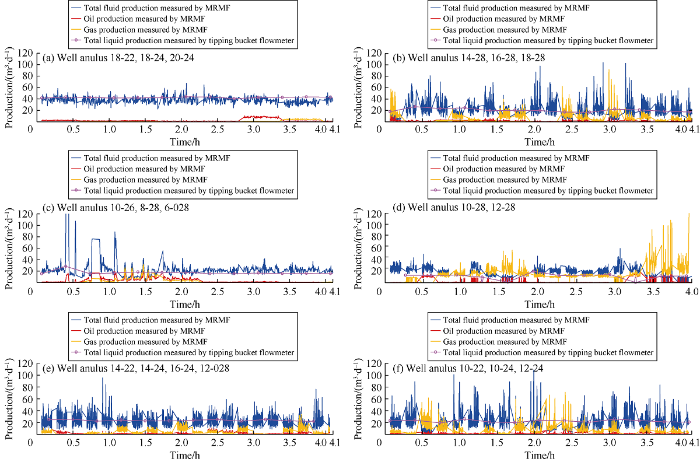

