


Introduction
With the increasing demand for energy, shale gas has become a major unconventional oil and gas resource in China. The black shale of the Silurian Longmaxi Formation in the Sichuan Basin and its surrounding areas with rich organic matter, moderate burial depth, and high degree of organic matter evolution has become the cradle of shale gas exploration and development in China[1,2,3]. Since 2009, breakthroughs have been made in this formation by China Petroleum & Chemical Corporation (referred to as “Sinopec”) in the Jiaoshiba area of Fuling and by China National Petroleum Company (referred to as “PetroChina”) in the Weiyuan-Changning region in Sichuan, which has promoted further commercial exploitation of shale gas in China[1,2,3].
At present, the most direct and effective methods for shale gas exploration and development should be the methods based on seismic data, for example, in the early stage of exploration, the seismic interpretation and attribute analysis techniques are used to determine the trap elements, structural attitude, mineralogical composition, reservoir physical properties and organic matter content, etc., and in the later stage of development, techniques based on seismic inversion and attribute model building are used to determine the anisotropy, brittleness and crustal stress of shale reservoirs[4]. Petrophysical properties of shale are the direct bridges to obtain the physical and mechanical characteristics of shale reservoirs with seismic attributes. The research on the changing pattern of seismic elastic properties in shale reservoir and its influencing factors is mainly through systematic petrophysical experiments and quantitative seismic petrophysical modeling at home and abroad. Compared with the current researches in China, the research on shale reservoir petrophysics was carried out long time ago in foreign countries. In shale petrophysical experiments, Vernik and Nur studied the anisotropic characteristics of Bakken shale under dry conditions to analyze the effects of organic matter content and maturity on wave velocity and anisotropy characteristics of shale, and pointed out that the preferred direction of rock minerals and the development of fractures parallel to the bedding determined the anisotropy characteristics of shale rocks[5]. Sondergeld and Rai conducted experimental measurements on the acoustic properties of the Kimmeridge shale, and found that there was a positive correlation between the organic matter content and the anisotropic degree of the shale, and the increase of organic matter content would have a weakening effect on formation compaction. They also pointed out that the weak anisotropy assumption was no longer applicable in the shale seismic forward modeling[6,7]. Dewhurst analyzed the effects of maturity and principal stress direction on shale anisotropy[8]. Deng Jixin et al. discussed the influence of the differences in sedimentation and diagenesis processes on the seismic elastic properties of the Longmaxi Formation based on the microstructure observations, petrophysical experiments and the analysis of the seismic elastic characteristics of the Longmaxi Formation shale[9,10]. The results show that shale layers in different regions and formations have obvious differences in the seismic elastic properties, and the differences are affected by organic matter content, pore character, composition feature, rock texture and reservoir conditions jointly. There is also systematic research on the petrophysical modeling for quantitatively characterizing the seismic elastic properties of shale[9,10]. The main modeling method is to calculate the shale elastic anisotropy by using anisotropic self-consistent and differential equivalent modulus formulas and then find out the impact of clay, TOC value and the distribution characteristics of pore structure on the seismic elastic properties[11,12,13]. Guo Zhiqi et al.[14] studied the relations between reservoir physical properties such as organic matter, minerals, fissures and shale elastic anisotropy based on the analysis of organic matter, pores and the spatial distribution of main minerals. Based on self-consistent model and differential equivalent medium model, Zhang Feng and Li Xiangyang studied the theoretical petrophysical model of organic rich shale, and discussed the influence of pore shape and mineral composition on shale elastic properties[15].
The above-mentioned experiments and petrophysical models for shale have well supported the current “sweet spot” seismic prediction technology in shale gas reservoirs. But limited by shale gas development technology and economic benefit, the previous experimental studies on the seismic petrophysical properties were all aimed at medium and shallow reservoirs (with buried depth less than 3500 m). The Longmaxi shale in the Sichuan Basin is deep and ultra-deep in large areas. For example, Weiyuan-Changning in the southern Sichuan Basin (referred to as "Southern Sichuan"), the main exploration and development block in China, has a favorable exploration area of shallow shale of 2500 km2, and a favorable exploration area of deep shale (depth greater than 3500 m) of 17450 km2. The different depths of the Longmaxi shale Formation result in some differences in mineral composition, rock texture, pore structure, organic matter occurrence state and stress field. The petrophysical experimental results of shallow shale can’t reflect the properties of deep shale, and cannot be borrowed to seismic interpretation of deep shale layers. The exploration and development of the deep shale reservoirs in the Longmaxi Formation requires systematic experimental research on the petrophysical properties of the deep shale layers in the target area. In this study, the seismic petrophysical properties, static mechanical properties and petrological characteristics of deep shale samples from the Longmaxi Formation in southern Sichuan were tested systematically to find out the variation pattern of petrophysical properties and the main geological factors influencing variation of the shale petrophysical properties, in the hope to provide a basis for well-logging interpretation and “sweet spot” prediction using seismic method for deep Longmaxi shale reservoirs.
1. Geological setting and test methods
The study area is in Rongchang District, Dazu District of Chongqing City and Neijiang City of Sichuan Province (Fig. 1a). It is in the junction of the gentle belt in central Sichuan, the low steep tectonic belt of in southwestern Sichuan and low steep tectonic belt in southern Sichuan (Fig. 1a). In this area, the Longmaxi shale is flat and simple in structure, and overpressured on the whole, with measured pressure coefficients of 1.99-2.25. The Longmaxi shale, well preserved and over 3700 m deep, is a typical deep shale gas reservoir. The Longmaxi Formation can be divided into the second member of Longmaxi Formation and the first member of Longmaxi Formation (shortened as “Long 2 Member” and “Long 1 Member”). The first member of Longmaxi Formation, which is the main exploration interval, is further divided into two sub- members, Long 11 and Long12, and the Long 11 sub-member is divided into four sublayers, the fourth, third, second and first from top to bottom (Fig. 1b).
Fig. 1.
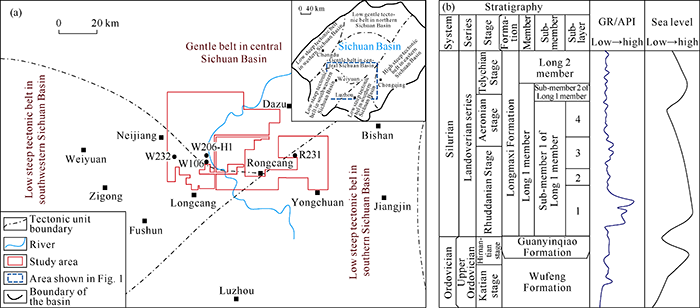
Fig. 1.
Location map of the study area
(a) and the sublayer division of the Silurian Longmaxi Formation shale (b).
The Longmaxi Formation shale samples (including some Ordovician Wufeng Formation shale samples) tested in this research were from 4 wells including Well W106 in Weiyuan- Changning block. A total number of 121 plug samples (mainly vertical bedding samples) were taken from 5 sub-members of the Long 1 Member in the 4 wells. The plug samples were drilled in standard plug samples with more than 70 mm high, cut to 40 to 55 mm high by wire cutting, and polished at the end faces to ensure that the end face slope was less than 0.05 mm for subsequent dynamic and static accurate testing of elastic properties. The left part of the plug sample was used for argon ion polishing scanning electron microscope (AIM-SEM) analysis and polarizing microscope analysis to obtain the mineral composition, microstructure and pore characteristics. At the same time, the remaining samples after cutting were used for geochemical analysis, including X-ray diffraction analysis of bulk rock mineral composition (PANalytical X-ray diffractometer), analysis of 10 main oxides, 32 trace elements (plasma mass spectrometer ICP- MS) and total organic carbon content (TOC value).
Under "relative" dry conditions (the sample contains only crystalline water and clay bound water), the dynamic and static elastic properties of the shale samples were tested. The longitudinal and transverse wave velocities of the samples were measured by ultrasonic pulse penetration method. The main frequencies of the longitudinal and transverse wave PZT transducers were 0.8 and 0.35 MHz, and the test errors of the longitudinal and transverse wave velocities were ± 1.25% and ± 2%, respectively. The confining pressure of the sample was maintained at 40 MPa (approximately equal to the effective pressure under reservoir conditions). After the dynamic elasticity test, Boolean hardness reflecting the static mechanical property of the sample was measured.
2. Petrological and geochemical characteristics of the samples
2.1. Petrological characteristics
The shale samples from the study area were classified by the three end member diagram of siliceous mineral-carbonate mineral-clay mineral[16,17]. The organic-lean samples are all from the sub-member 2 of Long1, sublayers of Long 114 and Long 113, and dominated by siliceous clay shale with a small amount of siliceous shale and mixed shale (Fig. 2a, 2b). These samples have an average siliceous mineral content of 35.7%, average clay mineral content of 51.6%, average carbonate mineral content of 2.8%, and average TOC value of 0.96%. The organic-rich samples are mainly from the sublayers of Long112 and Long111, and mainly clay siliceous shale and mixed shale with small amount of clay shale (Fig. 2c). These samples have an average clay mineral content of 42.8%, average siliceous mineral content of 42.5%, average carbonate mineral content of 12.1%, and average TOC value of 3.31%. The siliceous shale is rich in algae, radiolaria, and organic matter, and contains pyrite which indicates anoxic reducing environment (Fig. 3d). The siliceous clay shale has lower total organic carbon content, indicating that its deposition environment is oxidation-weak reduction. The organic-rich shale interval has main mineral components similar with the organic-rich shale interval in the shallow part of the Longmaxi Formation in the same study area, and is characterized by rich silicon content too.
Fig. 2.
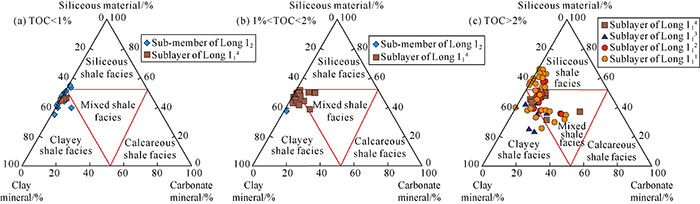
Fig. 2.
Three end member diagrams of mineral composition of shale samples.
Fig. 3.

Fig. 3.
Micro-texture and pore structure of deep shale samples from Well W106.
(a) Sublayer of Long 114, optical thin section characteristics of average quality reservoir section samples, with obvious directional arrangement of clay; (b) Sublayer of Long 113, backscattered scanning electron microscope image of average quality reservoir section sample, with obvious directional arrangement of clay; (c) Sublayer of Long 113, local enlargement of calcareous dissolution pores of average quality reservoir sample; (d) Sublayer of Long 111, optical thin section characteristics of high-quality reservoir sample; (e) Sublayer of Long 111, backscattered scanning electron microscope images of high-quality reservoir sample; (f) Sublayer of Long 111, pores and TOC characteristics of high-quality shale sample.
Pores in the deep shale samples are mainly inorganic pore (intergranular pore between clay or quartz grains, pyrite intercrystalline pore, calcite or dolomite dissolution pore and fissure pore) and organic pore, which is consistent with the samples from the medium-shallow shale section (Fig. 3). The deep shale samples from different sublayers have obvious differences in pore composition. The samples from the lean organic shale section (sub-member of Long12, sublayers of Long114 and Long113) have more inorganic pores represented by intergranular clay pores, calcite or dolomite dissolution pores, and fewer organic pores (Fig. 3b, 3c). The organic-rich shale samples (sublayers of Long112 and Long111) have equally developed organic and inorganic pores (Fig. 3e, 3f).
The samples from the organic-lean shale section and those from organic-rich shale section have wide difference in microtexture. The samples from organic-lean shale section have a directional arrangement of parallel beddings under strong compaction, and the microtexture with plastic clay particles as the support frame and rigid particles such as quartz and calcite "floating" between clay particles in directional arrangement (Fig. 3a, 3b). In these samples, the organic matter exists between clay particle pores, and the intergranular pores are in between needle-shaped clay particles of directional arrangement, and flat in shape (Fig. 3b), showing typical soft pore characteristics mechanically. In the organic-rich shale samples, there are a large number of microcrystalline quartz particles, and the quartz particles are in point and line contact, and the needle-shaped clay particles randomly fill between the microcrystalline quartz particles, and thus have weak orientation, so the microcrystalline quartz particles act as the force-bearing skeleton (Fig. 3d-3f). In these samples, organic matter mainly exists within the quartz intergranular pores, and does not act as a force-bearing frame; the intergranular pores are polygonal or triangular due to the effects of later compaction and cementation (Fig. 3f), and have the features of hard pore in mechanical property. Scanning electron microscopy analysis of typical samples from different sub-members of the deep shale layers shows that in samples from rich organic shale sections, quartz particles are in point and line contact forming a continuous rock frame, and illite and feldspar particles “suspend” in the quartz frame (Fig. 4a-4c). In contrast, the shale samples from the relatively lean organic matter section have illite particles in connection forming rock frame and rigid particles such as quartz “suspending” in the clay frame (Fig. 4d, 4e). The rock frame changes from the clay particle support of Long12 sub-member to the quartz particle support of Long111 sublayer, which is the result of the differential deposition and diagenesis of shales in different sub-members.
Fig. 4.
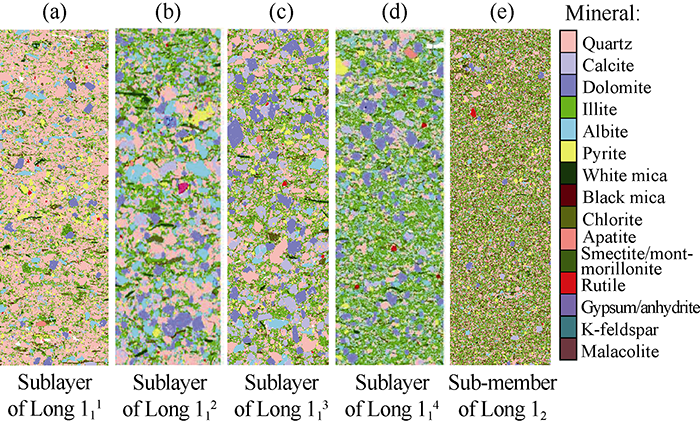
Fig. 4.
Scanning electron microscopy analysis of shale samples. Viewing area: 0.25 mm × 1.0 mm, resolution: 1.0 μm.
2.2. Geochemical characteristics
The quartz particle is not only the main kind of mineral in the shale samples, but also an important product of shale dia-genesis in different sub-members. The variation characteristics of quartz particles are important indicators for analyzing shale diagenesis processes and structure differences. The contents of major elements are of great significance for telling silicon genesis. Silicon of different origins has different petrochemical characteristics, and biogenic shale has the characteristics of high contents of SiO2, P2O5 and Fe2O3, and low contents of Al2O3, TiO2, FeO and MgO. The enrichment of Fe and Mn elements is mainly related to the precipitation of metal elements in thermal mineralization fluid, while Al is related to siliconte minerals in terrigenous debris[18,19]. There is a high positive correlation between the Al2O3 and TiO2 of shale samples in this study (Fig. 5a), indicating that the terrestrial materials are all from the same provenance. Most of the samples from the organic-rich shale section have lower contents of Al2O3 and TiO2 which are less than 9.14% and 0.45%, respectively, and no correlation between contents of Al2O3 and TiO2 and SiO2 content (Fig. 5b, 5c), but they have a clear boundary in the Al2O3 and TiO2 contents from samples of the relatively organic-lean shale section, indicating that they differ widely in silicon origin. The lower Al2O3 and TiO2 contents indicate that the terrestrial materials in the organic-rich shale section have little contribution to the silicon. The ratio of Si content to the sum of Si, Al, Fe contents is an important indicator for identifying the silicon origin. The biogenic siliceous material has the value of greater than 0.8 generally. Most of the samples from organic-rich shale members have the value higher than 0.8, which also indicates that the silicon source of the corresponding interval samples is mainly biogenic.
Fig. 5.
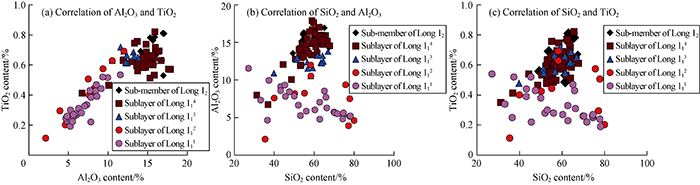
Fig. 5.
Correlation between SiO2, Al2O3 and TiO2 of deep shale samples.
Longmaxi shale samples have high silicon contents in local parts and higher ratio of Si content to Al content. On the relation diagram of Si content and Al content of the samples, the Si content above the fitting line of Si content and Al content of illite (fitted by using the Si content and Al content of Barnett clayey shale) is the excess Si, representing biogenic quartz[20]. It can be seen from Fig. 6a that the samples above the fitting line of Si content and Al content of illite are mostly organic-rich samples from Long 111 and Long112 sublayers, indicating the quartz in samples from these sublayers is mainly biogenic silicon. But it is also noted the samples from these two sublayers differ obviously in origin. Some of the samples are below the fitting line of Si content and Al content of illite, indicating the quartz in them is mainly terrigenous origin. This implies that the deep shale layers aren’t uniform in provenance (silicon source) laterally. The low quality shale samples with mainly terrigenous source quartz feature quartz grains embedded in clay matrix and skeleton of clay grains (Fig. 6b). In contrast, the high quality shale samples have biogenic quartz appearing as microcrystalline quartz chains or microcrystalline quartz aggregates and large amounts of associated algae, and feature skeleton made up of microcrystalline quartz in texture (Fig. 6c).
Fig. 6.
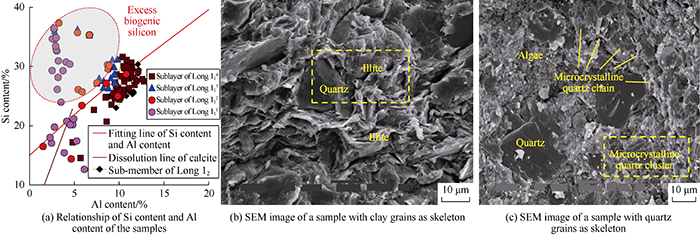
Fig. 6.
Relationship between Si content and Al content and microscopic features of typical quartz grains in the deep shale samples.
The trace element Zr can reflect the source of quartz in shale samples. Zr element mainly exists in the heavy mineral zircon, representing terrigenous debris quartz[21]. Positive correlation between trace element Zr and quartz content (SiO2) means the terrigenous debris quartz has main contribution to the silicon in the rock; while negative correlation between trace element Zr and quartz content (SiO2) means biogenic silicon has main contribution to silicon in the rock. The trace element Zr and quartz content of the shale samples tested show an upsided-down V shape on the whole (Fig. 7), namely, when the quartz content is less than 41%, the trace element Zr shows a positive correlation with quartz content, and the corresponding samples are mostly the relatively organic-lean ones and a small number of Long111 and Long112 sublayer samples, showing that these samples contain mainly terrigenous debris quartz. When the quartz content is more than 41%, the trace element Zr and quartz content show a negative correlation, and the corresponding samples are largely organic-rich shale samples, indicating these samples contain mainly biogenic quartz. Samples from Long111 sublayer alone show the upside-down V-shape on the relation diagram, reflecting even the same sublayer isn’t uniform in quartz source laterally.
Fig. 7.
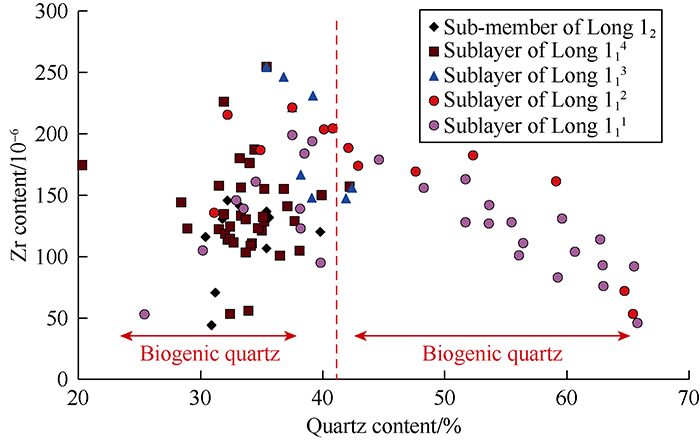
Fig. 7.
Relationship between Zr and SiO2 contents of deep shale samples.
The sources of silicon have strong impact on the diagenesis of Longmaxi Formation shale. Biological source of silicon implies the booming of red and brown algae and high level of initial productivity of the water, making the total TOC high. The decomposition of large amounts of silicon makes the sea water rich in silicon. When reaching a certain concentration, the silicon would precipitate gradually, forming large amounts of non-crystalline SiO2 of biological origin. With the increase of burial depth, the reservoir temperature rose, the non-crystalline SiO2 would experience the spontaneous cementation from opal-A to opal-CT to tight microcrystalline quartz aggregates, forming rock texture with microcrystalline quartz aggregates as force-bearing skeleton. Meanwhile the early cementation makes the rigidity of the rock skeleton increase and thus the impact of mechanical compaction reduce, so the directional arrangement of clay grains is lessened, and the primary intergranular pores can be preserved, which is good for the occurrence of organic matter. Therefore, the shale samples with mainly biogenic quartz feature rock skeleton of microcrystalline quartz grains and higher TOC. The shale layer with mainly terrigenous debris quartz didn’t experience the cementation of early biogenic silicon, so in mechanical compact stage, the clay grains would rotate and arrange directionally under the overburden pressure, forming the force-bearing skeleton. Hence the shale layer with mainly terrigenous debris quartz features rock skeleton composed of clay grains and lower TOC. The cementation in early diagenetic stage causing the formation of biogenic silicon and the subsequent diagenesis make the organic-rich shale section quite different in texture from the relatively organic-lean shale section, in other words, the biogenic silicon controls the shale texture. Also, the change of rock texture of shale in different sections (skeleton grains) would result in differences in their petrophysical properties.
3. Physical properties and petrophysical features of the shale samples
3.1. Variation patterns of physical properties
Fig. 8a shows the relationship between TOC and quartz content of the shale samples. For organic-rich shale samples, the TOC has a weak positive correlation with quartz content; while for organic-lean shale samples, the two parameters have no obvious correlation. Content of quartz, especially biogenic quartz, reflects the initial organic matter productivity of the ancient ocean, meanwhile, the biogenic quartz can cause early cementation, increasing the rigidity (compression resistance) of the sediment skeleton, so the primary intergranular pores can be preserved, increasing the preservation rate of organic matter. Out of the above reasons, the quartz content and TOC of the samples have some coupling, to be specific, samples of Long111 and Long112 sublayers have higher TOC. Due to the unevenness of the organic-rich shale section, some samples of this section also have mainly terrigenous debris quartz, so these samples have lower TOC. There is also the possibility that the formation from which the shale samples were taken was near the provenance, so quartz grains in these samples may come from mixed biogenic and terrigenous sources. Fig. 8b shows the relationship between porosity and TOC of the shale samples. It can be seen the two show a weak positive correlation. The shale samples have a porosity range of 4.0%-8.7%, and even the samples from non-reservoir section have fairly high porosity. The overpressure in the study area may have some positive effect on pore preservation. In shallow-medium depth shale samples, the organic-rich shale samples have porosity less than 5%, while relatively organic-lean shale samples have a porosity less than 2% in general. Meanwhile, for the shallow-medium depth high quality shale samples, the organic pores make a higher contribution to the total porosity, and the porosity and TOC often show an obvious positive correlation. But the inorganic pores and organic pores of the deep shale samples in this study make comparable contribution to the total porosity, so the shallow-medium depth shale samples and deep shale samples differ widely not only in porosity but also in the variation patterns of porosity versus TOC.
Fig. 8.
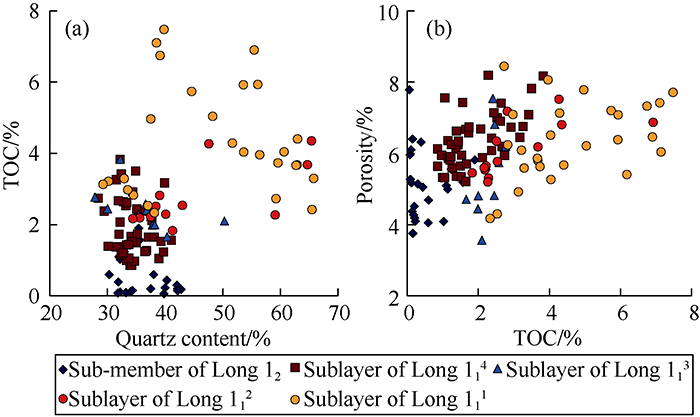
Fig. 8.
Relationships between TOC and quartz content
(a) and TOC and porosity (b) of the shale samples.
3.2. Variation pattern of elastic wave velocity
Shale reservoirs in the study area have overpressure in general. But in experiments, as the shale samples are low in permeability, during the course of pore pressure loading, the pressure would need a long time to reach balance, so the velocities of the samples were all tested under effective pressure without considering the pore pressure. Compared with the effective pressure considering pore pressure, under the effective pressure without considering pore pressure, the P-wave velocity and S-wave velocity tested would be slightly higher, equating to the case that the pore full of fluid makes the velocity increase, but this doesn’t affect the analysis of seismic elastic properties of the samples on the whole. Fig. 9 shows the relation diagram of P-wave velocity and S-wave velocity propagating perpendicular to the bedding versus quartz content of the shale samples at the effective pressure of 40 MPa. It can be seen both the velocities show an upside-down V shape with 41% of quartz content as the dividing point. When quartz content is lower than 41%, both of the velocities increase with the increase of quartz content, when the quartz content is more than 41%, both of them decrease with the increase of quartz content. Comparing Fig. 10 and Fig. 7, it can be seen that the variation pattern of velocity versus quartz content is consistent with that of Zr versus quartz content. The quartz content of 41% is the dividing point between samples with mainly terrigenous debris quartz and mainly biogenic quartz. Samples with mainly terrigenous debris quartz have clay grains as rock skeleton, while samples with mainly biogenic quartz have microcrystalline quartz as rock skeleton. The difference in texture determines the variation patterns of velocity versus quartz content of the two kinds of samples. In samples with a quartz content of less than 41%, clay grains with softer elastic property act as the rock skeleton (Fig. 3a-3c). In this situation, increase of quartz content wouldn’t change the micro-texture of the rock with clay grains as the force-bearing skeleton and rigid quartz grains “floating” in the plastic clay matrix. The softer clay grains as the carrier of elastic wave control the macroscopic dynamic elastic property of the rock, making the S-wave velocity of the sample lower (Fig. 9b). The increase of P-wave velocity and S-wave velocity with quartz content is largely the result of porosity and TOC reduction (Fig. 10a, 10b). But this decrease trend of porosity is clearly different from that in the change from pure mudstone to sandy mudstone. In the latter case, the change of porosity is caused by the difference in sorting[22], while the porosity decrease trend in the shale samples is the result of gradual reduction of dissolution pores related to calcium and TOC, correspondingly, the shale samples with low velocity often have higher calcium content and porosity, whereas the shale samples with higher velocity have lower calcium content and porosity (Fig. 10a, 10d). When the quartz content is higher than 41%, the sample features rigid quartz grains as force-bearing skeleton. In this case, the harder quartz grains as the carrier of elastic wave control the macroscopic elastic property of the rock, making this kind of sample higher in S-wave velocity (Fig. 9). For shale samples with mainly biogenic quartz, the quartz content and TOC, and TOC and porosity show positive correlations to some extent (Fig. 8). In these samples, the content of organic matter softer in elastic property and porosity increase with the increase of quartz content, making the organic-rich shale samples show a negative correlation between velocity and quartz content (Fig. 10a, 10b). As a small number of samples from the Long111 sublayer have mainly terrigenous debris quartz, the relationship of velocity and quartz content of samples from this sublayer also show an upside-down V shape. It can be seen from the above experimental results that the variation pattern of dynamic elastic property of the deep shale samples is controlled by the microscopic skeleton of the rock, while porosity and TOC are secondary factors affecting dynamic elastic property. This is also true for shallow-medium depth shale[9,10].
Fig. 9.
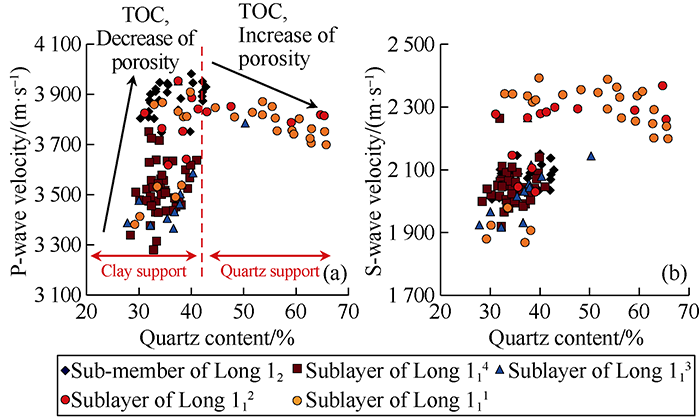
Fig. 9.
P-wave velocity
(a) and S-wave velocity (b) versus quartz content of the shale samples.
Fig. 10.
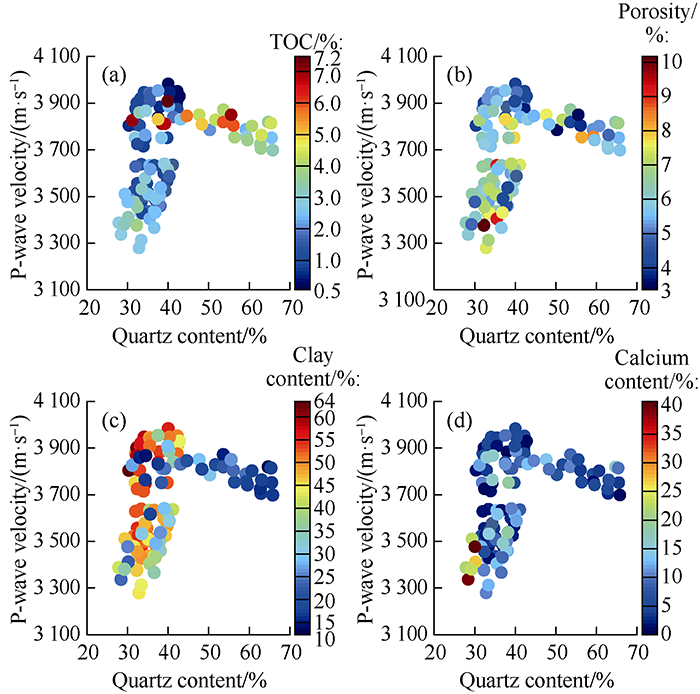
Fig. 10.
Impacts of main components and porosity of shale samples on P-wave velocity.
The velocity vs. quartz content of the deep shale samples varies in the same pattern as that of pure sandstone to sandy mudstone to muddy sandstone to pure sandstone, and is controlled by the rock texture. But they are different in the evolution model of porosity, so the deep shale samples don’t have the same continuous velocity variation simply as that of pure mudstone-sandy mudstone- muddy sandstone- pure sandstone sequence.
Fig. 11 shows the relation diagram of P-wave velocity and S-wave velocity perpendicular to bedding with porosity of the shale samples at the effective pressure of 40 MPa. It can be seen from the figure that the velocities decrease with the increase of porosity on the whole. The slopes of these plots show the features of pore structure of these samples. The P-wave velocity varies with porosity in two patterns. The curve of P-wave velocity versus porosity of relatively organic-lean shale samples show higher slope. These samples have more intergranular pores between clay grains (Fig. 3b, 3c), and affected by strong compaction and directional arrangement of clay grains. These pores often appear as soft pores with smaller aspect ratio and have similar mechanical properties as micro-fissures. Also, a small amount of these pores can make the P-wave impedance velocity drop significantly, resulting in higher slope of the P-wave versus porosity curve. In contrast, the velocity versus porosity curve of organic rich shale samples shows a smaller slope. These samples have more intergranular pores between quartz grains (Fig. 3e, 3f), these pores appear as hard pores with higher aspect ratio, and the variation of porosity has little impact on velocity, making the p-wave velocity versus porosity curve smaller slope. As the skeleton minerals of the two kinds of shale samples differ widely in shear modulus, the quartz grain has a shear modulus of 45 GPa, while clay minerals have a shear modulus of only 9 GPa[23], making the organic rich shale samples have much high S-wave velocity than the relatively organic-lean shale samples. S-wave velocity is not sensitive to pore shape, so the two kinds of samples don’t differ much in slopes of S-wave velocity versus porosity curves.
Dynamic elastic modulus and Poisson’s ratio of the shale sample can be expressed as[23]:
Fig. 11.
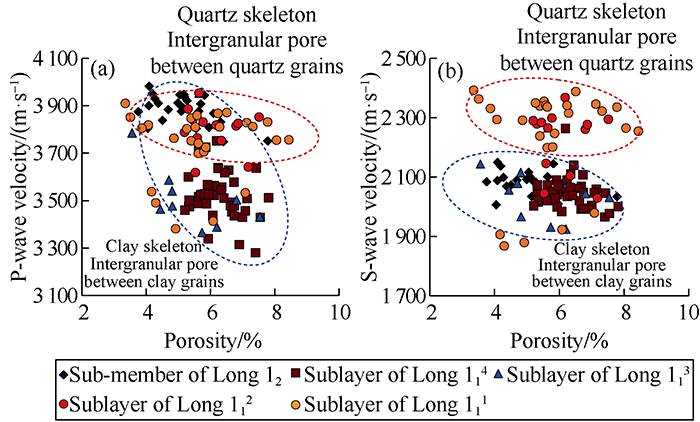
Fig. 11.
P-wave velocity
(a) and S-wave velocity versus porosity of the shale samples.
Fig. 12a shows the relation diagram of P-wave velocity and Poisson’s ratio of the shale samples under the confined pressure of 40 MPa, in the calculation, the P-wave and S-wave velocities used were the velocities of P-wave and S-wave propagating perpendicular to the bedding. In terms of P-wave impedance, the organic rich shale samples have obvious overlapping with the relatively organic-lean shale samples, so it is difficult to tell them apart by P-wave impedance alone. The organic-rich shale samples mainly feature low Poisson’s ratio (less than 0.22), reflecting the elastic property of quartz grain. The relatively organic-lean shale samples feature increase of Poisson’s ratio with the increase of P-wave impedance. These samples have clay grains as skeleton. With the increase of clay content, they decrease in total porosity, leading to increase of P-wave impedance and Poisson’s ratio. Fig. 12 shows the relation diagram of elastic modulus and Poisson’s ratio of the shale samples. The organic-rich shale samples show higher elastic modulus (larger than 30 GPa) and lower Poisson’s ratio (less than 0.22), which also reflect the elastic property of skeleton quartz grains. The deep shale and shallow shale layers in this study differ somewhat in seismic elastic property. The existent experimental results and exploration practices both show that the shallow-medium depth shale layers have lower P-wave impedance and lower Poisson’s ratio, this is mainly because shallow-medium depth organic-rich shale samples increase significantly in porosity with the increase of organic matter content, and the increase of porosity makes the P-wave impedance drop significantly, so the organic rich shale reservoir shows lower impedance. For deep shale layers, due to the contribution of inorganic pore to relatively organic-lean shale, some relatively organic- lean shale layers also show lower P-wave impedance, so organic-rich shale doesn’t have the lowest P-wave impedance.
Fig. 12.
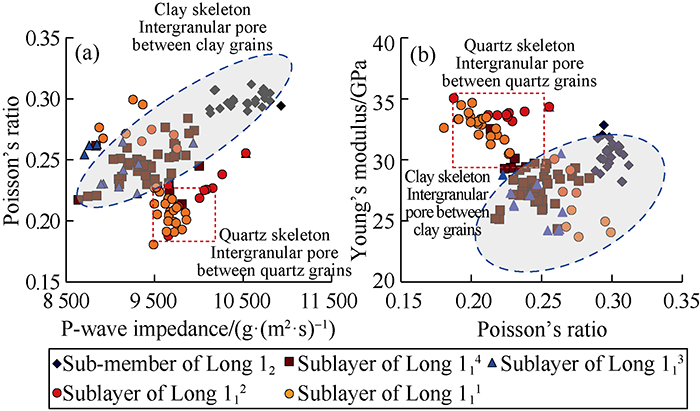
Fig. 12.
Relationship of P-wave impedance and Poisson’s ratio
(a) and elastic modulus and Poisson’s ratio of the shale samples.
3.3. Variation regularity of static rock mechanical features
Brittleness is a key index to evaluate geomechanical property and fracability of shale reservoir[24]. Two methods are commonly used to evaluate rock brittleness with logging and seismic data. One uses elastic modulus and Poisson’s ratio to calculate rock brittleness. The Poisson’s ratio reflects the initial rupture capacity of rock under stress, while the elastic modulus reflects the ability of fracture in a rock to keep its features. The rock brittleness index defined by elastic parameters is[25]:
The other method is based on the composition of brittle and plastic minerals in the rock. In this method, quartz and dolomite are taken as main brittle minerals. The rock brittleness index defined by mineral components is[26] :
Fig. 13a shows the relationships between hardness and brittleness of the samples. It can be seen the hardness has positive correlations with brittleness indexes B1 and B2, and the organic-rich samples have higher hardness and brittleness, indicating the hardness of a sample can represent its brittleness. As the force is exerted on a small area in hardness test of rock, the tested hardness is more prone to the effect of changes in local mineral components, moreover, the contribution of calcite etc to the rock brittleness and plasticity depends on the experimental conditions, so rock hardness has a higher correlation with B1 than B2.
Fig. 13.
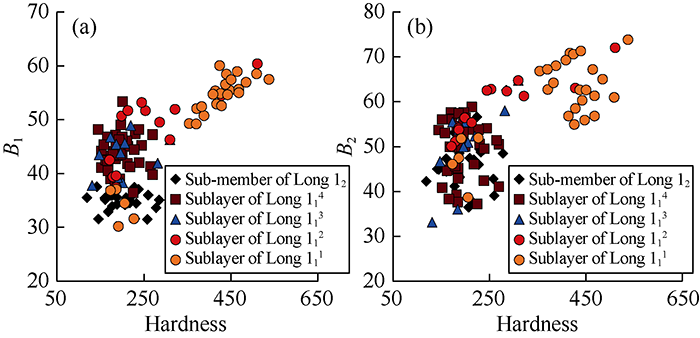
Fig. 13.
Relationships between brittleness indexes B1
(a) and B2 (b) and hardness of the shale samples.
Fig. 14 shows the relationships between hardness (brittleness) and main mineral components of the samples. As organic matter has low density and low elastic modulus, many experiments show the increase of TOC can make the shale elastic modulus decrease, shale Poisson’s ratio increase, and shale plasticity increase[27,28]. But the deep over-mature Longmaxi Formation shale samples show a positive correlation between hardness and TOC on the whole, that is especially for samples from the high quality shale section (Fig. 14a). The main cause of this phenomenon is that with the increase of TOC, the shale samples change from support frame composed of plastic clay mineral grains to that composed of brittle quartz grains. Meanwhile, the organic matter in over-mature shale sample occurs between quartz primary intergranular grains and isn’t the carrier of load, and the decrease of the hardness caused by TOC increase is smaller than the increase of hardness caused by the change of support grain elastic property, so the good quality shale samples with higher TOC are higher in hardness (brittleness) in general. Shale samples with quartz contents more than 41% have biogenic quartz as the rock skeleton, so the increase of quartz content of them means the increase of porosity and organic matter content softer mechanically (Fig. 10a, 10b), making these samples decrease in hardness (brittleness) with the increase of quartz content. This is exactly why the relationship between quartz content and hardness is similar to that between quartz content and P-wave velocity, that is, with the quartz content of 41% as the dividing point, they both show an asymmetrical upside down “V” shape (Fig. 14b). When the quartz content is lower than 41%, the hardness and quartz content have a weak positive correlation, when quartz content is higher than 41%, the hardness (brittleness) and quartz content of the samples show an obvious negative correlation (Fig. 14b). The shale samples with mainly biogenic quartz have higher hardness (brittleness) than samples with mainly terrigenous debris quartz. Meanwhile, the sample with higher quartz content isn’t necessarily higher in hardness (brittleness), in fact, the increase of terrigenous debris quartz content wouldn’t change the hardness of the sample significantly. Clay minerals are the main plastic minerals in shale[29]. As clay minerals have strong plasticity, the clay mineral content and hardness of shale samples show an obvious negative correlation. As shale samples with quartz content less than 41% have clay grains as support grains, their mechanical behavior is dependent on the characteristics of clay minerals, so the relationship of hardness and quartz content and that of hardness and clay content of these samples don’t change so significantly anymore. Similarly, calcite content and hardness of the samples have no apparent correlation, which indicates that although calcite is regarded as brittle mineral, it isn’t the main factor affecting the hardness (brittleness) of the deep Longmaxi shale samples, or the increase of hardness (brittleness) of the shale samples caused by calcite is offset by other factors.
Fig. 14.

Fig. 14.
Relationships between hardness and TOC
(a), quartz content (b), clay content (c), and calcite content (d) of the shale samples.
4. Conclusions
The shale samples from the deep section of Wufeng-Longmaxi Formation in southern Sichuan Basin are similar in mineral composition with the shale samples from the shallow section of this formation. The organic rich shale samples are mainly clay-bearing siliceous shale, while the relatively organic-lean shale samples are largely clayey shale containing silicon.
With microcrystalline quartz grains as support frame, the deep organic-rich shale samples are higher than the fitting line of Si content and Al content of illite and have negative correlation between trace element Zr content and quartz content, indicating the quartz in the samples is from biogenic silicon in early diagensis (syndepositional stage). The relatively organic-lean shale samples are lower than fitting line of Si content and Al content of illite and positive correlation between Zr content and quartz content, indicating the quartz in them is from terrigenous debris. In texture, they feature support frame of plastic clay minerals.
The variation patterns of velocity-quartz content, velocity-porosity and velocity-organic matter content of deep shale samples are mainly affected by the rock microscopic structure (elastic property of skeleton support grains), so the organic- rich shale sample and relatively organic-lean shale sample can be distinguished clearly on the relation diagram of p-wave impedance versus Poisson’s ratio and elastic modulus versus Poisson’s ratio.
The hardness of shale sample has obvious positive correlations with B1 and B2. The hardness of shale sample and brittleness are also controlled by the rock texture, making the hardness show an asymmetrical “V” shape with the increase of quartz content and have a negative correlation with clay content. For the relatively organic-lean shale samples with plastic clay minerals as support grains, the increase of terrigenous debris quartz content has little impact on their hardness and brittleness.
Nomenclature
B1—rock brittleness index defined by velocity parameter, dimensionless;
B2—rock brittleness index defined by mineral components, dimensionless;
Ed—elastic modulus used in calculating brittleness, Pa;
Vclay—clay content, %;
Vdol—content of brittle dolomite, %;
Vlime—calcite content, %;
Vp—velocity of P-wave propagating perpendicular to the bedding, m/s;
Vquar—quartz content, %;
Vs—velocity of S-wave propagating perpendicular to the bedding, m/s;
VTOC—TOC in volume, %;
ρ—density of dry sample, kg/m3;
υd—Poisson’s ratio, dimensionless.
Reference
Unconventional hydrocarbon resources in China and the prospect of exploration and development
Controlling factors on the enrichment and high productivity of shale gas in the Wufeng-Longmaxi Formations, southeastern Sichuan Basin
The potential and exploring progress of unconventional hydrocarbon resources in SINOPEC
Needs of geophysical technologies for shale gas exploration
Ultrasonic and anisotropy of hydrocarbon source rocks
DOI:10.1190/1.1443286 URL [Cited within: 1]
Ultrasonic measurement of anisotropy on the Kimmeridge Shale. Calgary: 70th Annual International Meeting,
Elastic anisotropy of shales
DOI:10.1190/1.3567264 URL [Cited within: 1]
Geomechanical and ultrasonic characterization of a Norwegian sea shale
DOI:10.1190/1.3569599 URL [Cited within: 1]
Microtexture, seismic rock physical properties and modeling of Longmaxi Formation shale
The influence of the diagenetic process on seismic
Anisotropic effective-medium modeling of the elastic properties of shales
DOI:10.1190/1.1443546 URL [Cited within: 1]
Rock physics of organic shales
DOI:10.1190/1.3567264 URL [Cited within: 1]
Rock-physics templates for clay-rich source rocks
DOI:10.1190/geo2014-0510.1 URL [Cited within: 1]
A shale rock physics model for analysis of brittleness index, mineralogy and porosity in the Barnett Shale
Estimation of anisotropy parameters for shale based on an improved rock physics model
DOI:10.1088/1742-2140/14/1/143 URL [Cited within: 1]
Lithofacies summary of the Mississippian Barnett Shale, Mitchell 2 T. P. Sims well, Wise County, Texas
DOI:10.1306/12040606053 URL [Cited within: 1]
Lithofacies and sequence stratigraphy of the Barnett Shale in east-central Fort Worth Basin, Texas
DOI:10.1306/04261110116
URL
[Cited within: 1]

Ten Barnett Shale lithofacies have been recognized in a 223-ft (68-m)-long core from Johnson County, Texas. Eight of these lithofacies match those previously identified in the main producing area of the Newark East (Barnett Shale) field in the northern part of the Fort Worth Basin, but two new lithofacies have been identified in this core, resedimented spiculitic mud-stone lithofacies and lag deposits, both of which are indicative of a relatively higher energy environment and downslope resedimentation of shallower water deposits.
The recognition of cyclical stacking patterns of the lithofacies, condensed sections (CSs), and transgressive surfaces of erosion were the keys to establishing the sequence-stratigraphic framework in these fine-grained rocks, which consists of seven stratigraphic intervals in the lower Barnett Shale and nine stratigraphic intervals in the upper Barnett Shale. Spectral gammaray uranium and thorium logs aided in this objective and are recommended for future sequence-stratigraphic studies of these and other shales.
The sequence-stratigraphic framework reveals that the lower Barnett Shale in this area was deposited mainly in a low-energy, relatively deep-water environment, somewhat far from a terrigenous source area, which probably lies to the northwest. By contrast, the upper Barnett Shale was deposited in an oxygenated shallower water environment, which had a source area from the west and southwest sides of the basin. The higher frequency of sea level fluctuation during development of the upper Barnett Shale most probably indicates periodic tectonic activity, perhaps associated with a structural high that was susceptible to sea level fluctuations. Alternatively, it could have resulted from the onset of glaciations in Gondwanaland during this time. This higher frequency may indicate that the upper Barnett is Chesterian in age, because cyclicity was higher than during the Osagean and Meramecian stages. If so, there may be more high-frequency cycles than recognized in this core.
Siliceous sponge spicules are more common in this core than in more northerly cores, so more brittle facies might prevail in the southern part of the Fort Worth Basin.
High gamma-ray log responses, which are caused by a high total organic carbon, and/or in-situ phosphate minerals are commonly found in CSs and can be used for regional correlations. However, high gamma-ray phosphatic deposits that have been resedimented to downslope positions by sediment gravity flows are an exception to the previous statement. Correlation of the Barnett stratigraphic intervals now provides a north-to-southeast stratigraphic framework along the Fort Worth Basin.
Relative hydrocarbon potential (RHP) is an organic geochemical parameter applied to this core and found to provide an indicator of marine transgressions and regressions. We recommend continued testing and use of the RHP parameter for high-frequency sequence-stratigraphic analysis of unconventional gas shales.
Environmental influences on the chemical composition of shales and clays
DOI:10.1016/0079-1946(71)90020-6 URL [Cited within: 1]
Geochemical characteristics and depositional environments of cherts and associated rocks in the Franciscan and Shimanto Terranes
DOI:10.1016/0037-0738(87)90017-0 URL [Cited within: 1]
Mississippian Barnett Formation, Fort Worth Basin, Texas: Bulk geochemical inferences and Mo-TOC constraints on the severity of hydrographic restriction
DOI:10.1016/j.chemgeo.2008.08.006 URL [Cited within: 1]
Investigating the use of sedimentary geochemical proxies for paleoenvironment interpretation of thermally mature organic-rich strata: Examples from the Devonian-Mississippian shales, Western Canadian Sedimentary Basin
DOI:10.1016/j.chemgeo.2008.10.027 URL [Cited within: 1]
Rock-physics diagnostics of depositional texture, diagenetic alterations, and reservoir heterogeneity in high porosity siliciclastic sediments and rocks: A review of selected models and suggested work flows
Indoor evaluation method for shale brittleness and improvement
A practical use of shale petrophysics for stimulation design optimization: All shale plays are not clones of the Barnett shale
Screening criteria for shale-gas systems
Maturity and impedance analysis of organic-rich shales
DOI:10.2118/123531-PA URL [Cited within: 1]
Mechanical properties of organic matter in shales mapped at the nanometer scale
DOI:10.1016/j.marpetgeo.2014.09.007 URL [Cited within: 1]
Unconventional shale-gas systems: The Mississippian Barnett Shale of north-central Texas as one model for thermogenic shale-gas assessment
DOI:10.1306/12190606068 URL [Cited within: 1]
