


Introduction
The Zananor Oilfield, located in the eastern margin of the Pre-Caspian Basin in Kazakhstan, is a large, complex carbonate oil and gas field. It is mainly developed by water flooding, and has entered the stage of rapid rise of water cut. A large number of water-flooded layers make logging interpretation difficult, and water-flooded layers in some new wells are mistakenly perforated, so the wells are water-flooded soon after put into production, seriously affecting the normal recovery of oil layers.
The water-flooded layers prevail in the middle-late stage of water flooding, and researchers in China and abroad have studied its mechanisms extensively and achieved some results. Zhao[1] proposed that different resistivity values of injected water would result in significant differences in the relationship curve between resistivity of sandstone reservoir and water saturation; when the ratio of injected water resistivity to formation water resistivity was greater than 2.5, the curve was U-shaped, while when the ratio was less than 2.5, the curve would decrease monotonously. Fan et al.[2] suggested that the relationship curve of resistivity and water saturation of core would be U-shaped or S-shaped due to the effects of irreducible water saturation, residual oil and gas saturation and the salinity difference between injected water and formation water. Tian et al.[3] found that the salinity differences between injected water and formation water would result in the relationship curves of resistivity and water saturation of a sandstone reservoir appearing in asymmetrical U, L or ∽ shapes. Yu et al.[4] developed a quantitative interpretation model for water flooded layers in the displacement process by fresh water- fresh water polymer-clean water and another quantitative interpretation model for water flooded layers in the displacement process by fresh water-fresh water polymer-waste water, and applied the two models to logging interpretation at ultra-high water cut stage. Liu et al.[5] calculated the resistivity of formation water under different temperatures and salinities, and interpreted water-flooded layers by resistivity reconstruction, with good results achieved. Yan et al.[6] simulated the relationship between water saturation and resistivity by using the digital core method, and established a model to calculate formation water cut.
Clastic rock reservoirs are the focus of researches on water flooding mechanism in China and abroad[7,8,9,10,11,12,13], but they have essential differences in diagenesis and pore structure from carbonate reservoirs. Since carbonate reservoirs have complex conductivity mechanisms, different types of carbonate reservoirs differ widely in water flooding characteristics. It is of great significance to investigate the water flooding mechanisms and establish classification standards for water flooding levels of different types of carbonate reservoirs for middle- late stage development of these reservoirs. The carbonate reservoirs in the Zananor Oilfield, Kazakhstan is porous-fractured reservoirs characterized by the coexistence of dissolution pores and karst caves, strong reservoir heterogeneity and a complex reservoir type. This paper studies the water flooding mechanisms of these representative carbonate reservoirs.
1. Geological survey of the study area
The Zananor Oilfield is located in the eastern part of the Pre-Caspian Basin, where carbonate reservoirs (referred to as KT-II reservoirs) occur in the lower sub-stage of the Middle Carboniferous Moscovian Stage and Bashkirian and Lower Carboniferous. In this paper, the KT-II reservoirs are taken as the study reservoirs, with an average porosity of 10.6% and an average permeability of 38.3×10⁻³ μm2. The reservoirs were put into production in 1988, fully developed by water injection in 1992, started to be infilled and adjusted in 2005, and is now in the middle-late stage of development. Its composite water content is 42%.
The KT-II reservoirs have many types of pores, mainly intergranular (dissolved) pores, coelomic pores and intragranular pores, and a small amount of karst caves; multiple types of fractures, including stylolite, tectonic fracture and diagenetic fractures. Based on core analysis, Zhao Lun et al. classified the target reservoirs as porous, fractured, porous-fractured and composite[14].
2. Experiment and principle
2.1. Experimental design
The equipment: The equipment mainly includes core displacement device, resistivity measurement device, and centrifuge. Core displacement and resistivity measurement were done synchronously in this experiment (Fig. 1), and the core resistivity was measured by the QuadTech 1715 LCR Digibridge. In order to make the oil or water in the core with fractures fully displaced in the oil displacing water and the late stage of water displacing oil experiments, URC-628 Ultra Rock Centrifuge (Fig. 2) was used, and the experiments were controlled by changing the type of rotor and rotating speed. High-speed digital camera was used to take continuous images of liquid interface in oil displacing water sample cup and water flooding sample cup when the core sample was rotated under high-intensity continuous light source, and then the output was calculated.
Fig. 1.
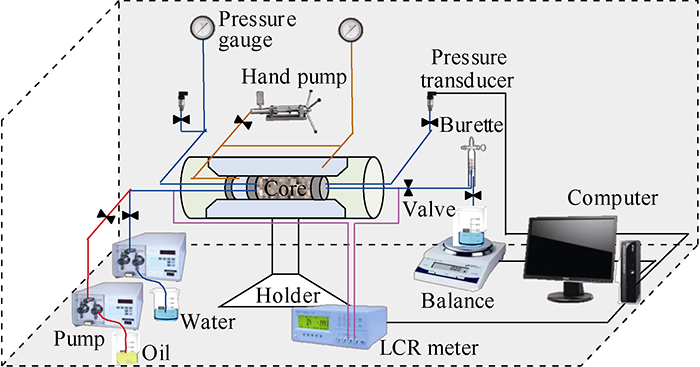
Fig. 1.
Schematic diagram of joint core displacement and resistivity measurement system.
Fig. 2.
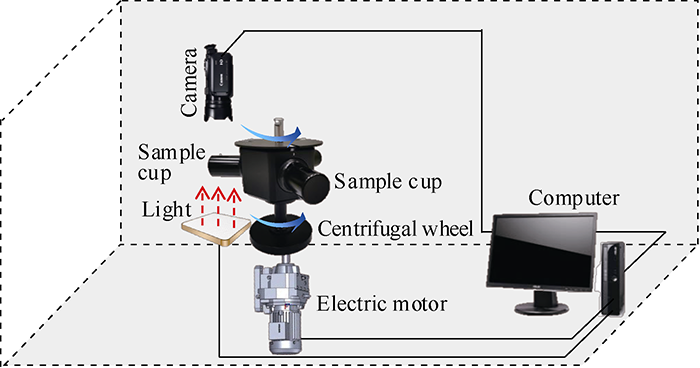
Fig. 2.
Schematic diagram of URC-628 ultra rock centrifuge.
Experimental core: Core samples were taken from the carbonate rocks in the KT-II reservoirs of the Zananor Oilfield, which were porous, fractured, porous-fractured or composite (Fig. 3). Fractured and porous-fractured samples showed natural fractures, while composite samples had artificial fractures. Core parameters are shown in Table 1.
Fig. 3.
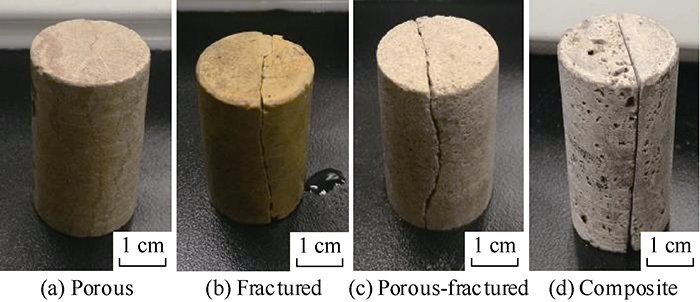
Fig. 3.
Photos of different types of core samples.
Table 1 Basic data of the core samples.
| Core type | Length/cm | Diameter/cm | Porosity/% |
|---|---|---|---|
| Porous | 4.386 | 2.463 | 14.663 |
| Fractured | 3.969 | 2.527 | 4.878 |
| Porous-fractured | 4.110 | 2.520 | 12.542 |
| Composite | 5.354 | 2.522 | 8.249 |
Procedures of porous core experiment: (1) The core sample was washed to remove oil and salt, dried, and then had porosity measured; (2) it was vacuumized and saturated with equivalent formation water of 80 000 mg/L in salinity; (3) it was loaded into the holder, and displaced with white oil until saturation, then the water yield and resistivity were measured, and the irreducible water saturation was calculated; (4) the oil-saturated core sample was displaced by simulated formation water with the salinity of 500 mg/L, the core resistivity and oil and water production at different water saturations were measured and calculated until no oil was discharged anymore; (5) steps (1)-(3) were repeated, and step (4) was repeated by using waters of different salinities (4000, 40 000 and 80 000 mg/L).
Experimental procedures for the cores with fractures: (1) same as Step (1) above; (2) same as Step (2) above; (3) the water-saturated core was put into the oil-displacing-water sample cup of the centrifuge, the sample cup was filled with white oil, and put into the centrifuge together with the rotor to start the experiment, the free water in the core was displaced out by using the oil-water density difference to get the oil-saturated core containing only irreducible water, the volume of displaced water from the core was measured and the irreducible water saturation of the core was calculated; (4) the resistivity of the oil-saturated core was measured with a digital bridge; (5) this step is the same as Step (4) in the above experiment, but took a very short time due to the high permeability of fractures. (6) the core sample was taken out from the core-holder and put into the water displacing oil sample cup, the sample cup was filled with formation water of 500 mg/L in salinity, and the white oil in the core was displaced by using a reverse rotor in the centrifuge; by controlling the rotating speed, the centrifugation was stopped when white oil production increased by 0.05 mL, the water saturation of the core at each time was calculated, and the resistivity of the core was measured; (7) Step (6) was repeated, by increasing the rotation speed, the core resistivity at different water saturations were measured until no oil was displaced out anymore; (8) steps (2)-(4) were repeated, and steps (5)-(7) were repeated by using formation waters with different salinities (4 000, 40 000 and 80 000 mg/L).
2.2. Principle of oil-water two phase displacement by centrifugal method
Because of high permeability channels in fractured core, the conventional displacement experiment with core-holder doesn’t work well, so centrifugation was adopted in the stage of oil displacing water to reach irreducible water and the late stage of water displacing oil.
The core with fractures was saturated with formation water of 80 000 mg/L in salinity, and put into the oil displacing water sample cup. Then the sample cup was filled with white oil (Fig. 4a) and put into the centrifuge together with the rotor (the sample cup was placed horizontally and the rotor rotated in the horizontal plane). As the rotation speed of centrifuge rotor increased, the movable water in the core moved away from the rotor center and flowed out of the core, while white oil filled the pore space to reach the goal of displacing water with oil (Fig. 4b). Since water is denser than oil, water droplets in the sample cup moved from the rotor center to the bottom of the cup under centrifugal force (Fig. 4c), and the oil-water contact was clear and perpendicular to the horizontal plane (Fig. 4d). When no water was produced at increasing rotation speed, the core was deemed to have been saturated with oil, and the experiment ended. The oil-water contact was collected in real time to calculate the volume of produced water and irreducible water saturation.
Fig. 4.
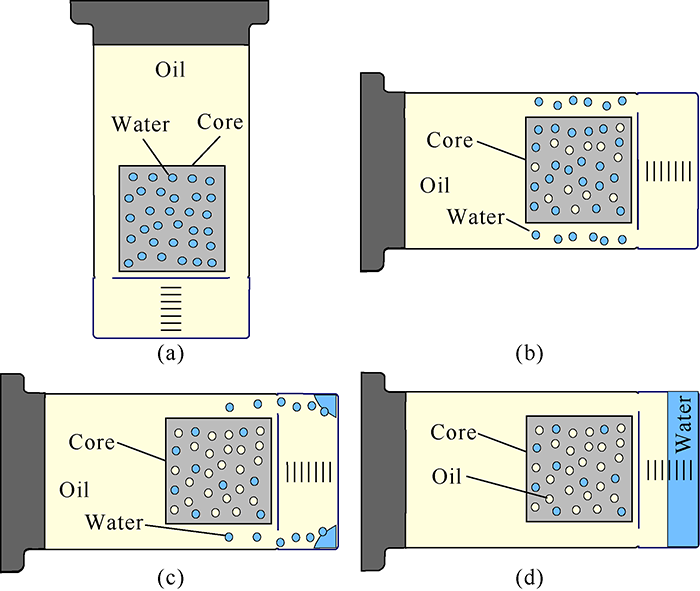
Fig. 4.
Schematic diagram of oil displacing water by the centrifugal method.
After the fractured core was saturated with oil, it was put into the core-holder and formation waters of different Salinities were used to displace the oil in the core, and the core resistivities at different water saturations were measured. In the experiment, the white oil in the fracture was quickly displaced by water, a low resistance channel was formed at both ends of the core, and the core resistivity dropped sharply. When no white oil was produced anymore and the volume of injected water reached 20 times the pore volume, the water displacing oil in the core-holder ended. Due to the high permeability of fractures, some movable oil in the matrix pores and karst caves hadn’t been displaced. Therefore, a centrifugal process was conducted to displace oil by water further.
The core was put into the water displacing oil cup, the cup was filled with injection water (the liquid interface was within the measurement range) (Fig. 5a), and then put into the centrifuge together with the rotor (the sample cup was placed horizontally and the rotor rotated in the horizontal plane) to start the experiment. Under the action of centrifugal force, water flowed into the core to displace the small amount of movable oil under the density difference between water and oil, and water migrated away from the rotor center to displace the white oil out of the core (Fig. 5b). Under the dual action of centrifugal force and density difference, the white oil moved and gathered near the rotor center (Fig. 5c), forming a clear oil-water contact perpendicular to the horizontal plane (Fig. 5d). The position of the oil-water contact was recorded in real time. Centrifugation was stopped when white oil yield increased by 0.05 mL, then the water saturation was worked out, and the core was taken out to measure resistivity. Subsequently, the core was placed again in the centrifuge, the rotation speed was gradually increased, and the operations above were repeated to get the core resistivity values at different water saturations. When no white oil was produced anymore after increasing the rotation speed, it was deemed that the recoverable white oil in the core was totally extracted, and the experiment ended.
Fig. 5.
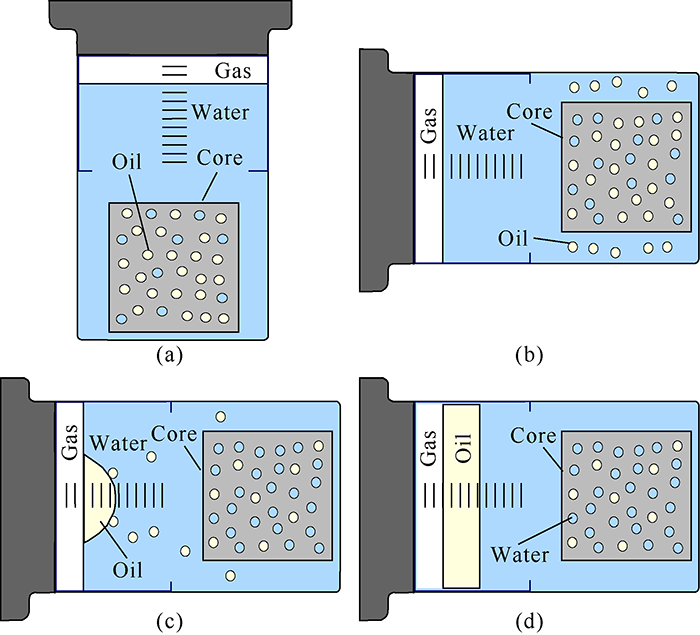
Fig. 5.
Schematic diagram of water displacing oil by centrifugal method.
2.3. Influence of injected water on electrical parameters
Tian et al.[3] argued that during the injection of fresh water, after mixing with the injected water, the original formation water continuously desalinated and finally was displaced out of the formation, until it reached the salinity of the injected water. Two solutions with different salinities affect the resistivity of the mixed liquid by conduction in parallel. The resistivity of the mixed liquid can be expressed as:
Fig. 6 is a theoretical relationship curves between resistivity and water saturation of mixed liquid when fresh waters of different resistivity values are injected into formation water, at the formation water resistivity of 1 Ω•m. It can be seen from the figure the increase of water saturation had little effect on the resistivity of the mixed liquid in the initial stage of water flooding; when water was discharged from the core outlet, the resistivity of the mixing liquid rose rapidly as the water satu-ration increased. When the original formation water was totally displaced by the injected water, the resistivity of the mixing liquid wasn’t affected by the change of water saturation anymore and was equal to that of the injected water. This shows that the resistivity and injection degree of injected water have major effects on the resistivity of the mixing liquid.
Fig. 6.
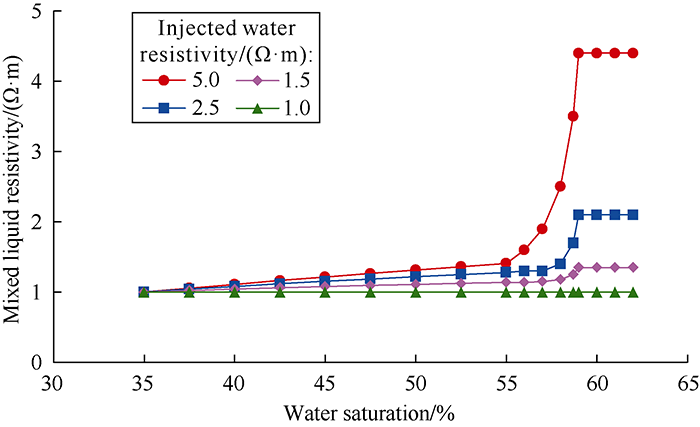
Fig. 6.
Resistivity curves of mixed liquid when fresh waters of different resistivities are injected.
3. Electrical response mechanisms of water flooded layer
Oil-saturated core containing formation water of 80 000 mg/L in salinity was displaced by injected waters with the salinity of 500, 4000, 40 000 and 80 000 mg/L, respectively, to get relationship curves between resistivity and water saturation at different injection water salinities in different types of cores (Fig. 7). It can be seen that the curves have significant differences.
Fig. 7.
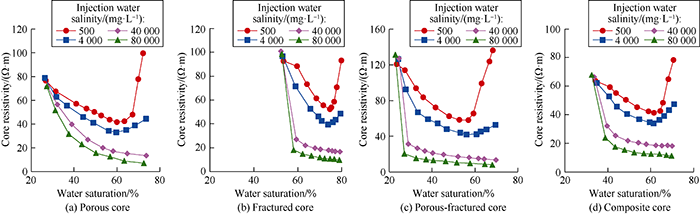
Fig. 7.
Relationship curves between water saturation and resistivity of different types of reservoirs.
(1) Porous core (Fig. 7a): When low salinity water (with a salinity less than or equal to 4000 mg/L) was injected, the core resistivity first decreased and then increased with the increase of water saturation. Thus, the curve is U-shaped, and the lower the salinity, the more obvious the U-shape is. This is because the injection of fresh water in the initial stage made the conductive media in pores increase and thus the resistivity of the core decrease. With the rise of water saturation, oil displaced by injected water increased and the resistivity of the core decreased. When the water saturation exceeded the critical value (the water saturation at inflection point), the effect of formation water desalination outperformed the effect of water displacing oil. Then as the salinity of the fresh water decreased, the core resistivity increased. In the case that the injected water had high salinity (greater than 4000 mg/L), the core resistivity decreased with the increase of water saturation in the initial displacement stage, but the higher the salinity of injected water, the weaker the desalination of formation water was when more fresh water was injected. After the water saturation exceeded the critical value, the core resistivity increased more and more slowly. There was even no critical value to reflect the effect of desalinization of formation water. And the curves are L-shaped.
(2) Fractured core (Fig. 7b): This kind of core has poor matrix permeability, strong heterogeneity, fractures as both reservoir space and seepage channels, and high irreducible water saturation. When low salinity water was injected, the water displaced the white oil in the fractures first. With more water injected, the core resistivity decreased in the initial stage of water flooding. In the middle and late stages of water flooding, when water saturation exceeded the critical value, the desalinated formation water played a leading role in the electrically conductive paths, the core resistivity increased, and the curve is U-shaped. When high salinity water was injected, it quickly reached the core outlet through fractures in the initial stage, forming a low resistance path, and the core resistivity dropped rapidly. In the middle and late stages of water flooding, desalination of formation water was weak, so the core resistivity decreased slowly, and the curve was L-shaped too. Compared with porous cores, fractured cores have higher irreducible water saturation and lower residual oil saturation, and their curve showed a right shift from that of porous cores.
(3) Porous-fractured core (Fig. 7c): Matrix pores and fractures are the main reservoir spaces and seepage channels, and the fractures have significantly higher permeability than the matrix pores. When low salinity water was injected, the curve was still U-shaped, and when high salinity water was injected, the curve was still L-shaped. As this core had matrix pore volume larger than that of the fractured core but smaller than that of the porous core, so its curve was different in position from the other two. The porous-fractured core had lower irreducible water saturation than the fractured core, experienced basically the same residual oil saturation as that of porous core, and showed a right shift from fractured core.
(4) Composite core (Fig. 7d): This kind of core has pores, fractures and caves, and higher permeability than the porous core. Its water flooding characteristics are the integration of those in porous, fractured and porous-fractured cores. When low salinity water was injected, the curve was U-shaped while it was L-shaped in case that high salinity water was injected. Its curve was located between that of fractured core and that of porous-fractured core.
4. Classification of water flooding levels of carbonate reservoirs
4.1. Calculation of relative permeability and water cut of different types of reservoirs
References [15-17] present a mathematical model for calculating oil-water relative permeability of porous reservoirs by using resistivity, which has been verified in reservoirs of Berea sandstone, argillaceous sandstone and carbonate with good homogeneity. In the modified Li model[15,16,17], the water-phase relative permeability is calculated by:
The oil-phase relative permeability is calculated by:
The standardized water saturation is:
The relationships between water cut and ratio of oil relative permeability to water relative permeability (Fig. 8) of the four types of cores were drawn using the core analysis data (including water cut data) of the relative permeability experiment done during the early exploration in the study area. Then the data points were fitted, and it is found the data points are in good agreement with hyperbola, with correlation coefficients of 0.999 9. The relational expression is shown in Equation (7):
Fig. 8.
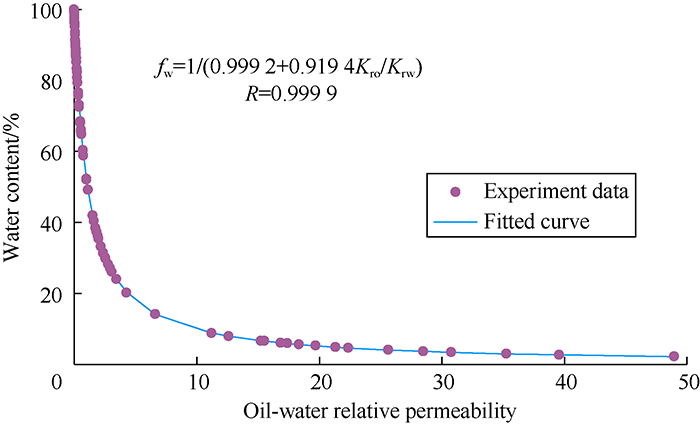
Fig. 8.
Relationship between water cut and ratio of oil-water relative permeability.
The relationship curves between water saturation and water cut of different types of reservoirs were calculated and plotted according to formulas (2)-(7) and the experimental data of water flooding with injection water of 80 000 mg/L in salinity (Fig. 9). It should be noted that experimental data of oil displacement with the water of 80 000 mg/L in salinity was used to calculate the relative permeability curve based on the resistivity curve, as the salinity of the injected water in this experiment was completely consistent with that of the original formation water, the original state of the core would not change due to the difference of salinity between injected water and formation water. It can be seen from the figure: (1) The porous reservoir had slow increase of water cut (Fig. 9a) at the initial stage of water flooding, increase of water cut became faster after water breakthrough, and water cut approaching 100% at the late stage. (2) The fractured reservoir (Fig. 9b) had water breakthrough shortly after water flooding began and rapid rise of water cut to 100% after water breakthrough. Because this kind of reservoir has small reservoir space volume, high permeability of seepage channels, and fast displacement speed. (3) The porous-fractured reservoir had water cut (Fig. 9c) rising faster than that of porous reservoir but slower than that of fractured reservoir at the initial stage of water breakthrough, and had a short slow increase section of water cut. In the late stage, the oil in matrix pores was slowly displaced, and the water cut gradually approached 100%. (4) The water cut curve of the composite reservoir (Fig. 9d) showed the change characteristics of the above three reservoirs. Its water cut rose slowly in the initial stage of water breakthrough, had a short flat section, rose rapidly in the middle stage, and gradually approached 100% in the late stage.
Fig. 9.
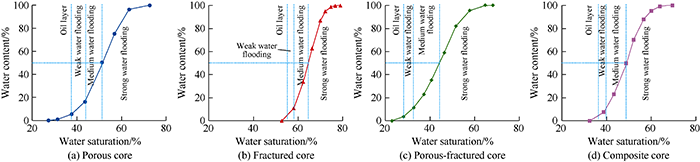
Fig. 9.
Relationship curves between water saturation and water cut of different types of reservoirs.
4.2. Classification of water flooding levels in different types of reservoirs
As per the classification criterion of water flooding levels in China Oil & Gas Industry Standards[20], the clastic reservoir with water cut less than or equal to 10% is oil layer, between 10% and 40% is weakly water flooded layer, between 40% and 80% is medium water-flooded layer, between 80% and 90% is strongly water-flooded layer, and greater than or equal to 90% is extremely strongly water-flooded layer. Minor adjustments will be made for oilfields according to actual conditions. But to date, there is no classification standard established for the interpretation of water flooded carbonate layers.
According to the experimental data of oil-water two-phase relative permeability of 16 porous core samples from the KT-II carbonate reservoirs of Zananor Oilfield (Table 2), the reservoirs have an irreducible water saturation range between 24% and 44%, a residual oil saturation range between 26% and 36%, a maximum water-phase relative permeability range between 0.11 and 0.32, and a water saturation range at equal - permeability point between 49.0% and 57.4%.
Table 2 Basic parameters of porous reservoir samples from KT-II.
| Core No. | Core length/cm | Core diameter/cm | Porosity/ % | Gas permeability/ 10-3 μm2 | Irreducible water saturation/% | Residual oil saturation/% | Water saturation at equal - permeability point/% | Maximum water relative permeability |
|---|---|---|---|---|---|---|---|---|
| 1 | 5.00 | 2.45 | 6.8 | 0.09 | 37.43 | 35.67 | 55.5 | 0.108 8 |
| 2 | 5.33 | 2.44 | 15.8 | 121.00 | 28.87 | 26.93 | 49.0 | 0.317 5 |
| 3 | 5.06 | 2.48 | 10.0 | 0.96 | 42.41 | 30.03 | 59.2 | 0.160 6 |
| 4 | 4.72 | 2.43 | 15.5 | 33.60 | 30.70 | 38.04 | 49.5 | 0.215 2 |
| 5 | 5.00 | 2.44 | 8.3 | 2.64 | 42.29 | 27.24 | 56.2 | 0.239 0 |
| 6 | 4.73 | 2.43 | 10.6 | 0.54 | 35.72 | 32.14 | 54.2 | 0.170 6 |
| 7 | 5.04 | 2.43 | 16.0 | 102.00 | 24.87 | 30.05 | 53.2 | 0.203 7 |
| 8 | 4.40 | 2.44 | 13.9 | 10.50 | 42.46 | 27.55 | 56.1 | 0.266 2 |
| 9 | 4.79 | 2.48 | 7.6 | 0.20 | 43.01 | 33.05 | 56.8 | 0.132 5 |
| 10 | 4.91 | 2.44 | 12.2 | 23.50 | 34.00 | 30.33 | 53.5 | 0.208 8 |
| 11 | 5.22 | 2.44 | 14.2 | 51.60 | 30.84 | 31.12 | 49.9 | 0.300 6 |
| 12 | 5.08 | 2.43 | 10.3 | 19.20 | 38.19 | 32.14 | 52.4 | 0.205 7 |
| 13 | 4.85 | 2.45 | 8.6 | 0.36 | 39.19 | 29.39 | 56.8 | 0.159 8 |
| 14 | 4.09 | 2.43 | 7.8 | 1.64 | 32.20 | 31.87 | 52.2 | 0.177 4 |
| 15 | 5.00 | 2.45 | 7.9 | 0.60 | 38.10 | 30.68 | 57.4 | 0.126 7 |
| 16 | 5.16 | 2.43 | 12.5 | 2.73 | 36.51 | 28.07 | 57.2 | 0.185 4 |
Fig. 10 shows the oil relative permeability values of the 16 porous core samples at different water cuts. It can be seen that when fw≤5%, the porous core samples have oil relative permeability above 0.22 and very low water relative permeability, so it can be regarded as pure oil layer. When 5%<fw≤20%, the porous reservoirs have an obvious drop in oil relative permeability to 0.13-0.45, which is weakly water flooded layer. When 20%<fw≤50%, the oil relative permeability values of the porous core samples drop significantly to 0.04-0.26, representing the moderately water flooded layer. When 50%<fw≤ 80%, the oil relative permeability values of the core samples drop to 0.01-0.04, with no obvious variation from the above water cut range. The water cut of 50% can be regarded as the boundary between moderate water flooding and strong water flooding, based on the distribution of equal-permeability points.
Fig. 10.
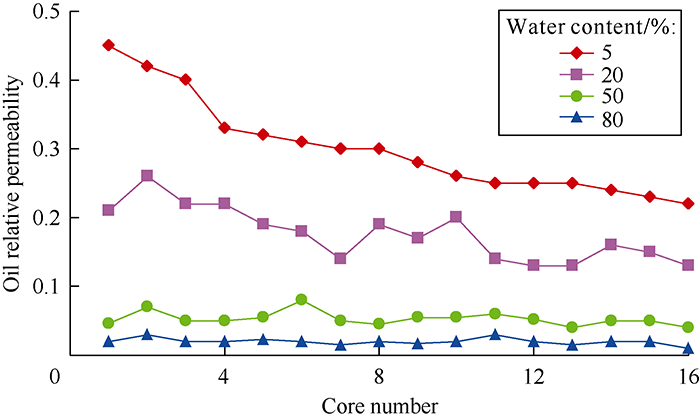
Fig. 10.
Oil relative permeability of 16 reservoir samples at different water cuts.
The water-flooding levels of different types of reservoirs are classified mainly according to water cut (Fig. 9). Since curves between water cut and water saturation of different types of reservoirs all have three inflection points, the 3 inflection points can be taken as the basis for classifying oil layer, weakly water flooded layer, moderately water flooded layer and strongly water flooded layer, thus water-flooding level classification standard for complex carbonate reservoirs has been established (Table 3). Compared with clastic reservoirs, the lower limit values of water cut for all levels of water- flooded layers decrease significantly in this standard.
Table 3 Classification standard for water flooding levels of different types of carbonate reservoirs.
| Reservoir type | Water cut /% | |||
|---|---|---|---|---|
| Oil layer | Weakly water-flooded | Moderately water-flooded | Strongly water-flooded | |
| Porous | fw≤5% | 5%<fw≤20% | 20%<fw≤50% | fw>50% |
| Fractured Porous-fractured Composite | fw≤5% | 5%<fw≤10% | 10%<fw≤50% | fw>50% |
5. Conclusions
The salinity of injected water is the main factor affecting resistivity of carbonate reservoir. When low salinity water (fresh water) is injected, the relationship curve of resistivity and water saturation is U-shaped. When high salinity water (salt water) is injected, the curve is L-shaped.
The classification criteria for water flooding levels of carbonate reservoirs are as follows: (1) For porous reservoirs, the reservoir with water cut less than or equal to 5% is oil layer, 5%-20% is weakly water-flooded layer, 20%-50% is moderately water-flooded layer, and greater than or equal to 50% is strongly water-flooded layer. (2) For fractured, porous-fractured and composite types of reservoirs, the reservoir with water cut less than or equal to 5% is oil layer, 5%-10% is weakly water-flooded layer, 10%-50% is moderately water-flooded layer, and larger than or equal to 50% is strongly water- flooded layer.
Nomenclature
fw—water cut, %;
Kro—oil relative permeability, dimensionless;
Krw—water relative permeability, dimensionless;
R—correlation coefficient, dimensionless;
Ror—reservoir resistivity at residual oil saturation, Ω•m;
Rt—reservoir resistivity at water saturation of Sw, Ω•m;
Rvis—oil/water viscosity ratio, dimensionless;
Rw1—original formation water resistivity, Ω•m;
Rw2—injected water resistivity, Ω•m;
Rwz—mixed liquid resistivity, Ω•m;
Sor—residual oil saturation, %;
Sw—water saturation, %;
Swi—irreducible water saturation, %;
Sw*—normalized water saturation, dimensionless;
V1—original formation water volume, cm3;
V2—injected water volume, cm3.
Reference
Experiment research on the rock resistivity properties of watered-out formation
Experimental study on rock resistivity of Liudong oilfield and digital analogy
Logging attributes and mechanism study of grit water-flooding reservoir
Characteristics of resistivity log response of oil layers under polymer flooding
DOI:10.1007/s11770-012-0329-1
URL
[Cited within: 1]

Resistivity log responses are different when the oil layers is filled by a polymer solution or water and it seriously affects the log interpretation of the water flooded layer. In this paper, we first analyze the electrical properties of the polymer solution. Then, according to the different processes for polymer flooding the reservoir, we perform rock resistivity experiments and analyze the rock resistivity variations in different displacement phases. We also compare the resistivity log responses of oil layers filled with the polymer solution to those filled with water. The results show that when displacing the oil-bearing core by different polymers, the resistivity changes monotonously decrease and show either "W" type or "S" type. The resistivity log responses are weak when displacing water and there is no flooded show if the oil layer is injected by a fresh water polymer solution. If the oil layer is injected by a sewage polymer solution, the resistivity log response has similar characteristic as a polluted water flooded layer.
Evaluation on an original resistivity inversion method of water flooding a conglomerate reservoir based on petrophysical analysis
DOI:10.1088/1742-2132/12/5/780 URL [Cited within: 1]
A novel method for estimation of remaining oil saturations in water-flooded layers
Quantitative evaluation methods for water-flooded layers of conglomerate reservoir based on well logging data
DOI:10.1007/s12182-010-0092-y URL [Cited within: 1]
Water flooding performance prediction in layered reservoirs using improved capacitance-resistive model
DOI:10.1016/j.petrol.2013.06.006 URL [Cited within: 1]
A numerical technique for an accurate determination of formation resistivity factor using FR-RO overlays method
DOI:10.1007/s12517-014-1311-4 URL [Cited within: 1]
A new model between dynamic and static elastic parameters of shale based on experimental studies
DOI:10.1007/s12517-019-4777-2 URL [Cited within: 1]
Influences of delta sandstone architecture on waterflooding sweep characteristics: A case study of layer J-Ⅱ of Kumkol South oilfield in South Turgay Basin, Kazakstan
Improving oil recovery from shale oil reservoirs using cyclic cold carbon dioxide injection: An experimental study
Origin of low resistivity pays and forecasting of favorable prospecting areas
Recognition method of carbonate reservoir water-flooded zone using resistivity curve reconstruction based on reservoir classification
A semianalytical method to calculate relative permeability from resistivity well logs
Comparison of methods to calculate relative permeability from capillary pressure in consolidated water-wet porous media
Fractal modeling of capillary pressure curves for the Geysers rocks
DOI:10.1016/j.geothermics.2006.02.001 URL [Cited within: 1]
A viscous coupling model for relative permeabilities in fractures
Study on two-phase flow of oil-water and oil-gas in fractured-vuggy carbonate reservoir
Specification for logging data processing and interpreting of water flooded zone: SY/T 6178—2017
