


Introduction
With micro-nano pores and fractures, slits and joints as storage space, shale reservoirs usually have low porosity and no natural production capacity after drilling, and need to be stimulated by certain technical measures to obtain industrial gas flow[1,2,3,4]. As a key technology for shale gas reservoir development[5,6,7], massive hydraulic fracturing technique utilizes a large quantity of fluid and high pumping rate to maximize stimulated reservoir volume, strengthen the control of fracture system on reservoir and minimize the seepage distance of gas to the hydraulic fractures. In recent years, slick water has become the mainstream fracturing fluid in shale gas fracturing[8]. As the key additive, a drag reducer determines the performance and application effect of slick water system[9]. Some studies showed that a drag reducer could easily adsorb on the shale surface, and further retain on fracture surfaces, in small-scale pore throats and micro-fractures, causing shrinking or even plugging of oil and gas flow passages, and thus great reduction of matrix permeability, which would seriously affect the hydraulic fracturing effect[10]. Meanwhile, the fresh water resource in China is becoming scarce, so produced water is commonly reused to prepare slick water to reduce environmental pollution and minimize waste of fresh water and water cost[11,12]. Unfortunately, the produced water often has high salinity. Thus, the need for a high salt tolerance and low damage drag reducer is becoming increasingly pressing and has become the current focus in the study of slick water fracturing fluid technique[13].
In this study, a high salt tolerance-low adsorption drag reducer has been produced by inverse emulsion polymerization based on acrylamide by introducing polar cation fragments, to meet the demand of massive slick water fracturing in shale gas reservoir.
1. Design of a high salt tolerance and low adsorption drag reducer
Currently, polyacrylamide-based drag reducers are commonly used to prepare slick water. The chains of polymer with a certain viscosity stretch freely in fluid of pipeline, to absorb the energy between the thin layers, minimize the generation of turbulent flow near the pipeline wall and finally achieve the purpose of friction reduction[14,15]. As the shale hydraulic fracturing increases in scale, the demand for fresh water in fracturing increases[16]. To meet this increasing demand, produced water is often reused, but produced water often has complex composition and high salinity. The produced water of some oilfield has salinity of up to 200 000 to 300 000 mg/L. Under high salinity, the chains of drag reducer are likely to coil and precipitate due to shielding effect of metal cations to functional groups, thus the drag reducer would drop significantly in or even completely lose friction reduction capability. Previous studies showed that the salt resistance property of drag reducer could be effectively improved by introducing strong electrolyte groups, like sulfonates to monomers[9,17] or betaine amphiphilic ion groups[18]. However, polyacrylamide drag reducers, like anionic polyacrylamide, easily generate hydrogen bond with oxygen-containing groups in shale and adsorb on fracture walls and matrix, narrowing or even blocking oil and gas flow channels and seriously impairing the effect of fracturing. Guo et al.[19] found that the adsorption of polymer on the matrix surface could be greatly reduced by adding hydrogen bonding destroy agents. However, this kind of agents not only weaken the interactions between polymer and matrix surfaces, but also reduced interchain and intrachain interactions of drag reducer to undermine its friction reduction performance and proppant-carrying capacity. If non-covalent parts are used to replace part of covalent parts by chemically modifying the functional groups in polymer chains, to enhance the non-covalent interaction between chain segments and reduce the possibility of forming hydrogen bonds between the polymer and shale reservoir polarity sites, adsorption damage can be effectively reduced. Although the bond energy of non-covalent interaction is much less than that of covalent interaction, the synergistic effect of multiple non-covalent bonds may form stable and reversible physical crosslinking, and further microscopic aggregation regions of non-covalent bond cross linking, which will effectively enhance the stability of system structure and endow the system with tolerance to extreme environment[20].
In this study, we intended to modify the inverse-emulsion drag reducer, according to non-covalent enhancement principle, and we introduced polar cation segments to enhance the interaction between the chains and give the drag reducer a more stable and orderly network structure[20], and minimize the polarity sites on the chains, so that the possibility of forming hydrogen bonds between polymers and shale reservoir polarity sites could be greatly reduced[21], and the adsorption of polymer on the rock surfaces could be reduced. Meanwhile, polar cation segments were used to enhance the repelling effect between fixed ions and polymer chains, which would further affect the behavior of polyelectrolyte in polymer[22] and reduce the shielding effect of metal cation to the functional groups. As a result, this novel drag reducer could keep the chains in a stretching state under the condition of high salinity, and maintained its friction reduction property.
2. Experiment
2.1. Materials and apparatus
The experimental materials including acrylamide (AM), N,N'-dimethylacrylamide (DMA), neopentylacrylate (NPA), methacroylcholine chloride (DMC), acryloyloxyethyltrimethyl ammonium chloride (DAC), butanol, white oil, emulsifier, initiator, phase converter, inverse-emulsion drag reducer, were all purchased from Sichuan Chuanqing Downhole Service Company Co. LTD. Sodium chloride, calcium chloride, potassium chloride, magnesium chloride, methanol, all of analytical grade, were purchased from Chengdu Kelong Chemical Reagent Factory. The shale cores and rock powder were collected from Longmaxi Formation outcrop. High purity nitrogen and deionized water were used to prepare the slick water system.
The experimental instruments included: Ubbelohde viscometer of 0.8-0.9 mm in diameter produced by the Shanghai Shenyi Co. LTD; UV-1800 UV-Spectro-photometer made by Beijing Ruili Analytical Instruments Co. LTD; friction test system provided by the Sichuan Chuanqing Downhole Service Company Co. LTD; self-made displacement test apparatus; SCMS-E high-temperature and high-pressure core multiple-parameter measurement system-gas porosity measuring instrument made by the Chengdu Haohan Well Completion & Logging Science Technology Co. LTD; Fourier Infrared Spectrometer made by the Huizhou High Instrument Equipment Co. LTD; Bruker AV 300MHz nuclear magnetic resonance spectrometer made by the Bruker Company of Switzerland; Mastersizer 2000 Laser Particle Sizer made by the Malvern PAnalytical; and PC2810 stop watch made by the Shenzhen Huibo Industry and Trade Co. LTD.
2.2. Experimental methods
2.2.1. Drag reducer synthesis
White oil, butanol, emulsifier and NPA of 18.0%, 6.0%, 1.6%, 3.5% mass fractions were added into a 1000 mL reactor, nitrogen gas was injected in the reactor, and all were stirred at 300-500 r/min to prepare uniform oil phase for future use. Deionized water was added into a 500 mL beaker and AM, DMA, DMC and DAC (with mass fractions of 32%, 7%, 5%, 3%, respectively) were added into the water in sequence and stirred until all of them were dissolved to form water solution. At the high stirring rate of 800-1000 r/min, the water solution was added slowly into the oil phase medium with constant- pressure dropping funnel. After all the water solution was added, the mixed solution was stirred for 30 minutes, meanwhile nitrogen gas was injected, until forming uniform and stable emulsion. Under the reactor temperature of 30 °C, the initiator was added slowly to start reaction at a certain stirring speed. After all the initiator was added, the mixed solution was kept warm and stirred at low speed to ensure temperature balance of the solution in the polymerization process. After thermostatic reaction at 30 °C for 5 hours, the emulsion was cooled to room temperature, and the diverting agent was added, stirred evenly, the milk-white inverse-emulsion drag reducer (DN) was obtained.
2.2.2. Analysis of the drag reducer structure
(1) Infrared spectroscopy analysis. The KBr solid particles were dried, ground into powder and tableted. KBr tablets’ infrared spectrogram was obtained after scanned by Fourier Infrared Spectrometer. A certain amount of the drag reducer was added in a corresponding solution and mixed evenly. The drag reducer solution was mixed with KBr solid powder evenly at a mass ratio of 1:100. The mixture was dried in the oven, and then ground into powder and tableted. The tableted samples were put into light path and scanned within the range of 450-4 000 cm-1 to get infrared spectrograms.
(2) Nuclear magnetic resonance analysis. A certain amount of drag reducer was put into methanol, the residue was filtered out, and then the mixture was dried. The dried product was dissolved into D2O at the concentration of 10 mg/mL. After complete dissolution, the solution was measured at 25 °C with nuclear magnetic resonance spectrometer.
2.2.3. Analysis of particle size
The solutions with different mass fractions of drag reducer and salinities were prepared. Mastersizer 2000 laser grain size analyzer was used to test the specific surface area, particle size and consistency of the solutions.
2.2.4. Test of drag reducer performance
(1) Friction reduction performance test. 40 L fresh water or salt water was put into the container of friction test system and its centrifugal pump was started to build fluid circulation. Drag reducers of different concentration were added into the container quickly and collected the data after stirred evenly. The average test data of friction reduction ratio would be the final slick water friction reduction ratio. The friction test system adopted a 4-meter loop system with a diameter of 12.7 mm (1/2 in). The test flow rate was 40 L/min and the Reynolds number was about 30 000 under the salinity of 300 000 mg/L. The pressure drop of fresh water or salt water was measured before testing the friction reduction ratio of the friction reducer. In the friction reduction ratio test of slick water, the pressure drop was tested at the same discharge with the fresh water or salt water test, then the following equation was used to calculate friction reduction ratio.
(2) Dissolution and thickening performance test. Drag reducer solutions of different mass fractions were formulated with water of different salinity, and measured under different stirring time by Ubbelohde viscometer with an inner diameter of 0.8-0.9 mm at 25 °C. The viscosity of the solution was calculated by the ratio of its sliding time in the viscometer to that of water. The time when the viscosity of a solution stabilized was regarded as the thickening time of the solution.
(3) Static adsorption damage test. 25 groups of 0-0.10% drag reducer solutions were prepared with waters of different salinities. The absorbance values of characteristic peaks of the solutions were measured by Ultraviolet spectrophotometer. The standard curve of the absorbance with the mass fraction was drawn. The shale powder was soaked in the drag reducer solution, and the absorbance of the solution was tested at a regular interval. When the absorbance became stable, the solution was deemed reaching adsorption equilibrium. The absorbance of drag reducer solution after reaching adsorption equilibrium was measured. The variation of mass fraction before and after drag reducer solution adsorption was calculated according to the changes in absorbance (according to equation 2). Then the adsorption capacity was calculated with equation 3.
(4) Dynamic adsorption damage test. At 25 °C, fractures were cut in a Longmaxi Formation shale core. Standard brine (2.0% KCl + 5.5% NaCl + 0.45% MgCl2 + 0.55% CaCl2) was injected into the core to test the liquid permeability at the constant flow rate of 4 mL/min. After the core was dried, nitrogen gas was injected into the core to test the gas permeability under the confining pressure of 10 MPa. When the differential pressure became stable, the data was recorded, and the initial liquid permeability was calculated with equation (4), the initial gas permeability was calculated with equation (5). The fracturing fluid with the drag reducer was then injected from the opposite direction at 4 mL/min for 30 minutes. Then the fracturing fluid was kept in the core for 2 hours to simulate the damage of the drag reducer solution to the formation. Finally, the permeability after damage was tested under the same conditions that the initial permeability was tested. The permeability damage rate of the core was calculated with equation (6).
3. Results and discussion
3.1. Characterization of the drag reducer structure
3.1.1. Infrared spectroscopy
Drag reducer solutions were prepared with the water of 100 000 mg/L and 300 000 mg/L salinity and characterized by infrared spectroscopy, compared with pure DN. The test results are shown in Fig. 1. It can be seen that amino —NH, —NH2 stretching vibration characteristic absorption peaks in amide groups appear at 3 323.79, 1 544.39 cm-1, respectively, carbonyl C═O stretching vibration absorption peak in amide groups appears at 1 670.24 cm-1, ester C—O characteristic absorption peak in DAC monomer at 1 200.87 cm-1, DMC —C—N vibration absorption peak at 1 457.44 cm-1, primary amide characteristic absorption peak at 632.17 cm-1, and —CH absorption peak at 2 922.61 cm-1, showing the existence of carbon main-chain. All the drag reducer molecules contain AM, DAC and DMC chains.
Fig. 1.
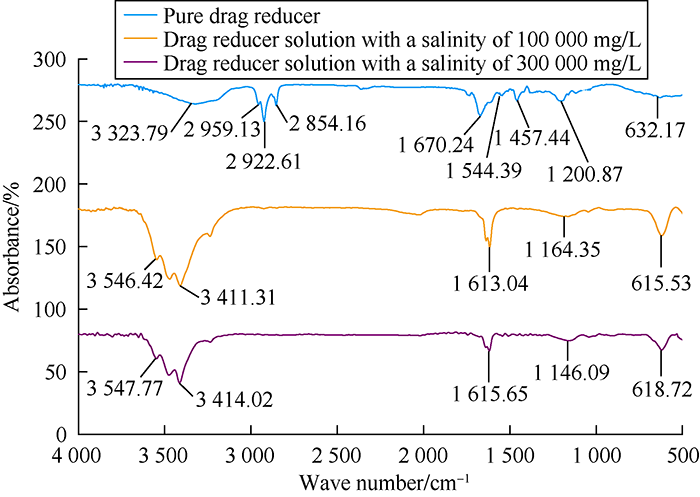
Fig. 1.
Part of infrared spectrogram of DN drag reducer and its solutions.
With the increase of salinity, ion strength in the solution increased, shielding the electric charge on drag reducer polymer chain, weakening the electrostatic repulsion between molecular chains, resulting in the blue shift of some group absorption peaks[23]. For example, —NH absorption peak in amide groups moved from 3 323.79 cm-1 to 3 546.42 cm-1 and then to 3 547.77 cm-1. Carbon chain —CH absorption peak moved from 2 922.61 cm-1 to 3 411.31 cm-1 and then to 3 414.02 cm-1. In contrast, the absorption peaks of ester C—O on cationic fragments moved from 1 200.87 cm-1 to 1 164.35 cm-1 and then to 1 146.09 cm-1; the absorption peak of DMC primary amide moved from 632.17 cm-1 to 615.53 cm-1 and then to 618.72 cm-1; and the amide groups carbonyl C═O absorption peak moved from 1 670.24 cm-1 to 1 613.04 cm-1 and then to 1 615.65 cm-1. Red shifts obviously occurred to these absorption peaks. Besides, the wider and stronger absorption peak in amide groups showed that the introduction of cation fragments weakened the shielding effect of metal cation functional groups to polymer chains at a certain degree. The repulsive force between the same ions would keep cation fragments in balance, and enhance the interactions between chain segments[24,25]. As a result, DN could maintain a stable molecular structure under high salinity to ensure its friction reduction performance under high salinity.
3.1.2. Proton nuclear magnetic resonance
Proton nuclear magnetic resonance (1H-NMR) of DN (300 Hz, D2O) is shown in Fig. 2. In this figure, (1.50-1.66) ×10-6 are the signal peaks of proton 1 and 6 on the main polymer chain and proton 5 on NPA. And 2.22×10⁻⁶ is the signal peak of proton 2 on the main polymer chain. Proton 9 on DMC and DAC moved to the low field due to the non-covalent enhancement between the chains and overlapped with the signal peak of proton 4 on DMA at (3.22-3.90)×10-6. And then the proton signal peak obviously became wider and blunter.
Fig. 2.
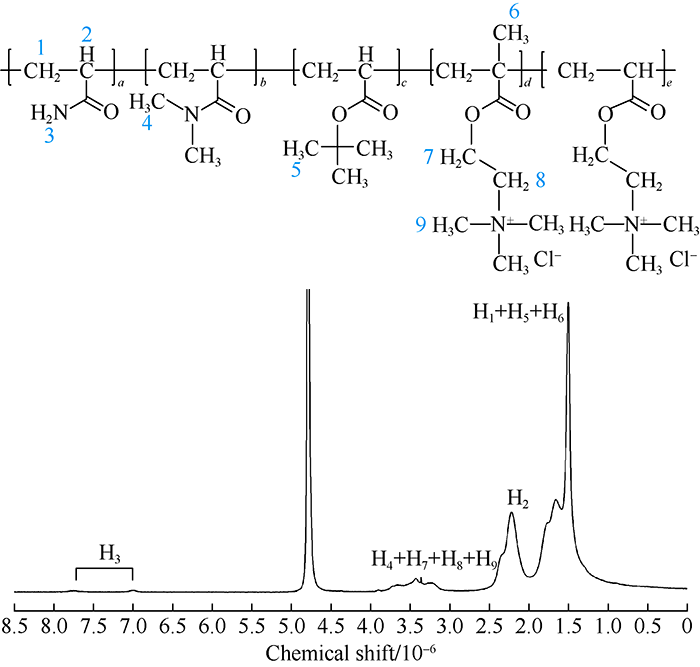
Fig. 2.
Structure and part of 1H-NMR spectrogram of DN drag reducer. 1-9 are the proton numbers and a—e are the monomer numbers.
3.2. Particle size distribution
It can be seen from Fig. 3 and Table 1 that the drag reducer solution particles were distributed quite evenly without obvious adhesion between the particles. And the size of particles had little difference with different mass fractions. Under high salinity, the adsorption of salt ions enlarged drag reducer particle size and reduced specific surface. But the particles’ size still showed consistency with different mass fractions under 100 000 mg/L and 300 000 mg/L salinity, which indicated that the drag reducer molecular structure remained stable and did not show obvious coiling and collapse under high salinity.
Fig. 3.
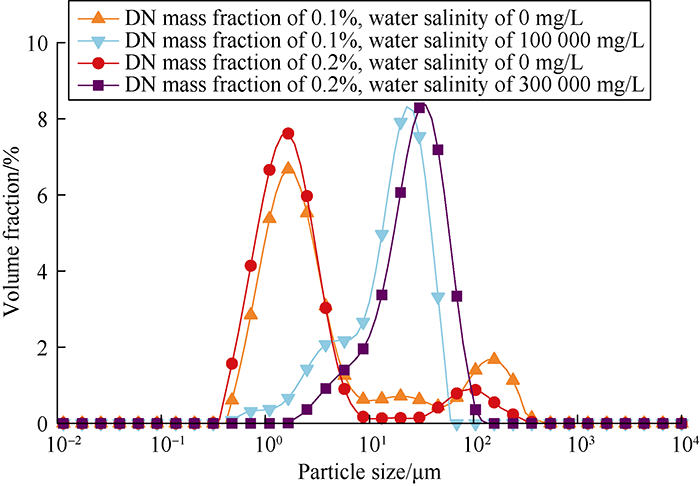
Fig. 3.
Particle size distributions of DN drag reducer solutions with different mass fractions and salinities.
Table 1 Granularity test results of DN drag reducer.
| Mass fraction/ % | Salinity / (mg·L-1) | Specific surface area/ (m2·g-1) | Surface area average particle size/μm | Volume average particle size/μm |
|---|---|---|---|---|
| 0.1 | 0 | 3.360 | 1.787 | 18.030 |
| 0.1 | 100 000 | 0.814 | 7.368 | 25.087 |
| 0.2 | 0 | 4.440 | 1.353 | 10.790 |
| 0.2 | 300 000 | 0.370 | 16.231 | 29.332 |
Fig. 4.

Fig. 4.
Friction reduction performance of the DN drag reducer at different mass fractions.
Fig. 5.
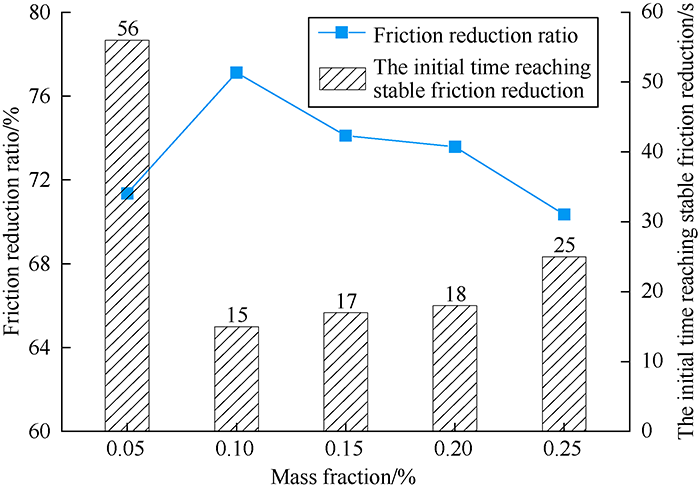
Fig. 5.
Relationship of friction reduction ratio and mass fraction of DN drag reducer.
3.3. Test of friction reduction performance
3.3.1. Friction reduction performance
Solutions were made by dissolving DN of different mass fractions into fresh water, and the friction reduction ratios at room temperature and initial time reaching stable friction reduction of the solutions were tested. Figs. 4 and 5 show that the DN has great friction reduction performance in fresh water. The solution with 0.05% mass fraction of DN had a friction reduction ratio of more than 70% at 25s, and stable friction at 56s. With the increase of DN’s mass fraction, more drag reducer molecules dispersed quickly, and the interaction force between the polymer molecules became stronger, reducing turbulence effect in the fracturing fluid flow, enhancing friction reduction performance[26,27], and making the time to reach stable friction reduction shorter. When DN’s mass fraction was 0.10%, it achieved the best friction reduction effect, with the friction reduction ratio reaching 77% at 15s. But with further increase of mass fraction, the interaction between drag reducer molecules became even stronger, and thus the viscosity of the fluid increased, which made the friction loss during fracturing fluid flow increase, friction reduction ratio drop, and the time needed to reach stable friction reduction increase slightly.
Reuse the flowback water during fracturing of shale gas reservoir can reduce the demand on surface fresh water and save cost. Seymour[28] found that metal ions in produced water were mainly sodium, potassium, calcium, magnesium, iron ions, among which sodium and calcium ions were the most, and salinity had a great effect on the friction reduction performance of fracturing fluid. Therefore, in this study, we tested the drag reducer performance under different salinities. The friction reduction ratios of DN at different mass fractions in NaCl salt waters and CaCl2 salt waters of different salinities were measured, and the results are shown in Table 2. It can be seen that adding 0.10% DN into NaCl salt water and CaCl2 salt water with a salinity of 100 000 mg/L resulted in a friction reduction ratio of about 70%. Slight increase of DN concentration resulted in obvious improvement of its friction reduction performance. When the mass fraction of DN was increased to 0.15 %, the friction reduction ratios of the NaCl salt water and CaCl2 salt water with 100 000 mg/L salinity reached 76.10% and 75.42% respectively. The 0.15% mass fraction of DN ended with friction reduction ratios of over 70% for the NaCl salt water and CaCl2 salt water with 200 000 mg/L salinity. After adding penetrant S and synergist Z to adjust demulsification degree, dispersion property and viscosity property, the friction reduction ratios of 0.2% DN in NaCl salt water and CaCl2 salt water of 300 000 mg/L salinity raised to 74.83% and 75.21% respectively (Fig. 6).
Table 2 Friction reduction ratios of DN drag reducer at different mass fractions and salinities.
| Salinity/ (mg·L-1) | Mass fraction/% | Friction reduction ratio/% | |
|---|---|---|---|
| NaCl water | CaCl2 water | ||
| 0 | 0.10 | 76.24 | 76.24 |
| 25 000 | 0.10 | 72.76 | 72.42 |
| 50 000 | 0.10 | 71.07 | 71.36 |
| 100 000 | 0.10 | 69.73 | 70.68 |
| 100 000 | 0.15 | 76.10 | 75.42 |
| 150 000 | 0.15 | 69.56 | 70.12 |
| 200 000 | 0.15 | 70.78 | 70.39 |
| 250 000 | 0.20 | 70.12 | 70.24 |
| 300 000① | 0.20 | 71.24 | 70.96 |
| 300 000② | 0.20 | 74.83 | 75.21 |
Note: In case ①, penetrant S was added; in case ②, penetrant S and synergist Z were added.
Fig. 6.
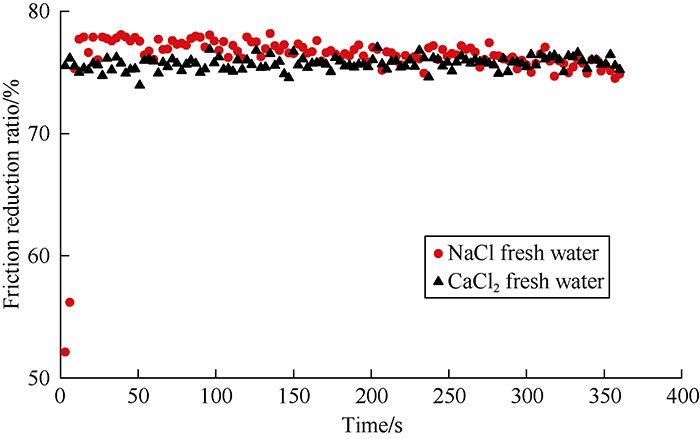
Fig. 6.
Friction reduction performance of DN drag reducer at mass fraction of 0.2% in waters with 300 000 mg/L salinity and penetrant S and synergist Z added.
Compared with salt water of high salinity prepared in the lab, oilfield produced water is more complex in composition and affects friction reduction performance more. Slick waters with 0.10% DN drag reducer were prepared by using high salinity produced waters from different blocks, and the performances of the slick waters were tested (Table 3). The results show that all the slick waters had a friction reduction ratio of more than 71%, meeting the requirement of field application.
Table 3 Test results of slick waters with 0.10% DN drag reducer prepared by produced waters from different blocks.
| Source of water | Salinity/ (mg·L-1) | Apparent viscosity/(mPa·s) | Friction reduction ratio/% |
|---|---|---|---|
| Freshwater | 0 | 2.46 | 76.35 |
| Produced water of Weiyuan gas field | 32 132 | 1.92 | 72.05 |
| Produced water of Changning gas field | 28 512 | 1.84 | 71.31 |
| Produced water of Zhaotong gas field | 21 669 | 1.87 | 71.18 |
3.3.2. Dissolution and thickening performance
Viscosities of 0.10% DN solution and inverse-emulsion drag reducer solution with different metal cations and salinities were measured by Ubbelohde viscometer. The results are shown in Table 4 and Fig. 7. With the increase of salinity, the ionic strength in inverse-emulsion drag reducer solution increased, shielding the electric charge on the polymer chains and weakening the electrostatic repulsion between the chains. Consequently, the chains coiled and the structure of the molecule was destroyed, leading to rapid drop of viscosity of the inverse-emulsion drag reducer solution with no sign of recovery. The viscosity of the solution prepared with high salinity water was much lower than that prepared with fresh water, as its structural viscosity almost lost out. In contrast to inverse- emulsion drag reducer solution, cation fragments greatly enhanced the tolerance of DN to salt ions. When salinity was higher than 150 000 mg/L, the viscosity of DN solution rose slightly. The DN solution maintained at a viscosity of 1.53 mPa·s at the salinity of 300 000 mg/L. Combined with infrared test results, it could be found that with the increase of ionic strength and solution polarity, the repulsion of cationic groups on polymer chains increased, which further enhanced the acting force between chain segments and system viscosity. Cation segments weakened the damage of ion shielding effect on structural viscosity at a certain degree. When the salinity was higher than 150 000 mg/L, the increase of ionic strength and solution polarity enhanced the interactions between chain segments, partially offset the viscosity decrease brought by shielding effect and significantly improved salt tolerance of drag reducer.
Table 4 The effects of salinity and ion types on the viscosity of 0.10% inverse-emulsion drag reducer solutions.
| Type of ion | Salinity/(mg·L-1) | Apparent viscosity/(mPa·s) |
|---|---|---|
| Na+ | 0 | 2.09 |
| 500 | 1.68 | |
| 1 000 | 1.22 | |
| 2 000 | 1.06 | |
| 5 000 | 0.95 | |
| 10 000 | 0.93 | |
| Ca2+ | 0 | 2.04 |
| 50 | 1.56 | |
| 100 | 1.27 | |
| 200 | 0.92 | |
| 500 | 0.88 | |
| 1 000 | 0.84 |
Fig. 7.
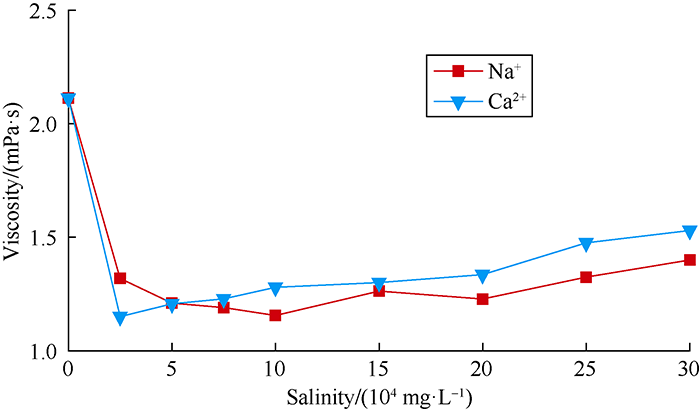
Fig. 7.
The effects of salinity and ion types on the viscosity of 0.1% DN drag reducer solutions.
There were marked differences between the fracturing site and laboratory. To achieve continuous mixing and reduce cycle times of fluid preparation and time for fluid preparation, the drag reducer should increase viscosity quickly and disperse evenly. The thickening time and apparent viscosity of DN solutions at different mass fractions and salinity were measured. As shown in Table 5, thickening time was shorter than 60s, representing that DN dissolved and thickened quickly and could satisfy the demand for fast fluid preparation.
Table 5 Thickening time of DN at different salinities.
| Salinity/ (mg·L-1) | Mass fraction/% | Thickening Time/s | Apparent viscosity/ (mPa·s) |
|---|---|---|---|
| 0 | 0.10 | 14 | 1.39 |
| 100 000 | 0.10 | 40 | 1.12 |
| 200 000 | 0.15 | 52 | 1.27 |
| 300 000 | 0.20 | 60 | 1.53 |
3.3.3. Static adsorption damage
Drag reducers can easily adsorb on fracture surfaces and matrix. The adsorption capacity of polyacrylamide-based drag reducer sold in the market is usually 9-20 mg/g, and is even larger under high salinity. Massive adsorption of drag reducer molecules would narrow or even block oil and gas flow paths formed by fracturing, and thus seriously impair the fracturing effect [29]. Standard absorbance curves of 0.10% DN solutions with different salinities were measured by ultraviolet spectrometer (Fig. 8), and the changes in adsorption capacity of the DN after shale powder was added was calculated, as shown in Fig. 9. It can be seen the adsorption capacity at different salinities all went up first and then became stable. When the salinity was 0 mg/L, the adsorption equilibrium time of 0.10% DN solution was 120 minutes, which meant it reached saturation adsorption after 120 minutes. And its adsorption-changing pattern conformed to Langmuir isothermal adsorption model[30]. When the salinity of dosing water increased, the adsorption equilibrium time changed little, which exhibited that salinity had little effect on adsorption equilibrium time.
Fig. 8.
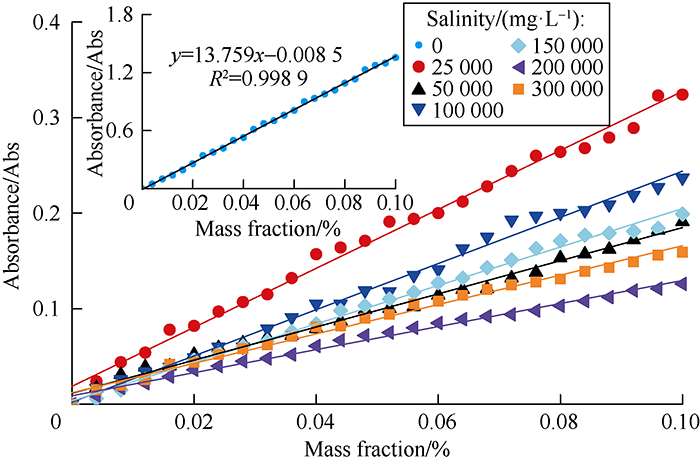
Fig. 8.
Standard absorbance curves of DN solution under different salinities.
Fig. 9.
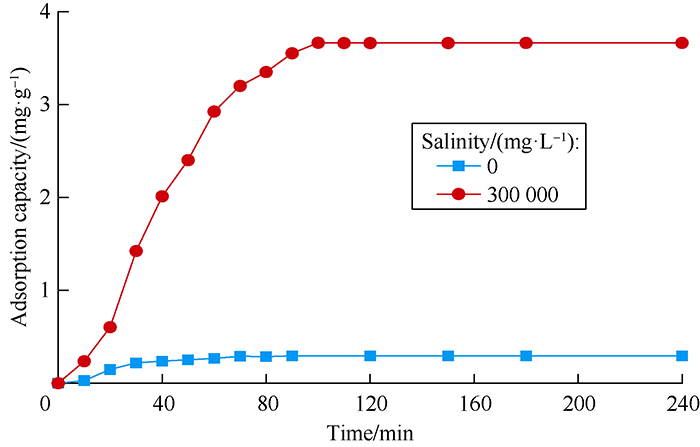
Fig. 9.
Adsorption equilibrium curves of 0.10% DN solution under different salinities.
A certain quantity of rock powder was soaked into the drag reducer solutions with different salinities at liquid-solid ratio of 25:4[18, 31]. The mass fraction changes were measured after 150 minutes and corresponding adsorption capacities under different salinities were calculated, and the results are shown in Fig. 10. Compared with the adsorption capacity of inverse- emulsion drag reducer solution (19.5 mg/g in fresh water), the adsorption capacity of DN solution was only 0.29 mg/g which reduced by 81.2%. With the increase of salinity of dosing water, the adsorbing capacity of DN solution increased, but its adsorbing capacity was only 3.66 mg/g when salinity reached 300 000 mg/L, displaying the characteristic of low adsorption.
Fig. 10.
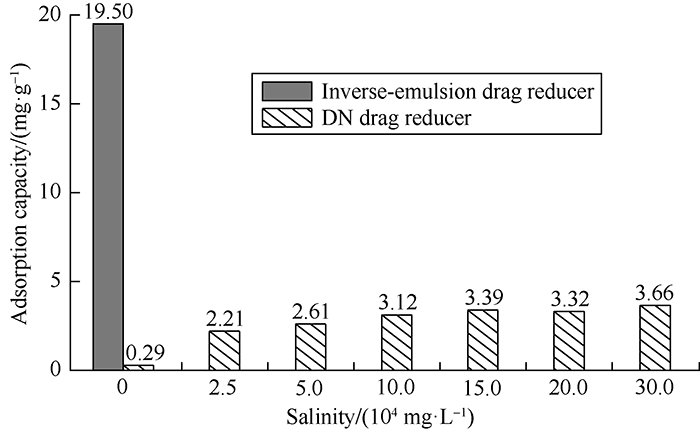
Fig. 10.
Adsorption capacities of drag reducer (0.10%) solution under different salinities.
3.3.4. Dynamic adsorption retention damage
Previous studies showed that drag reducer adsorbing on shale surface and agglomerating and coiling residual polymer molecules would narrow or even block shale flow paths and finally lead to permeability damage[15]. With the increase of salinity and drag reducer mass fraction, the shielding effect of metal cation would damage the network structure of polymer molecules, consequently, the polymer chains would coil and aggregate, forming molecule groups of shale pore-throat size, which would have severe blockage to the flow paths and worse damage to the reservoir. The permeability changes of Longmaxi Formation shale core with fractures cut before and after displacement with drag reducer solutions were measured to evaluate the damage of the DN drag reducer to shale reservoir, and the test results are shown in Table 6. Compared with inverse-emulsion drag reducer, the decrease of adsorbing capacity greatly lowered the damage of DN solution to core. When the salinity reached 300 000 mg/L, the average permeability damage rate of 0.2% DN solution was only 7.63%.
Table 6 Results of permeability damage tests of different drag reducers to shale core.
| Core No. | Drag reducer | Mass fraction/% | Permeability/10-3 μm2 | Damage rate/% | |
|---|---|---|---|---|---|
| Before damage | After damage | ||||
| 1 | Inverse-emulsion drag reducer | 0.10 | 1.18 | 0.40 | 66.10 |
| 2 | DN drag reducer | 0.10 | 5.87 | 5.85 | 0.34 |
| 3 | Inverse-emulsion drag reducer | 0.20 | 0.91 | 0.29 | 68.13 |
| 4 | DN drag reducer | 0.20 | 1.82 | 1.67 | 8.24 |
| 5 | Inverse-emulsion drag reducer | 0.20 | 7.15 | 2.32 | 66.61 |
| 6 | DN drag reducer | 0.20 | 5.41 | 5.03 | 7.02 |
Note: No. 1 to No. 4 were liquid permeability; No 5 to No. 6 were gas permeability.
4. Field application
To achieve effective exploitation of shale formations in the Sichuan Basin at a low cost and meet the need for lower friction of fracturing fluid in deep well fracturing, a slick water system prepared by DN was applied in the a block in Sichuan Basin. The tests were conducted in 8 wells and the field application data is shown in Table 7. Both the success rate of fracturing operation and recycling rate of produced water reached 100%, and friction reduction rates were 75%-76%. Taking Well N204-5 as an example, this well had a production rate of 21.86×10⁴ m3/d after fracturing, that is 44.2% higher than the adjacent well N204-3 (15.15×10⁴ m3/d) in the same platform using regular salt tolerance slick water system. Compared with regular slick water system, this new system used almost the same additives except drag reducer, and produced water was used to prepare the system. The cost of regular salt tolerance slick water system is over 60 RMB/m3, and that of the DN system is lower than 50 RMB/m3. If About 38 000 m3 slick water is needed for a well with 25 fracturing stages, then the comprehensive saving cost of a single well is more than 0.38 million RMB by using DN system.
Table 7 Field application statistics.
| Well No. | Horizontal length/m | Number of perforation clusters per stage | Fracturing stage | Flow rate/ (m3·min-1) | Volume of slick water/ m3 | Average sand quality per stage/t | Produc- tion rate/ (104 m3·d-1) | Salinity of produced water/(mg·L-1) | Reuse rate of produced water/% | Average friction reduction ratio/% |
|---|---|---|---|---|---|---|---|---|---|---|
| N108-1 | 1 370 | 3 | 12 | 10-12 | 23 383 | 86.0 | 40.1 | ≈20 000 | 100 | 76.2 |
| N108-2 | 1 100 | 3 | 13 | 10-12 | 15 910 | 85.3 | 75.7 | |||
| N108-3 | 1 190 | 3 | 8 | 10-12 | 16 245 | 91.2 | 75.4 | |||
| N108-4 | 1 330 | 3 | 10 | 10-12 | 19 632 | 93.4 | 76.1 | |||
| N204-1 | 1 600 | 3 | 24 | 12-14 | 32 491 | 94.7 | 43.6 | ≈30 000 | 100 | 75.4 |
| N204-5 | 1 700 | 3 | 25 | 12-14 | 38 156 | 89.1 | 75.6 | |||
| N202-5 | 1 730 | 3 | 31 | 12-14 | 54 320 | 90.3 | 39.6 | 75.1 | ||
| N202-6 | 1 750 | 3 | 31 | 12-14 | 54 588 | 95.6 | 75.3 |
5. Conclusions
Based on the adsorption mechanism of polymers on rock surface and monomer molecule design, a high-salt-tolerance and low-adsorption drag reducer has been synthesized by introducing polar cation structural units into the inverse-emulsion drag reducer. Structural mechanism analysis shows that the introduced cation fragments can weaken the shielding effect of metal cation to functional groups, and the repulsion force between the same kind of ions can keep cation fragments in a balanced state; the interactions between chain segments would be strengthened, so the drag reducer would keep stable in molecular structure and friction reduction performance at high salinity. Meanwhile, the existence of cationic monomers can increase the interaction between the chains of drag reducer and reduce the free polar sites on the chains, thus, the possibility of forming hydrogen bonds between drag reducer and polar sites on cores and adsorption capacity would decrease, lowering the damage to reservoir.
The slick water system prepared with the new high salt tolerance and low adsorption drag reducer was used in 8 wells, with fracturing success rate of 100%, produced water reuse rate of 100%, friction reduction rates of 75%-76%. The comprehensive cost was lowered by 17% and single-well production rate was increased by 44%. The oilfield produced water was reused, significantly lowering the pollution risk of fracturing fluid to the environment.
Nomenclature
A—core cross-section area, m2;
A0—initial absorbance, Abs;
As—sample absorbance, Abs;
k—slope of standard curve, Abs/%;
K1, K2—core permeability before and after damage, m2;
Kg, Kl—gas permeability, liquid permeability, m2;
L—the length of core, m;
m—absorbent quality, g;
M—drag reducer solution quality, mg;
p0—atmospheric pressure, the value is 0.1 MPa;
p1, p2—absolute pressures at core inlet and outlet, Pa;
Qg, Ql—gas and liquid volume flow rate, m3/s;
x—solute loss quality, mg;
Γ—adsorption capacity, mg/g;
ΔC—changes in mass fractions of drag reducer solution before and after absorption, %;
Δp—differential pressure between core inlet and outlet, Pa;
Δpp—pressure drop in pipe when polymer solution is used, MPa;
Δpw—pressure drop in pipe when clear water or salt water is used, MPa;
η—friction reduction ratio, %;
μg, μl—gas and fluid viscosity, Pa·s;
ζ—permeability damage rate, %.
Reference
Types and characteristics of shale gas reservoir: A case study of Lower Paleozoic in and around Sichuan Basin
Progress and application of hydraulic fracturing technology in unconventional reservoir
Breakthrough and prospect of shale gas exploration and development in China
Current state and outlook of exploration and development of the shale gas resources in the world
A review of the technical and economic evaluation techniques for shale gas development
Overview of shale gas reservoir fracturing technology
Preparation and properties of resistance reducing agent with temperature and salt resistance used for shale gas fracking
Effects of slick water fracturing fluid on pore structure and adsorption characteristics of shale reservoir rocks
Environmental impacts of hydraulic fracturing in shale gas development in the United States
Technological progress and prospects of reservoir stimulation
Technology of fracturing fluids with friction-reducing water overseas and its research progress
Recent advances on friction reducer for slickwater fracturing of shale gas reservoirs
Research progress and prospect of friction reducer for hydraulic fracturing at home and abroad
Shale gas in China: Characteristics, challenges and prospects(II)
Discussion of preparation for polyacrylamide friction reducer with temperature, salinity and shear resistant used in slickwater fracturing
Study on salt thickening mechanism of the amphiphilic polymer with betaine zwitterionic group by β-cyclodextrin inclusion method
Adsorption damage and control measures of slick-water fracturing fluid in shale reservoirs
Bioinspired fabrication of high strength hydrogels from non-covalent interactions
Progress in research and application of drag reducer for shale reservoir fracturing
Synthesis of copolymer of acrylamide with sodium vinylsulfonate and its thermal stability in solution
Performance evaluation of slickwater friction reducer with salt tolerance
IR study on the hydrogen-bonding motif
Study on the performance of a new salt resistant drag reducer for slippery water
Preparation and application of an emulsion supramolecular fracturing fluid for shale gas development
Study on slick-water instant drag-reducing agent
Enhancing friction reducer performance in high salt conditions
Review on formation damage mechanisms and processes in shale gas reservoir: Known and to be known
Study on adsorption characteristic of PAM on coal powder
Adsorption of new hydrophobic polyacrylamide on the calcite surface
DOI:10.1002/app.45314 URL [Cited within: 1]
