

Introduction
Deep strata in the Sichuan Basin contain abundant tight gas resources, a considerable part of which are hard-to-recover reserves, suggesting a great resource potential for exploration and development [1⇓-3]. By the end of 2020, China Petroleum and Chemical Corporation (Sinopec) had booked cumulative tight gas 3P reserves of 8016×108 m3 and proved reserves of 1773×108 m3 in the Upper Triassic Xujiahe Formation (T3x), western Sichuan Basin, which are distributed mostly in the second member of the Xujiahe Formation (T3x2) in the Xinchang structural belt. However, such a huge quantity of reserves could not be recovered effectively, making the exploration and development of the Xujiahe Formation almost at a standstill.
According to previous geologic studies [4⇓⇓-7], economic production of tight gas is feasible in shallow and middle zones, for example, of the Upper Paleozoic in the Ordos Basin and the Cretaceous in the Songliao Basin. However, it is challenging to explore tight sandstone gas deeper than 4000 m (only a significant discovery has been made in Keshen gas field of the Tarim Basin so far)[8⇓-10]. Some scholars investigated the 4500-5500 m deep Xujiahe Formation in the Xinchang structural belt, the West Sichuan Depression of the Sichuan Basin, with respect to sedimentation, reservoir, and hydrocarbon accumulation [6-7,11⇓⇓ -14]. They indicated the difficulties in sweet spot identification and geologic model recognition etc. due to large buried depth, extremely tight reservoir properties, multi-phase folds and faults, complex fractures with unclear genesis, strong reservoir heterogeneity [11⇓-13], various controls [14-15], and complicated sweet spot genetic mechanism.
Using core, outcrop, test, and logging-seismic data, we dissect faults, folds, and fractures related to deep tight sandstones in T3x2 in the Xinchang structural belt, and put forward the concept of fault-fold-fracture body (FFFB) based on the terms such as fault-fracture body and permeable reservoir unit proposed in previous studies. Through the analysis of FFFB types and features, as well as major controls on fractures associated with faults and folds, the FFFB models are established to predict promising development targets. The study results provide a support to tight gas production.
1. Geological setting
The Xinchang structural belt, the area of interest (AOI) in this study, lies in the central-north of the West Sichuan Depression, the Sichuan Basin. It is an anticline with its major axis in nearly east-west direction, and develops several structural highs. There are numerous faults in the AOI (Fig. 1 ), which are mainly reverse faults caused by regional compressional stress and can be classified into orders depending upon their ages and sizes. Early E-W faults shaped the anticline in the Xinchang structural belt, and late S-N faults cut the anticline into tectonic units. These faults are crucial to the development of fractures and high gas yield in the AOI.
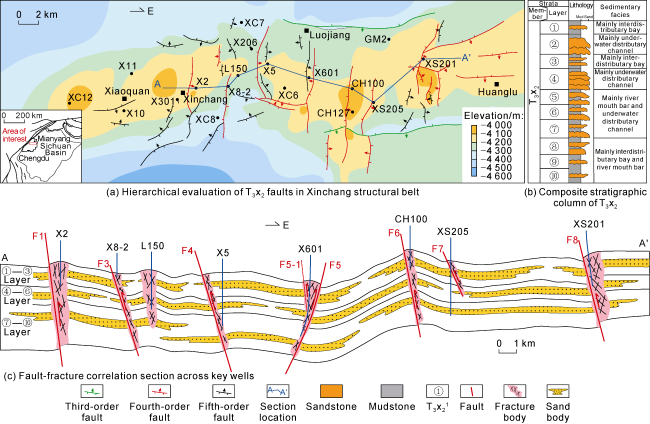
Fig. 1. Geologic structures and cross-well section of T3x2 in Xinchang structural belt in the West Sichuan Depression. |
The sedimentary system in T3x2 consists of branch channels and river mouth bars at braided-river delta front [11,13], with the formation thickness of 400-700 m. Vertically, it is divided into 10 layers (T3x21-10), where sand bodies extend widely (mainly fine sandstone and finer-sized rocks) and are 300-500 m thick. Reservoirs with good properties occur discontinuously in the vertical direction, and are thin individually (2 m on average, or 10 m max.). These highly heterogeneous reservoirs consist of lithic sandstones and lithic quartz sandstones. They are generally of low porosity (average matrix porosity of 3.4%) and low permeability (average matrix permeability of 0.07×10⁻³ μm2).
2. Features of fault-fold-fracture body
Despite some important conclusions of faults and folds and their controls on fractures derived from outcrop studies and simulation experiments [16⇓⇓⇓-20], there is no conceptual system and geologic model of fracture body available based on genetic classification. After literature review, we introduce a new concept - fault-fold-fracture body (FFFB). With the second member of Xujiahe Formation (T3x2) in the Xinchang structural belt as an example, we classify FFFBs depending upon the matrix and fracture body types, and clarify major controls on effective fractures, thus supporting the construction of geologic model.
2.1. Concept of FFFB
For deep tight sandstones, the fracture characterization is difficult, but the fracture bodies and their configurations with faults and folds are of great significance practically. Some concepts, e.g. fault-fracture body and permeable reservoir unit, were used. He et al. defined the fault fracture body as composite reservoirs composed of faults, associated brittle fractured belts and low-permeability tight sandstone layers modified by the belts, which are usually capped or flanked by impermeable argillaceous rocks or tight layers [16]. Wang et al. proposed the fault-fracture body as a new type of reservoir unit with composite matrix porosity, which is composed of anastomosed fractures resulted from superposition of faults and fractures and associated fractures with faults and folds [17]. He et al., Deng et al., and Gillespie et al. took the independent reservoir unit with permeable pores and fractures superimposed as a permeable reservoir unit[18⇓-20].
The previous studies suggest the more and more attention to the reservoir unit composed of fractures and matrix pores in tight sandstones; however, there is no systematic definition and genetic classification of fracture bodies. Based on these studies and the genetic features of effective fractures in deep tight sandstones of T3x2 in the Xinchang structural belt, we put forward the concept of fault-fold-fracture body (FFFB), which refers to faults, folds and associated fractures reservoirs (Fig. 2 ). In petroleum exploration and development, a FFFB is a unit with fractures and pores which are connected in the original formation state or after being modified by folding and rifting, and can function for hydrocarbon migration and accumulation.
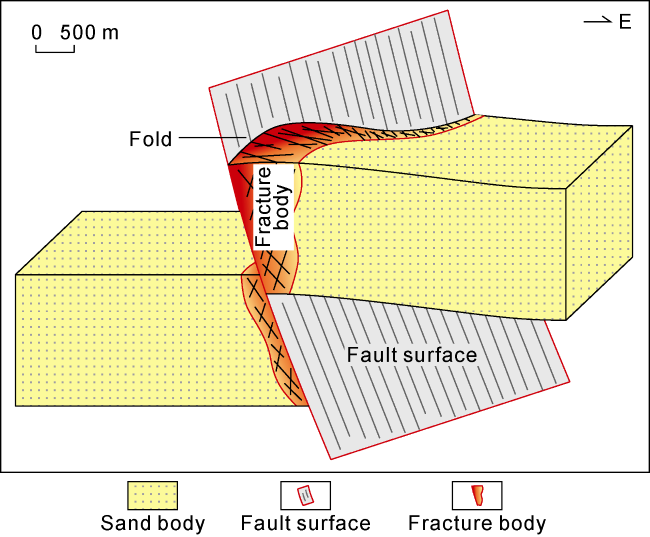
Fig. 2. Schematic diagram of FFFB. |
2.2. Types of FFFB
A FFFB consists of two parts: matrix and fracture body. The promising matrix reservoir with good pore throat structure renders pore space in the FFFB, and effective fractures connect pores and throats in the matrix reservoir to improve FFFB permeability. We took T3x2 in the Xinchang structural belt as an example to clarify the types of promising matrix reservoirs and effective fracture bodies.
2.2.1. Types of promising matrix reservoirs
Lithofacies analysis is crucial to the study of promising matrix reservoirs in deep tight sandstones [7]. A lithofacies refers to the rocks or rock assemblage formed in a specific sedimentary environment, and it is a dominant component of sedimentary facies recording the effects of initial water power, energy, and diagenesis on reservoirs[21-22]. According to core study of 12 wells, 10 types of lithofacies were recognized in the T3x2 sandstones [7] (Fig. 3 ). Specifically, medium to coarse sandstones with trough/parallel bedding, massive bedding, diagonal bedding, and carbon debris statistically performing best in petrophysical properties (Fig. 3b ) are regarded to be promising lithofacies. These promising lithofacies are generally classified as two types: layer-cake lithofacies with horizontal fractures and blocky lithofacies without horizontal fractures (Fig. 3 and Table 1 ). The former is represented by medium to coarse sandstones with trough bedding and parallel bedding, and the latter is represented by medium to coarse sandstones with massive bedding, diagonal bedding, and carbon debris.
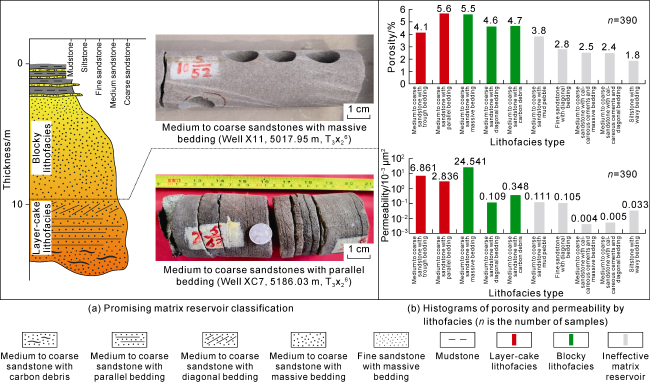
Fig. 3. Classification and petrophysical properties of promising matrix reservoirs in T3x2 in Xinchang structural belt. |
Table 1. Petrophysical properties and pore structures of promising matrix reservoirs in T3x2 in Xinchang structural belt |
| Type of promising lithofacies | Lithofacies assemblage | Development of bedding fractures | Petrophysical property | Pore structure | |||||
|---|---|---|---|---|---|---|---|---|---|
| Porosity/ % | Permeability/ 10-3 μm2 | Coefficient of mean value | Sorting coefficient | Variation coefficient | Flexure coefficient | Median radius/μm | |||
| Layer- cake | Medium to coarse sandstone with trough/parallel bedding | Developed horizontal bedding fractures | 4.50-5.60 (4.85) | 0.01-33.20 (19.95) | 11.49 | 2.84 | 0.23 | 1.00 | 0.028-0.056 (0.042) |
| Blocky | Medium sandstone with massive bedding and diagonal bedding | Undeveloped horizontal bedding fractures | 4.00-4.90 (4.35) | 0.002-4.500 (0.300) | 11.53 | 2.96 | 0.33 | 0.31 | 0.005-0.018 (0.013) |
Note: The value in the parentheses is an average. Data were derived from 115 samples acquired from 7 wells including XC12, XC8, and L150. |
Reservoirs of layer-cake lithofacies usually occur in the middle and lower parts of underwater distributary channels and indicate a sedimentary environment with strong water power. This type of reservoirs mainly includes quartz sandstones and lithic quartz sandstones featuring trough bedding, parallel bedding, and cross bedding with sheet-like extension in the lateral direction and discontinuous distribution in the vertical direction, medium to coarse grains in the matrix, and high quartz content followed by feldspar content. Petrophysical properties of matrix are good. Reservoir space is mainly composed of residual intergranular pores, followed by intragranular dissolved pores, with bundle-shaped throats. Micro-fractures, which can be observed on some thin sections, may improve reservoir permeability and pore structure and make reservoirs more homogeneous and connected.
Reservoirs of blocky lithofacies are the product of fast deposition and usually occur in the middle part of underwater distributary channels. Reservoirs are moderately homogenous with no bedding. Single-layer thickness is large. Dominated by channel extension, this type of reservoirs often distribute in band geometry in the lateral direction. They are composed of medium-grained feldspathic lithic sandstones and lithic sandstones, finer than layer-cake reservoirs in particle size, with increasing debris content. Reservoir properties are good. Reservoir space with good pore structure and moderate connectivity is mainly composed of intragranular dissolved pores and intergranular dissolved pores, followed by residual intergranular pores, with bundle-shaped throats.
2.2.2. Types of effective fracture bodies
With respect to effective fracture body classification, previous studies [16⇓⇓⇓-20] mainly dealt with faults and associated fractures rather than folds and associated fractures. As mentioned above, there are multi-phase varied-size faults and folds and 5 types of fractures, i.e. horizontal fracture, low-angle fracture, diagonal fracture, high-angle fracture, and vertical fracture, in T3x2 (Fig. 4 ), owing to the effect of regional complicated tectonic stress. Most fractures are horizontal fractures and low-angle fractures, accounting for over 70% of total fractures; but medium- to high-angle structural fractures are effective for deliverability and mainly associated with faults and folds caused by regional tectonic stress. According to the effects of faults and folds on fracture body, effective fracture bodies are classified as fault-fold body, fault-fracture body, and fold-fracture body (Fig. 5 ).

Fig. 4. Core photos showing various fractures in T3x2 in Xinchang structural belt. |
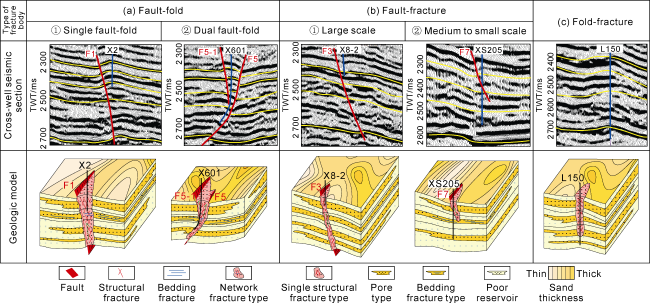
Fig. 5. Classification of fracture bodies in T3x2 in Xinchang structural belt. |
A fault-fold body is the fracture body associated with the faults and folds caused by regional compressional stress (Fig. 5a ). Compared with fault-fracture body and fold-fracture body, the fault-fold body contains the most developed fractures. Regional compressional stress leads to formation flexure and deformation followed by disconnection to form faults or formation disconnection at first followed by hanging-wall bending related to compressional traction to form folds. The fault-fold bodies in the AOI are usually associated with fourth-order faults and folds in the north-south direction and formed at the late stage; thus, most fractures are unfilled or partially filled. According to fault pattern, the fault-fold bodies in the AOI are further classified as single fault-fold body (Fig. 5a -①) and dual fault-fold body (Fig. 5a -②).
The former is common and features a single reverse fault with non-staggered drag fold at the hanging wall. The latter may give birth to more fractures than the former and features two oppositely inclined reverse faults, a typical style of positive flower structure, with the hanging wall dominated by two faults and a fold, where structural fractures are well developed.
A fault-fracture body is the fracture body associated with the faults caused by regional compressional stress (Fig. 5b ). Rigid formations may be directly broken by regional compressional stress without deformation [10] to form faults, with medium- to high-angle structural fractures occurring at the hanging wall and foot wall, along with the compression. Fault-fracture bodies in the AOI are similar to those in the Triassic Yanchang Formation in the south margin of the Ordos Basin in direct rupture of rigid formations without flexure and deformation [16]. Effective fault-fracture bodies are the units with fourth-order faults in the north-south direction and associated fractures forming in the Yanshanian (Fig. 5b -①) and fifth-order faults in the north-south direction (Fig. 5b -②). The former features large fault throw (larger than 20 m), large vertical extension (penetrating the underlying Middle Triassic Leikoupo Formation), and large density of associated fractures which are mostly unfilled or partially filled. The latter features small fault throw (less than 20 m), small vertical extension (limited within T3x2), and unfilled to partially filled fractures; these independent natural fracture bodies can be taken as potential targets for development.
A fold-fracture body is the fracture body associated with the folds caused by regional compressional stress (Fig. 5c ). Plastic formations tended to be flexed and deformed and not broken by regional compressional stress[10]. As compression went on, various medium- to high-angle structural fractures were apt to occur above and below the neutral plane of the folded stratigraphic unit. According to fault size and age, fold-fracture bodies in four directions, i.e. E-W, S-N, NE-SW, and NW-SE, are identified [23]. Effective fold-fracture bodies are the units in S-N associated with fourth-order faults and small folds in NE-SW and NW-SE directions associated with fifth-order faults or appearing independently.
2.3. Formation feature of FFFB
2.3.1. Fault-associated fractures and major controls
Fracture density is higher in the hanging wall than in the foot wall. Under the continuous action of compressional stress, the hanging wall of reverse fault was folded, sheared, and broken or directly broken to form fractures. The hanging wall is different from the foot wall in stress magnitude and direction. According to outcrops, geological analysis (Fig. 6a ) and well data, the fracture density is higher in the hanging wall than in the foot wall. Fracture density also varies vertically in different rock mechanical layers [24-25]. Some structural fractures are confined by mudstone layers and extend within sandstone layers.
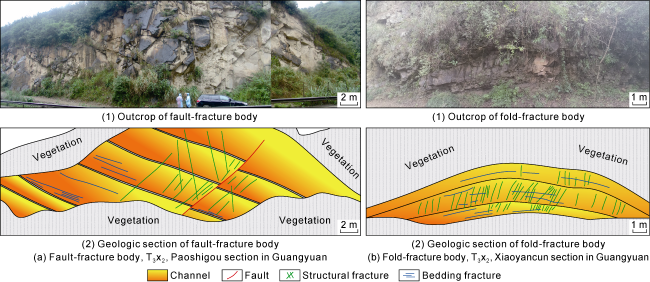
Fig. 6. Field outcrops and geologic models of fault-fracture and fold-fracture bodies in Xujiahe Formation, West Sichuan Depression. |
Fracture density increases with fault throw and decreasing distance to fault surface. The occurrence of fractures in the hanging wall is also dependent on fault throw and the distance to fault surface [17]. Single-factor influence is not remarkable, but fracture density significantly increases with the ratio of the fault throw to the distance to fault surface. As per the correlation analysis (Fig. 7a ), there is a linear positive correlation between fracture density and the ratio of the fault throw to the distance to fault surface with R2≈0.9, which means that the larger the fault throw and the smaller the distance to fault surface, the larger the fracture density is.
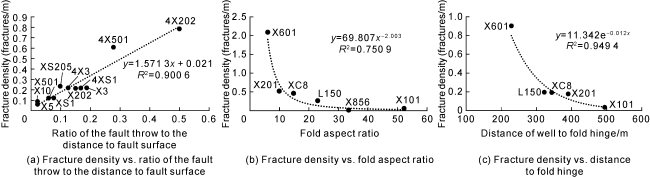
Fig. 7. Crossplots of fracture density vs. key parameters of faults and folds in T3x2 in Xinchang structural belt. |
2.3.2. Fold-associated fractures and major controls
Fracture density increases with fold amplitude, or decreasing aspect ratio. Different stresses above and below the neutral plane in the process of formation flexure and deformation result in different fracture densities and types, and fracture density increases with fold amplitude[26]. Fold aspect ratio is a key parameter controlling fractures. Fold amplitude increases with decreasing aspect ratio. As per correlation analysis (Fig. 7b ), there is a negative correlation between fracture density calculated using imaging log data and fold aspect ratio at the fold core from 6 wells, with R2≈0.75, which means that the smaller the aspect ratio, the larger the fold amplitude and the fracture density.
Fracture density increases with decreasing distance to fold hinge. Based on outcrop observation and geologic analysis (Fig. 6b ), fracture density is higher in the core than in the limbs of the fault. As per correlation analysis (Fig. 7c ), there is a negative correlation between fracture density calculated using imaging log data and the distance to fold hinge, with R2≈0.95, which means that the smaller the distance to fold hinge, the larger the fold amplitude is.
3. Geologic models and promising areas of FFFBs
3.1. Geologic models of FFFBs
High-energy sedimentary lithofacies is the dominant type of high-quality matrix reservoirs with medium- to coarse-grained sediments and sedimentary structures including trough bedding, parallel bedding, and massive bedding, which can be classified into two types: layer- cake reservoir and blocky reservoir (Fig. 8a ). Late faults, folds, and associated fractures constitute three types of effective fracture bodies: fault-fracture, fold-fracture, and fault-fold bodies. Medium- to high-angle structural fractures (dip more than 30°) within the fault and fold associated fracture bodies contribute the most to the well deliverability, and they are mainly developed in fault-fold, large-scale fault-fracture, and fold-fracture bodies, followed by medium- to small-scale fault-fracture and fold-fracture bodies. Moreover, the higher the density of structural fractures within the fracture body (generally greater than 0.12 fractures/m), the higher the well deliverability is. Based on outcrop and core observations, well evaluation, and matrix-fracture coupling types, gas sweet spots or FFFBs are classified into two types (Table 2 and Fig. 8a ): fault-fold fracture, and matrix storage & permeability. The former can be divided into two subtypes: network fracture, and single structural fracture, and the later can be divided into three subtypes: bedding fracture, low permeability pore, and extremely low permeability pore. The FFFBs with network fracture and single structural fracture are most promising. Among 44 wells deployed targeting T3x2 tight gas reservoirs in the Xinchang structural belt, 11 wells were drilled to penetrate effective FFFBs. The matrix storage & permeability FFFBs can be recovered effectively only when new appropriate technologies are available.
Table 2. Comprehensive evaluation of sweet spots in T3x2 in Xinchang structural belt |
| Type of sweet spots | Reservoir space | Type of promising matrix reservoir | Petrophysical properties | Pore structure | Gas saturation/% | Pore type | |||
|---|---|---|---|---|---|---|---|---|---|
| Permeability/ 10-3 μm2 | Porosity/ % | Median radius/μm | Description | ||||||
| Fault-fold fracture | Network fracture | Structural fractures, bedding fractures, matrix pores | Layer-cake | ≥100 | ≥3 | ≥0.06 | Very good | ≥60 | Porous- fractured |
| Single structural fracture | Structural fractures, matrix pores | Blocky | 10-100 | ≥3 | ≥0.06 | ≥60 | |||
| Matrix storage & permea- bility | Bedding fracture | Bedding fractures, matrix pores | Layer-cake | 0.30-10.0 | ≥3 | 0.02-0.06 | Good | ≥55 | Fractured- porous |
| Low-per- meability pore | Matrix pores | Blocky | 0.03-0.30 | ≥3 | <0.02 | Moderate | ≥50 | Porous | |
| Extremely low permeability pore | Matrix pores | Blocky | <0.03 | ≥3 | <0.02 | Poor | ≥50 | Tight | |
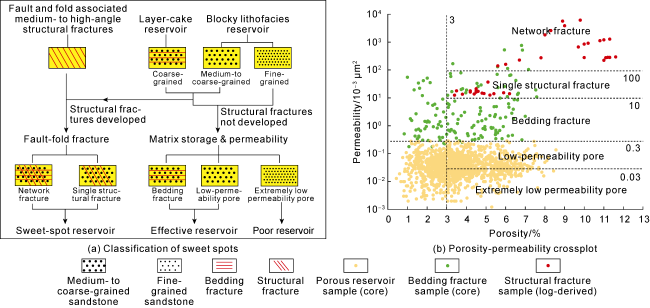
Fig. 8. Classification of sweet spots in T3x2 in Xinchang structural belt. |
The network fracture sweet spots are mainly layer-cake matrix reservoirs superimposed with medium- to high-angle structural fractures (Fig. 8a ), and composed of medium- to coarse-grained sandstones with trough bedding and parallel bedding, the average porosity higher than 3% and the average permeability higher than 100×10-3 μm2 (Table 2 and Fig. 8b ). Owing to well-developed horizontal fractures superimposed with medium- to high-angle structural fractures, this type of sweet spots are favorable for high gas yield, for example, at Wells X2, X851, and X856, with average open-flow potential of 128×104 m3/d. The single structural fracture sweet spots are mainly blocky matrix reservoirs superimposed with medium- to high-angle structural fractures (Fig. 8a ), and composed of medium sandstones with massive bedding and diagonal bedding (Fig. 4d -4e ), the average porosity higher than 3% and the average permeability higher than 10×10-3 μm2 (Table 2 and Fig. 8b ). Horizontal fractures are undeveloped, and medium to high-angle fractures are dominant, among which the vertically extending components are communicated with promising matrix reservoirs. This type of sweet spots is the major contributor to stable and medium yield, for example, at Wells L150 and X601, with average open-flow potential of 22×104 m3/d. All the wells proposed in the new pilot test plan target this type of sweet spots, and reveal the average open-flow potential after volumetric fracturing up to 84×104 m3/d. It is found that network fracture and single structural fracture sweet spots in fault- fold, large-scale fault-fracture and fold-fracture bodies show good quality and contribute higher well deliverability (e.g. well X2) than others, and those in medium- to small-scale fault-fracture and fold-fracture bodies are somewhat satisfactory in terms of quality and well deliverability (e.g. well L150). Moreover, network fracture and single structural fracture sweet spots are mostly composed of medium- to coarse-grained sandstones, with medium- to high-angle structural angles. However, they are not remarkably conducive to improve the poor reservoirs dominated by fine- to silty-grained sandstones and with extremely low physical properties.
The bedding fracture sweet spots are mainly layer-cake matrix reservoirs (Fig. 8a ), which appear at relatively structural highs and contain no medium- to high-angle structural fractures. They are composed of medium- to coarse-grained sandstones with trough bedding and parallel bedding (Fig. 4a -4b ), the average porosity higher than 3% and the average permeability higher than 0.3×10⁻³ μm2 (Table 2 and Fig. 8b ). The density of horizontal fractures is larger than of medium- to high-angle fractures. Pore structure is good, with the median radius of 0.02-0.06 μm (Table 2 ). This type of sweet spots has to be stimulated to obtain a commercial deliverability. For example, Well CG561 achieved a cumulative gas production of 1.1×10⁸ m3 after high-energy gas fracturing. The low-permeability pore sweet spots are mainly medium- to coarse-grained blocky matrix reservoirs (Fig. 8a ), which appear at structural highs and contain no medium- to high-angle structural fractures. They are composed of medium-grained sandstones with massive bedding and diagonal bedding (Fig. 3 ), three levels of porosity (3%, 4%, and 5%), and the average permeability higher than 0.03×10⁻³ μm2 (Table 2 and Fig. 8b ). Pore structure is moderate, with the median radius less than 0.02 μm (Table 2 ). This type of sweet spots cannot be perforated to directly obtain economic gas production but have to be stimulated. Gas production features initial moderate yield and quick decline, for example, at Well X10. The extremely low-permeability pore sweet spots are fine-grained blocky matrix reservoirs (Fig. 8a ). They are mainly composed of sandstones containing no medium- to high-angle structural fractures, with the porosity higher than 3% and the permeability less than 0.03×10⁻³ μm2 (Table 2 and Fig. 8b ). These sandstones are dominated by siltstones and argillaceous sandstones with massive bedding, poor matrix reservoir properties, and undeveloped structural fractures. This type of reservoirs cannot be produced economically using existing technologies.
Geologic model is significant to the research and recovery of deep tight sandstone reservoirs. The model of "high-energy channel reservoirs + fractures + faults" for the Xujiahe Formation in the Sichuan Basin [27] and model of high-medium-high natural fracture density in the vertical direction controlled by faulted anticlines in Keshen gas field, the Tarim Basin [8⇓-10], were effectively used to guide early exploration and development of deep fractured tight sandstones.
Based on the understanding of promising matrix reservoirs and effective fractures in the Xujiahe Formation, we developed a new "coupled facies-fracture" model of FFFBs in the AOI (Fig. 9 ), in which promising lithofacies controlled by sedimentary facies distribute in a band geometry in the lateral direction and in a lens geometry in the vertical direction. Promising lithofacies, as the material basis of gas enrichment, were further reworked by late medium- to high-angle structural fractures associated with faults and folds to improve reservoir permeability. Promising lithofacies coupled with effective fractures constitute reservoir units with relatively high porosity and high permeability, which are the major type of sweet spots.
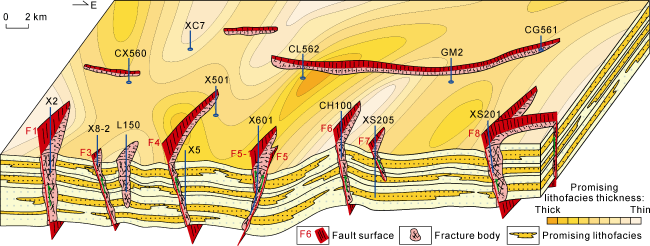
Fig. 9. Geologic model of FFFBs in T3x2 gas reservoirs in Xinchang structural belt. |
As shown in Fig. 9 , major fracture bodies in T3x2 extend in the E-W and S-N directions. By geneses, fracture bodies are classified as fault-fold type at Wells X2 and X601, fault-fracture type at Wells X8-2 and XS205, and fold-fracture type at Well L150. The original lithofacies may be reworked by fractures to improve vertical permeability and thus form a relatively independent coupled fracture-reservoir unit. Natural gas migrated upward along late faults and accumulated in the coupled reservoir unit to form sweet spots of tight sandstone gas. It is difficult to produce reserves in the matrix, which features undeveloped fractures and strong vertical heterogeneity of promising lithofacies, using existing technologies. Different from traditional evaluation of permeable reservoir units, this model uses hierarchical evaluation and coupled fracture-matrix analysis to exhibit a new idea of "step-by-step implementation and production". FFFBs are treated as the major targets of production at the present time and matrix storage & permeability bodies as the potential targets of deliverability.
3.2. Promising prospects
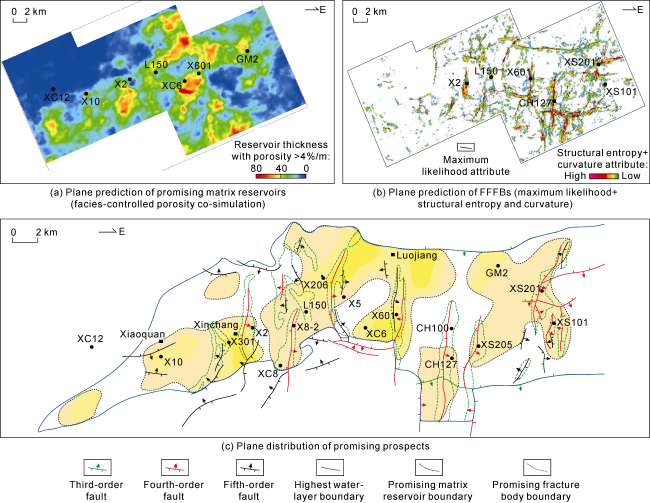
Guided by the geologic model, promising prospects are optimized based on log and seismic data using the following steps: (1) select areas with promising matrix reservoirs; (2) select areas with effective fractures; and (3) take overlaps of these two types of areas as promising prospects. The facies-controlled promising matrix reservoir prediction method, and the effective fracture prediction method consisting of maximum likelihood characterization of faults, structural entropy attribute-based characterization of fault-associated fractures, and positive curvature attribute-based characterization of fold-associated fractures have been developed [28]. The areas with promising matrix reservoirs exhibit abnormal responses from seismic-based reservoir prediction and log-interpreted reservoir thickness larger than 10 m (Fig. 10a ). Within these areas, a thicker reservoir is more promising. The areas with effective fractures exhibit abnormal seismic structural entropy attribute (Fig. 10b ) within the range less than 400 m away from the hanging wall or in fold core. The overlaps of these two types of areas are predicted to be promising prospects.
Fig. 10. Promising prospects in T3x22 in Xinchang structural belt. |
Based on the seismic prediction of promising matrix reservoirs (Fig. 10a ) and the distribution of log-interpreted reservoirs, we took the layer T3x22 as an example to predict the areas with promising matrix reservoirs, as shown in Fig. 10c , where black dotted line represents the distribution range of reservoirs thickness with porosity higher than 4%, which is plotted from the reservoirs predicted referring to facies-controlled porosity co-simulation (Fig. 10a ). Gradually varied contour represents the distribution range of reservoirs thickness with porosity higher than 4% derived from log interpretation. Bounded by sands pinch-out in XC12 well field in the west, effective matrix reservoirs mainly distribute in L150, X601, and GM2 well fields, where the reservoirs with the porosity higher than 4% are more than 40 m thick (Fig. 10c ). The areas with effective fractures were predicted in accordance with FFFB prediction (Fig. 10b ) as well as drilling and core data, as shown in Fig. 10c , where green dotted line represents the distribution range of effective fractures, which is plotted from the plane prediction of FFFBs by maximum likelihood + structural entropy and curvature (Fig. 10b ), and the development of fractures in actual wells. Specifically, maximum likelihood attribute is used to characterize faults, and structural entropy and positive curvature to characterize fault and fold associated fractures. Effective fractures mainly occur in L150 and X601 well fields close to some major faults F1-F9 (Fig. 10c ). There are mainly structural fractures in L150 well field, and fractured layers were interpreted to be 15 m thick using log data. There are also structural fractures with larger density in X601 well field than in L150 well field, and fractured layers were interpreted to be 65 m thick using log data.
Promising prospects were optimized based on the areas with promising gas-bearing matrix reservoirs and effective gas-bearing fracture bodies (Fig. 10c ), as well as the highest water-layer boundaries. The highest water-layer boundaries are structure contours in the north and south, and sands pinch-out boundary in the west which is above the highest water-layer boundary. The whole internal area is considered to contain gas with low water-bearing risks [6]. It is found that X601 and L150 well fields are the most promising prospects with promising gas-bearing matrix reservoirs and effective gas-bearing fracture bodies overlapped, followed by XS201 and XS101 well fields. Within the overlapped area, the promising prospects are divided into fault-fracture, fold-fracture and fault-fold bodies depending upon the types of FFFBs. Specifically, fault-fold, large-scale fault-fracture, and fold-fracture bodies are most promising, for example, in X601 and X2-X301 well fields. Moreover, fault-fold fracture sweet spots are assessed to be of natural deliverability and contain recoverable reserves, and the matrix storage & permeability sweet spots are reserves replacement targets which are worthy of further study.
4. Geologic significance
The T3x2 in the Xinchang structural belt is a deep tight sandstone gas reservoir with the largest proved reserves in the Sichuan Basin, but it has not been effectively recovered. Supported by FFFB theory and techniques, two appraisal wells, X8-2 and XS101 targeting fault-fold fracture sweet spots, were deployed in 2018-2020, and both yielded economic gas flow. A pilot test program with the designed annual gas deliverability of 3×10⁸ m3 was drafted in 2021, by which 18 wells would be deployed. By December, 2022, the program was successfully implemented with daily gas output of 155×104 m3 from 7 wells put into production and the highest daily gas output exceeding 50×104 m3 per well, which remarkably surpassed the expectations. The pilot-test objective of annual deliverability of 3×10⁸ m3 was fulfilled ahead of schedule, laying a solid foundation for subsequent planning of annual deliverability of 10×108 m3.
The breakthrough in T3x2 tight sandstone gas reservoir in the Xinchang structural belt was benefited from two new ideas. The first is the new geologic model of sweet spots. The previous studies proposed two types of reservoirs: matrix and fractured, in the AOI, but did not classify them for evaluation and production. In addition, routine evaluation was mostly based on matrix reservoir properties as key indexes. The new model of FFFB is of instructive significance to sweet-spot evaluation in this area. The second is new techniques of sweet-spot prediction and stimulation [6,28], including the prediction of fracture body outline and internal area, geologic-engineering sweet spotting, and fracturing stimulation, which were established after sustained efforts and have been tested to be feasible to improve well deliverability. Research findings were used in a number of areas, such as Tongnanba, Yuanba, Puguang, Tongjiang, and Dongfengchang, in the Sichuan Basin. The exploration and development of the Xujiahe Formation guided by new theory and techniques were performed in the whole basin.
5. Conclusions
A FFFB refers to faults, folds and associated fractures reservoirs. In petroleum exploration and development, a FFFB is a unit with fractures and pores which are connected in the original formation state or after being modified by folding and rifting, and can function for hydrocarbon migration and accumulation.
Promising matrix reservoirs are classified into two types, i.e. layer-cake lithofacies with horizontal fractures and blocky lithofacies without horizontal fractures. Effective fracture bodies are classified into three types, i.e. fault-fracture body, fold-fracture body, and fault-fold body.
Fracture density is higher in the hanging wall than that in the foot wall. Fracture density increases with fault throw and decreasing distance to fault surface. Fracture density increases with fold amplitude, or decreasing aspect ratio, and decreasing distance to fold hinge.
Based on matrix-fracture coupling types, FFFB models are classified into two types, i.e. fault-fold fracture and matrix storage & permeability. The former can be divided into two subtypes: network fracture and single structural fracture. The later can be divided into three subtypes: bedding fracture, low permeability pore, and extremely low permeability pore. The FFFBs with network fracture and single structural fracture are most promising.
Acknowledgments
We thank Sinopec Southwest Oil & Gas Company for data support and the team specializing in the Xujiahe Formation at Sinopec Petroleum Exploration & Production Research Institute for technical support.