

Introduction
Oil saturation is a core indicator for evaluating shale oil sweet spots [1-2]. Shale is characterized by low porosity, fine grain size, diverse mineral components, high clay and organic matter contents and varied fluid occurrence states [3-4]. These properties make it difficult to conduct rock-electrical experiments that focus on conductive mechanisms and influencing factors [5]. Traditional conductivity models (e.g. Archie's law) perform poorly when applied to shale formations [6], posing significant challenges to the interpretation of shale oil saturation using conventional electrical logging methods [1,6-7].
Compared with sandstone reservoirs, shale reservoirs are distinctive for high abundance of organic matter and clay minerals [6]. Organic matter (OM) is typically hydrophobic and non-conductive at the low maturity stage [8-9], but exhibits certain conductivity due to graphitization during the high to over-maturity stages [10-11]. Clay minerals commonly exist as aggregates [5,12], which exhibit adjacent or interconnected structures and interlayers rich in bound water [13]. Cation adsorption layers and diffusion layers formed on clay surfaces [14-15] endow clay-bound water with a strong conductive capacity [13-16], which generally results in low resistivity in lacustrine shale forma-tions [5,9-10]. Previous studies have developed water saturation models for argillaceous sandstone reservoirs that account for clay-bound water conductivity, such as the Dual-Water [13], Three-Water [16], Simandoux [17], and Total-shale [18] models. These models have achieved certain success in the oil saturation interpretation for shale reservoirs [5,19]. Other researchers have established conductivity models based on volume conservation laws, incorporating the effects of conductive minerals, clay mineral content and total organic carbon (TOC) [9-11]. These models generally acknowledge that the conductivity of clay-bound water is related to ion concentration and formation temperature [14-15], and exhibits either linear [5,10-11,17-18] or power-law [9,16] relationships with clay mineral content or bound water content. However, none of these models consider the differential impact of OM on the conductivity of clay-bound water. OM often fills between the clay mineral interlayers or clay aggregates, forming OM-clay complexes [12]. These complexes play an important role in hydrocarbon generation and clay mineral transformation [20]. During hydrocarbon generation, OM containing polar functional groups (e.g., humic substances) or macromolecular hydrocarbons can adsorb onto the surfaces or fill the interlayers of clay minerals [21], altering the clay-bound water volume and cation exchange capacity [8]. If OM envelops clay aggregates, it may further affect the conductive pathways of clay-bound water [22]. The development of OM-clay complexes varies across different shale types or even at different diagenetic stages for the same shale, and the influence of OM on the clay-bound water conductivity also exhibits significant variations. Consequently, relying solely on clay mineral content or bound water volume to characterize the conductivity of clay-bound water may introduce substantial errors.
This study develops a novel shale oil saturation model that comprehensively accounts for the influence of OM on the clay-bound water conductivity. By introducing a bound water cementation index to quantify the impact of OM, and calibrating model parameters through sealed coring and two-dimensional nuclear magnetic resonance (NMR) experiments, the conductive mechanisms and rock-electric relationships in lacustrine shales are investigated. The study provides theoretical support for the interpretation of oil saturation in lacustrine shale formations.
1. Regional overview and experimental methodology
The Changling Sag in the Songliao Basin is a key exploration area for shale oil of Jilin Oilfield [23]. It is bounded by the Songhua River to the north and is adjacent to the Gulong Sag (Fig. 1). The first member of the Cretaceous Qingshankou Formation (referred to as K2qn1) was deposited during a large-scale lacustrine transgression period of the basin [12]. The lithology predominantly consists of dark mud-shale, interbedded with thin siltstone layers and shell limestone layers (Fig. 2). Controlled by the southwestern and western provenance systems (Fig. 1), the shale oil type transits from interbedded shale oil in the southwest to pure mud-shale oil in the northeast [24]. The K2qn1 shale in the Changling Sag has organic matter abundance greater than 1% generally, with kerogens primarily classified as types I-II2. The OM maturity ranges from 0.80% to 1.35%, indicating an overall period of intense hydrocarbon generation. These conditions provide a geological foundation for shale oil accumulation and enrichment [23-24]. Multiple wells have yielded industrial shale oil flow in the exploration area [23], demonstrating a promising potential of shale oil.
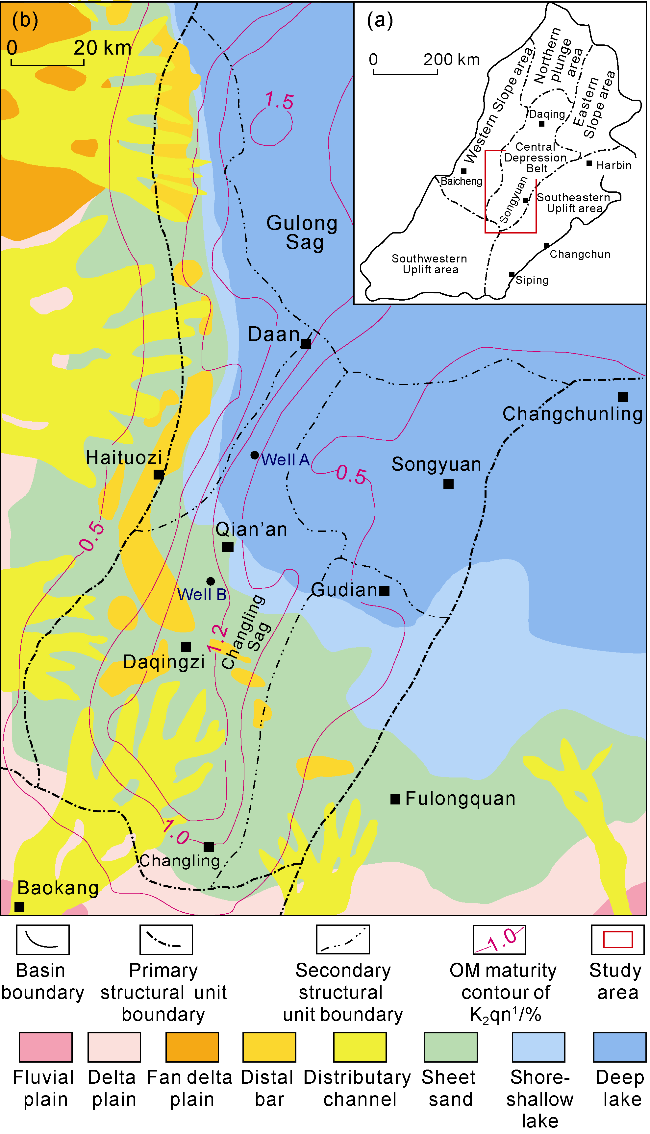
Fig. 1. Structural location of the Changling Sag in the southern Songliao Basin and sedimentary facies of K2qn1. |
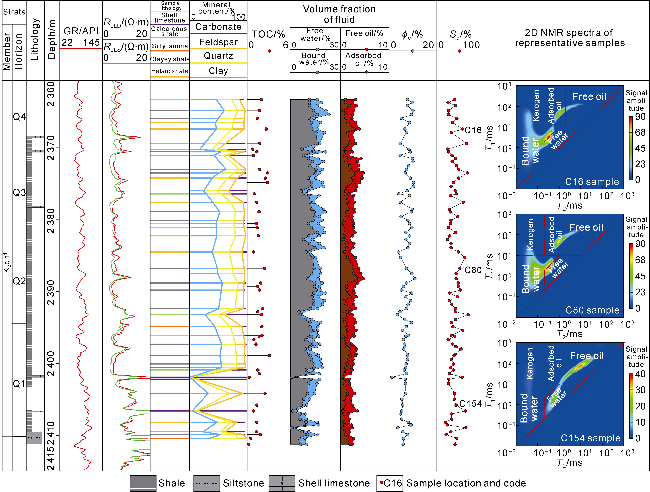
Fig. 2. Measurement results of cores from K2qn1 in Well A in the southern Songliao Basin. |
Core samples for this study were obtained from K2qn1 in wells A and B in the Changling Sag (Fig. 1), with 94 and 46 cores, respectively. Sealed coring and cryopreservation of cores in liquid nitrogen were used to minimize fluid loss [25]. Laboratory analyses were conducted to determine petrophysical properties, oil-bearing property, lithology and geochemical characteristics, following the procedures below:
(1) Upon retrieval from frozen storage, a portion of rock samples were immediately drilled out for NMR testing to obtain data on petrophysical properties and oil contents. One-dimensional transverse relaxation time (T2) spectra were acquired at 2-min intervals during the initial phase. After signal stabilization (complete thawing), two-dimensional NMR testing was performed. Based on previously established NMR fluid identification charts [25], free oil, adsorbed oil, free water and bound water were distinguished. By measuring the mass and volume of the samples and utilizing the conversion relationship between NMR signal amplitudes of oil/water (under identical acquisition parameters) and fluid mass [26], the volume fractions of different fluids were calculated (Fig. 2). Here, shale effective porosity (ϕe) is defined as the sum of the volume fractions of free water, adsorbed oil and free oil, and oil saturation (So) is defined as the ratio of the pore volume occupied by free oil and adsorbed oil to the effective pore volume [27].
(2) Samples from the same core segment were selected for petrological and geochemical characterization. Thin section preparation and microscopic identification were employed to identify shale laminar structures and lithology. These methods were combined with X-ray diffraction (XRD) analysis to determine the major mineral composition and establish lithological nomenclature. Samples were pulverized to a particle size of 150 μm (100 mesh), and total organic carbon content was measured with a carbon-sulfur analyzer.
All aforementioned experiments were conducted at the National Key Laboratory of Deep Oil and Gas (China University of Petroleum (East China)). The experimental results are presented in Fig. 2. After depth-matching the core data, the log values (e.g., resistivity) at the sample depths were extracted to support research on factors influencing rock electrical properties and conductivity mechanisms.
2. Relationships among shale mineral composition, fluid types and electrical properties
XRD analysis (Fig. 2) indicates that the K2qn1 shale in the Changling Sag contains minerals dominated by clay minerals (0.6%-63.3%, or average 41.2%) and quartz (0.6%-47.8%, or average 25.6%), followed by feldspar (0-23.3%, or average 14.4%), and carbonate (mainly calcite, 0-98.8%, or average 16.5%), as well as pyrite present in a low abundance [27]. Based on mineral composition and lamina types, the lithologies in K2qn1 are primarily classified as argillaceous laminated clayey shale (Type A), argillaceous laminated felsic shale (Type B), silty laminated felsic shale (with silty laminae proportion greater than 10%), calcareous shale and shell limestone (Fig. 3), as well as minor argillaceous siltstone. Among these, Type A and B are relatively well-developed (Fig. 2), while other lithologies exhibit low proportions and similar log responses (high resistivity, low acoustic interval transit time), characterized by high proportions of "rigid frameworks" such as shell or silty laminae. Therefore, from the perspectives of framework type and log recognizability, silty laminated shale, calcareous shale, shell limestone, and argillaceous siltstone are classified into a single category (Type C). The TOC values of shale samples range from 0.27% to 3.12%, with an average of 1.64% (Fig. 2). TOC shows a gradual decreasing trend from Type A (average 1.92%) to Type C (average 1.32%). Microscopic observations reveal that OM occurs in two forms: sedimentary and migratory. The sedimentary OM appears as bands or clusters (Fig. 3f), while the migratory OM (or bitumen) fills between clay/pyrite crystals and in intergranular pores (Fig. 3g, 3h). Particularly, the filling of OM within clay mineral interlayers is relatively common.
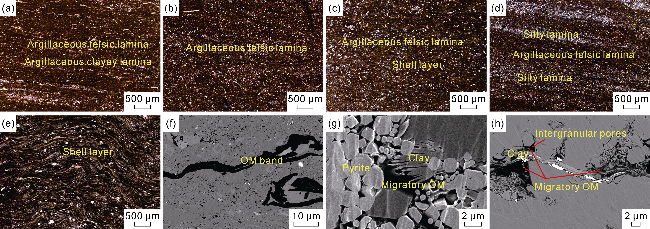
Fig. 3. Microscopic characteristics of lithologies and OM of the K2qn1 shale. (a) Clayey shale, Sample C34, 2 372.98 m; (b) Felsic shale, Sample C50, 2 377.55 m; (c) Calcareous shale, Sample C46, 2 376.40 m; (d) Silty laminated felsic shale, Sample C76, 2 384.50 m; (e) Shell limestone, Sample C22, 2 369.38 m; (f) OM band, calcareous shale, Sample C20, 2 369.38 m; (g) Migratory OM filling intercrystalline pores between pyrite and clay minerals, felsic shale, Sample C38, 2 374.21 m; (h) Migratory OM filling intergranular pores, silty laminated felsic shale, Sample C148, 2 404.16 m. |
The shale resistivity exhibits a significant negative correlation with clay content (R2=0.64) (Fig. 4a), indicating that the conductivity of shale is primarily controlled by clay content. However, when clay content is high (as observed in argillaceous laminated felsic and clayey shales), this correlation weakens (R2<0.02), and the influence of TOC on resistivity becomes relatively more pronounced (R2=0.73) (Fig. 4b). By constructing a “clay content/TOC” parameter to quantify the effect of OM on clay conductivity, it was found that the resistivities of all three shale types show a significant negative correlation with "clay content/TOC" (R2>0.77, Fig. 4c), with higher correlation coefficients than those of resistivity-TOC or resistivity-clay content. This demonstrates that shale resistivity is jointly controlled by clay content and TOC. Moreover, under identical clay content conditions, higher TOC corresponds to greater resistivity, revealing that OM partially mitigates the conductivity of clay.
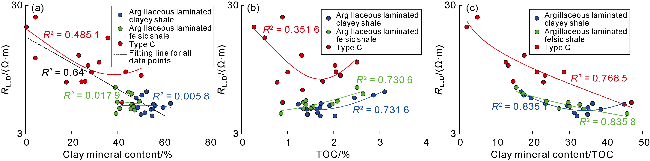
Fig. 4. Correlation between clay mineral content, TOC and resistivity in the K2qn1 shale. |
Using sealed core samples and 2D NMR tests, the volume fractions of different fluids, porosity, and saturation were determined (Fig. 2 and Table 1). Type C exhibits lower porosity and higher oil saturation. Argillaceous laminated felsic shales show the highest free oil volume fraction, while clayey shales have the highest adsorbed oil and bound water volume fractions (Table 1). Shale resistivity shows a relatively weak correlation with effective porosity, oil saturation, free oil volume fraction and free water volume fraction (Fig. 2), but exhibits a significant negative correlation with bound water volume fraction (R2=0.73, Fig. 5a). This is attributed to the fact that bound water primarily occurs on clay mineral surfaces or interlayers, and its content is strongly correlated with clay content. Clay-bound water contributes significantly to excess conductivity [14-15]. Similar to the resistivity-clay content and resistivity-TOC correlations, the correlation between resistivity and bound water volume fraction also weakens for argillaceous laminated felsic and clayey shales (Fig. 5b). In such cases, a moderate positive correlation is observed between resistivity and adsorbed oil volume fraction (R2>0.4, Fig. 5c), indicating that adsorbed hydrocarbons also inhibit the conductivity of clay-bound water. Non-conductive OMs (including hydrocarbons) that are adsorbed on clay mineral surfaces through physical or chemical interactions [21] reduce the contact area between the electrical double layer (EDL) and free water, impair the connectivity of the conductive network of bound water, and hinder ion migration within the EDL [22], thereby suppressing the conductivity of clay-bound water. Consequently, the influence of OM or adsorbed hydrocarbons must be considered when constructing shale conductivity models.
Table 1. Measurement results of petrophysical properties, oil saturation, and fluid volume fraction for various lithologies |
| Lithology | Effective porosity/% | Oil saturation/% | Fluid volume fraction/% | |||
|---|---|---|---|---|---|---|
| Free oil | Adsorbed oil | Free water | Bound water | |||
| Type C | 1.2-11.0 6.1 | 24.8-69.8 43.4 | 0.4-2.9 1.2 | 0.3-3.8 1.3 | 0.5-6.4 3.6 | 1.1-12.6 7.8 |
| Argillaceous laminated felsic shale | 4.1-9.8 7.6 | 20.4-59.1 38.9 | 1.0-2.1 1.7 | 0.6-2.8 1.2 | 2.0-7.1 4.8 | 9.8-16.4 11.8 |
| Argillaceous laminated clayey shale | 5.3-10.2 7.7 | 27.0-68.0 42.0 | 1.0-2.1 1.4 | 0.7-3.2 1.7 | 2.2-7.5 4.6 | 11.5-16.3 14.2 |
Note: Numerator represents the value range and denominator represents the average value |
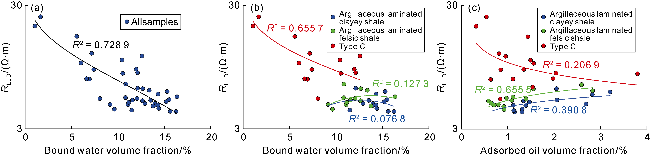
Fig. 5. Correlation between bound water, adsorbed oil volume fraction and resistivity in the K2qn1 shale. |
3. Shale oil saturation model incorporating the effects of OM
3.1. Model construction
Scanning electron microscopy (SEM) observations of contacts between shale components, reservoir space types, and fluid occurrences reveal that lacustrine shales primarily develop two types of conductive networks [27]: matrix free water network and clay-bound water network. Minerals such as quartz, feldspar, calcite (mainly in ostracod bands), and dolomite form the “rigid framework” of shales [26], which is particularly prominent in silty laminae and shell laminae (Fig. 3c-3e). Intergranular pores, intergranular dissolution pores, and intercrystalline pores are developed between these framework particles or minerals (Fig. 6a, 6b). Meanwhile, a large number of intragranular dissolution pores appear within feldspar and dolomite minerals (Fig. 6b). These pores provide storage spaces for free oil and free water, and the presence of free water further enables ion conduction, which acts as the major conductive mechanism [27]. These pores are locally filled with OM or clay minerals (Fig. 6b). OM can be considered equivalent to non-conductive minerals [8], reducing the pathways for free water ion conduction. The clay minerals filling the pores are low in content and mostly scattered; thus, the influence of such dispersed clay on the matrix free water conductivity is negligible.
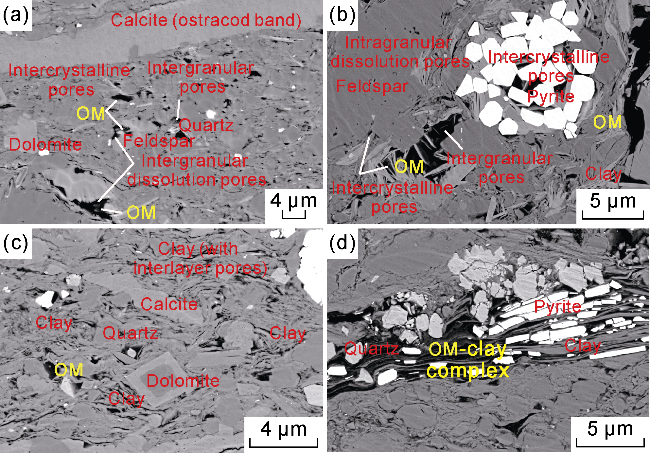
Fig. 6. Microscopic characteristics of pores in the K2qn1 shale. (a) Rigid framework composed of dolomite, felsic minerals and calcite bands, with intergranular dissolution pores, intergranular pores, and intercrystalline pores developed, Sample C2, 2 363.28 m, felsic shale. (b) Rigid framework consisting of felsic particles, with intergranular pores, intragranular dissolution pores and pyrite intercrystalline pores developed, some intergranular pores filled with OM or clay minerals, Sample C38, 2 374.21 m, felsic shale. (c) Developed clay aggregates with sporadically distributed quartz and dolomite, clay interlayer pores developed and partially filled with OM, Sample C20, 2 369.38 m, calcareous shale. (d) OM-clay complex formed by the OM filling the clay interlayers, Sample C148, 2 404.16 m, silty laminated felsic shale. |
In shale formations, clay minerals commonly exist in the form of aggregates (Fig. 6c, 6d). Cations adsorbed on their surfaces form an electrical double layer, and cation exchange occurring within this EDL or between the diffuse layer and free water imparts clay-bound water with strong excess conductivity [5,10]. This constitutes another major conductive mechanism in shale. Dolomite and quartz microcrystals are sporadically distributed among these aggregates (Fig. 6c), providing a certain protective effect on interlayer pores within clay minerals [12]. OM is often adsorbed on clay interlayers or fills the spaces between aggregates, forming OM-clay complexes [28] (Fig. 6d), which considerably influence the conductivity of clay-bound water. On one hand, adsorbed OMs or hydrocarbons within the interlayers occupy the internal crystalline lattices of clay minerals [21,29], reducing the content of clay-bound water. They also form a barrier between the cation diffuse layer and free water, impairing cation migration and exchange and thereby weakening the conductivity of clay-bound water. On the other hand, the filling of OM blocks conductive pathways between clay aggregates [22], destroying the connectivity of this conductive network.
In shale oil reservoirs, two types of conductive networks operate in parallel. Therefore, the formation conductivity can be expressed as:
$C_{\mathrm{t}}=C_{\mathrm{ma}}+C_{\mathrm{sh}}$
The conductivity of the matrix free water follows Archie's formula [30], expressed as:
$C_{\mathrm{ma}}=C_{\mathrm{w}} \phi_{\mathrm{e}}{ }^{m} S_{\mathrm{w}}{ }^{n}$
The conductivity of clay-bound water (Csh) is related to the unit clay-bound water conductivity (Ccw) and the volume fraction of clay-bound water (ϕcbw) [13-14]. Considering the influence of OM on the ion exchange capacity within the diffuse layer and the connectivity of the conductive network, two parameters are introduced: the clay-bound water cementation index (msh) [16] and the proportion of conductive bound water (Swb). With reference to Archie's formula, the clay-bound water conductivity can be expressed as:
$C_{\mathrm{sh}}=C_{\mathrm{cw}} \phi_{\mathrm{cbw}}{ }^{m_{\mathrm{sh}}} S_{\mathrm{wb}}$
In shaly sandstones or low-resistivity oil layers, msh traditionally reflects the influence of pore structure or clay type on the conductivity of clay-bound water [16]. In this study, msh is adopted to represent the effect of adsorbed hydrocarbons/OM on the cation exchange capacity within the EDL of shale clay. The adsorption of OM within clay interlayers reduces the extent of EDL and diminishes the contact area between the diffuse layer and free water, thereby weakening the cation exchange capacity. A higher value of msh indicates a more significant suppressive influence of OM on the conductivity of clay-bound water. Swb denotes the proportion of connected conductive bound water to the total bound water content, characterizing the impact of OM on the conductive network connectivity among clay aggregates. A higher Swb value implies less disruption caused by OM to the conductive network. When the influence of hydrocarbons/OM on the EDL conductivity of clay is relatively weak (msh approaching 1), Eq. (3) becomes consistent with the clay conductivity term in the Total-shale model [11,18]. Conversely, when the impact of OM on the connectivity of the bound water conductive network is minor (Swb approaching 1), Eq. (3) becomes equivalent to the clay-bound water conductivity term in the three-water model [16].
When the adsorption sites on clay surfaces are fully occupied by OMs or hydrocarbons, the conductive network of the clay EDL can be considered ineffective. If the maximum OM adsorption capacity per unit mass of clay is denoted as k, the parameter Swb can be calculated from the clay content Vsh (mass percentage) and TOC using the formula: Swb=(Vsh−TOC/k)/Vsh. In the study area, a linear relationship passing through the origin was observed between clay content and the specific surface area of the shale (Fig. 7a). Based on this relationship, the specific surface area per gram of clay minerals was estimated to be 59.2 m2. The expandable interlayer spacing of montmorillonite ranges from 1 nm to 2 nm [20], which is less than the adsorption layer thickness of hydrocarbons on clay surfaces [21]. Therefore, the maximum adsorption thickness of OMs/hydrocarbons in clay interlayers was assumed to be 1 nm (half of the interlayer spacing). Using a typical OM density range of 1.4-1.6 g/cm³, the maximum OM adsorption capacity per gram of clay minerals in the area was calculated to be 82.6-94.4 mg, i.e., k is 0.082-0.094. When k=0.09, the calculated Swb shows a linear correlation with the experimentally measured Sw (R2=0.69, Fig. 7b), with a zero-crossing slope close to 1. Therefore, Sw can be used to approximate Swb. Substituting Eqs. (2) and (3) into Eq. (1) yields the final expression for shale conductivity:
$C_{\mathrm{i}}=C_{\mathrm{w}} \phi_{\mathrm{e}}{ }^{m} S_{\mathrm{w}}{ }^{n}+C_{\mathrm{cw}} \phi_{\mathrm{cbw}}{ }^{m_{\mathrm{sh}}} S_{\mathrm{v}}$
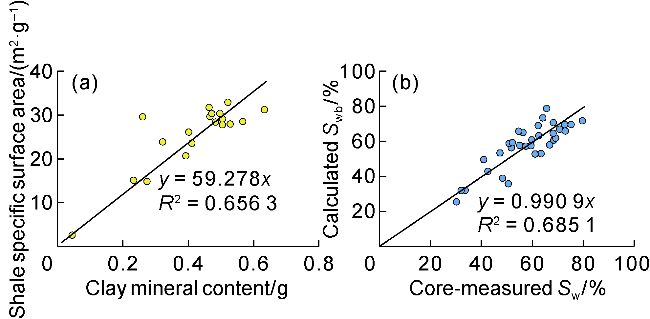
Fig. 7. Correlations between clay content and specific surface area, and between calculated Swb and core-measured Sw. |
3.2. Parameter solution
Core samples of siltstone or argillaceous siltstone from K2qn1 were selected for rock-electric experiments [30] to yield a matrix pore cementation index of 1.5 and a saturation index of 2.0. Based on parameters such as ϕe, Sw, and ϕcbw obtained from sealed core tests, and combined with the RLLD log values (i.e., 1/Ct) corresponding to the sample depth points, the msh value was inversely calculated using Eq. (4). In the calculation, a Cw value of 8.33 S/m was selected, and referring to the measurements by Clavier et al. [13-14], a Ccw value of 6.8 S/m was adopted.
The msh value ranges from 1.10 to 2.31, with an average of 1.72, and exhibits a significant positive correlation with effective porosity (R2>0.77, Fig. 8a). Previous studies have shown that pore development in lacustrine shale of K2qn1 is jointly controlled by moderate OM abundance, high felsic mineral content and carbonate laminae [26]: moderate TOC provides acidic fluids for dissolution [20], while excessively high TOC increases rock plasticity; high felsic mineral content and carbonate laminae form a rigid framework [12], which both preserves pores and provides soluble minerals. These factors also collectively influence msh. As TOC increases, msh initially rises gradually, then stabilizes, and eventually shows a slight decreasing trend (Fig. 8b). This indicates that a higher msh value is not simply associated with more OM abundance, but rather with a moderate TOC level that supports greater development of rigid framework and pores, creating conditions for OM adsorption into clay interlayers, thereby strengthening the impact of OM on clay-bound water conductivity. Argillaceous laminated clayey and felsic shales show similar msh-ϕe correlations, and under the same porosity conditions, their msh values are significantly lower than those of Type C (Fig. 8a). This is primarily due to the lower proportion of rigid framework (e.g. silty or shell laminae, Fig. 3a and 3b) and relatively higher clay content (exceeding 40%) in these two lithotypes. According to the comparison of clay minerals in different regions of the same sample (Fig. 9), when clay aggregates are surrounded by a greater abundance of rigid minerals such as quartz or dolomite, the adsorption or filling of OMs/hydrocarbons in clay interlayers is more substantial (Fig. 9a). Conversely, interlayer pores in clay are underdeveloped, and only a small number of these pores are filled or adsorbed by OM near the rigid framework (Fig. 9b).
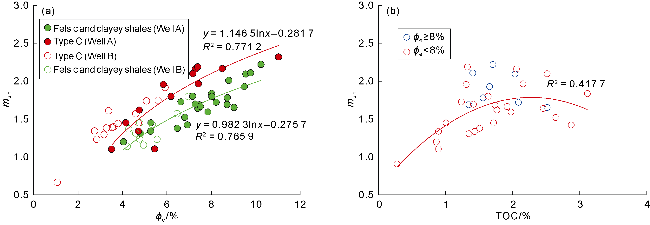
Fig. 8. Correlation between bound water cementation index and effective porosity or TOC (data in Fig. 8b are from Well A). |
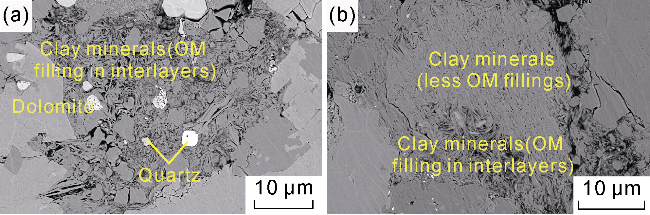
Fig. 9. OM filling heterogeneity of clay minerals. (a) Rigid minerals such as quartz and dolomite developed between clay aggregates, with significant OM filling in clay interlayers, Sample C166, 2 409.50 m, calcareous shale; TOC of 1.31%, clay content of 23.28%. (b) Local OM filling in clay interlayers, with underdeveloped rigid minerals between clay aggregates, Sample C148, 2 404.16 m, silty laminated felsic shale; TOC of 2.52%, clay content of 32.15%. |
Based on different lithologies, calculation models for msh were established to be functions of effective porosity (considering that the cementation index is greater than 1). The expressions for Type C and for argillaceous laminated felsic and clayey shales are given respectively as follows:
$m_{\mathrm{sh}}=\max \left\{1,1.1465 \ln \phi_{\mathrm{e}}-0.2817\right\}$
$m_{\mathrm{sh}}=\max \left\{1,0.9823 \ln \phi_{\mathrm{e}}-0.2757\right\}$
4. Rock-electric relationship of lacustrine shale
Based on measured ϕe, ϕcbw and Sw values, and lithology of sealed core samples, msh was calculated using Eqs. (5) and (6). The theoretical conductivity Ct of the samples was then derived via Eq. (4) and compared with the conductivity (1/RLLD) corresponding to the sampling depth points to validate the model accuracy. The results indicate a strong positive correlation (R2=0.81, Fig. 10) between the theoretically simulated conductivity and the log-derived conductivity, with the regression line passing through the origin and a slope close to 1. This demonstrates that the proposed conductivity model accurately represents the conductive characteristics of lacustrine shale in K2qn1.
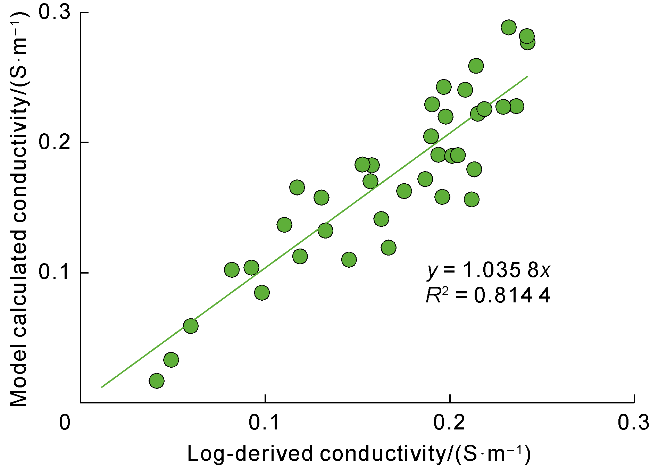
Fig. 10. Comparison between theoretically model calculated conductivity and log-derived conductivity. |
Using Eq. (4), the conductivities of matrix free water and clay-bound water were calculated separately to analyze the contributions of these two conductive mechanisms (Fig. 11). Overall, the conductivity of clay-bound water in types A and B shales is higher than that in Type C lithology, while the distribution ranges of matrix free water conductivity are similar across all three types (Fig. 11). Therefore, the differences in shale resistivity are primarily determined by the conductivity of clay-bound water (Fig. 5a). For types A and B shales, the contribution of clay-bound water conductivity is generally greater than that of matrix free water conductivity. When TOC values are similar, an increase in effective porosity leads to a higher msh value, resulting in decreased clay-bound water conductivity and increased matrix free water conductivity (Fig. 11). However, the change in formation resistivity remains relatively small (approximately 5 Ω∙m). As TOC increases, the inhibitory effect of OM on clay-bound water conductivity strengthens, reducing clay-bound water conductivity and increasing shale resistivity (Figs. 4b and 11).
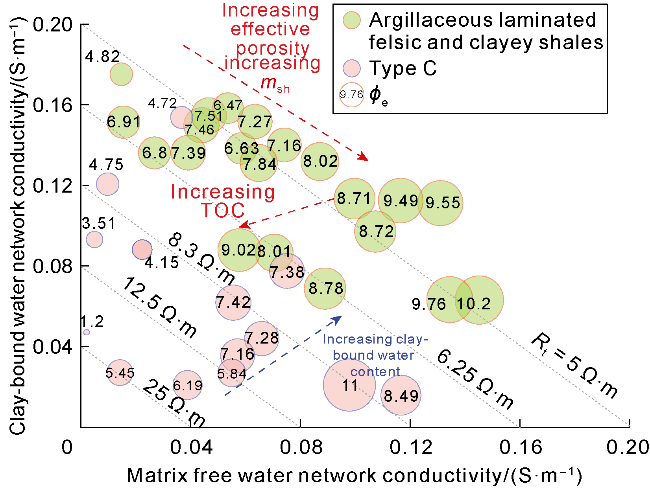
Fig. 11. Relationship between the conductivities of two conductive mechanisms in the K2qn1 shale. |
For Type C lithology, the contributions of the two conductive mechanisms are comparable (Fig. 11). An increase in effective porosity enhances the contribution of matrix free water conductivity, while a higher bound water content reduces the rock resistivity. These observations demonstrate that the clay-bound water conductivity dominates the resistivity of shale formations, while the relative contributions of the two conductive mechanisms are jointly influenced by effective porosity and msh. For shales with the same resistivity, the proportional contributions of the two conductive mechanisms may differ entirely, corresponding to distinct pore space and fluid types.
The established conductivity model was applied to analyze the factors influencing the formation factor (F) and resistivity increase ratio (I) in lacustrine shales. In accordance with Archie's law [30], the formation factor and resistivity increase ratio are defined as follows:
$F=R_{\mathrm{o}} / R_{\mathrm{w}}=1 / \phi_{\mathrm{e}}^{m}$
$I=R_{\mathrm{t}} / R_{\mathrm{o}}=1 / S_{\mathrm{w}}{ }^{n}$
Using measured parameters such as ϕe, ϕcbw, and msh of core samples, the resistivity of fully water-saturated rock (Sw=1) was calculated via Eq. (4), and the formation factor (F) was subsequently derived using Eq. (7). The relationship between F and ϕe in lacustrine shales exhibits considerable scatter (Fig. 12a), with F increasing as ϕe rises, corresponding to a progressive increase in the Archie cementation index (m) from 1.00 to 1.45. This phenomenon is primarily influenced by the conductive mechanism of clay-bound water: when effective porosity is low, the contribution of clay-bound water conductivity dominates (Fig. 11), resulting in a lower m value; otherwise, the m value rises.
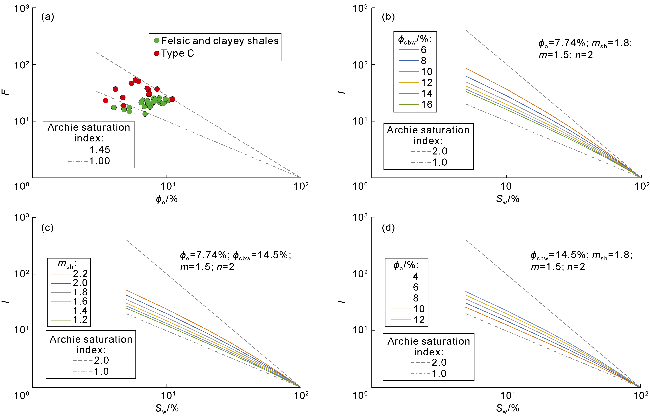
Fig. 12. Comparisons of influencing factors on formation factor and resistivity increase ratio for lacustrine shale. |
Fig. 12b-12d illustrate the influences of bound water volume fraction (ϕcbw), bound water cementation index (msh), and effective porosity (ϕe) on the resistivity increase ratio (I). In the double-logarithmic coordinate system, the relationship between I and Sw exhibits a downward-curving trend (Fig. 12b), deviating from the linear trend predicted by Archie's law in sandstone reservoirs. This discrepancy is primarily attributed to the conductivity of clay-bound water [9]. As ϕcbw increases, the contribution of clay-bound water conductivity becomes more significant, leading to a gradual decrease in I corresponding to Sw (Fig. 12b). Given constant ϕcbw, an increase in msh reduces the conductivity of clay-bound water, resulting in a higher I (Fig. 12c). With increasing ϕe, the contribution of matrix free water conductivity becomes more pronounced, also causing I to gradually increase (Fig. 12d). Therefore, I is jointly controlled by ϕe, ϕcbw, and msh. Higher ϕe, lower ϕcbw, and larger msh values collectively lead to a higher resistivity increase ratio.
5. Application
Taking Well A of K2qn1 in the Changling Sag, Songliao Basin, as an example, the proposed saturation model was validated, and its calculation results were compared with those derived from Archie's law [30] and the Total-shale model [11] (Fig. 13). The following steps were used to calculate the new water saturation values:
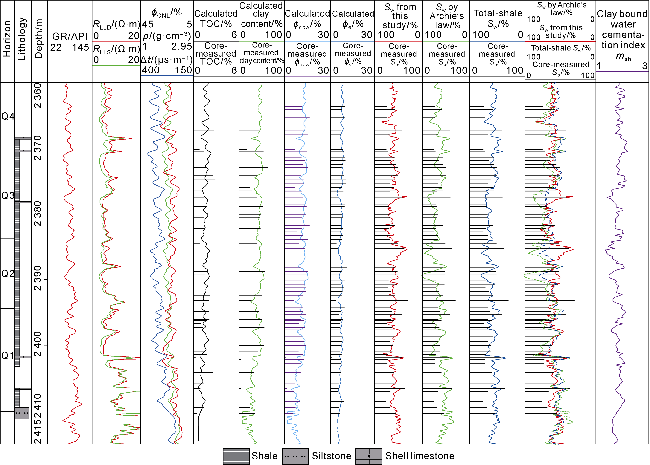
Fig. 13. Calculated oil saturation of K2qn1 in Well A of Changling Sag, Songliao Basin. |
(1) Based on measured effective porosity and bound water volume fraction, and well log data, quantitative models for key parameters were established:
$\phi_{\mathrm{e}}=0.4144 \phi_{\mathrm{CNL}} / \ln \left(R_{\mathrm{LLD}}\right)+2.5491$
$\phi_{\mathrm{cbw}}=13.3-4.44 \ln \left(R_{\mathrm{LLD}}\right)+0.28 \phi_{\mathrm{CNL}}$
$V_{\mathrm{sh}}=3.57 \phi_{\mathrm{cbw}}$
(2) Lithology segments were identified using RLLD and Δt. Type C lithology satisfies the criteria of RLLD≥6.5 Ω·m and Δt≤310 μs/m. The remaining intervals were categorized into felsic shale and clayey shale intervals. The clayey shales generally exhibit lower RLLD and higher Δt values. However, significant logging response overlap exists between the two shale types, necessitating the integration of multi-source data and machine learning algorithms to enhance lithology identification accuracy. Since both shale types share the same msh calculation model, no further differentiation between them was performed in this study.
(3) The msh values for different lithologies were calculated using Eqs. (5) and (6).
(4) The water saturation of the shale was determined using Eq. (4) with the following model parameters: m=1.5, n=2, Cw=8.3 S/m, Ccw=6.8 S/m. For Archie's law, the same Cw value (8.3 S/m) was adopted, with m=1.25 and n=1.8. In the Total-shale model, Rsh was set to 5.0 Ω·m, while other parameters were consistent with those in the proposed model.
A comparison with core-measured values (Fig. 13) shows that Archie's law yields a water saturation with the lowest accuracy, followed by the Total-shale model, while the new model proposed in this study achieves the highest accuracy (Table 2). The msh values in the K2qn1 shale of Well A range from 1.30 to 2.27 (Fig. 13), reflecting significant variations in the inhibitory influence of OM on the conductivity of clay-bound water. When msh is 1.62-1.85 (e.g., the interval at 2 390-2 392 m in Fig. 13), the saturation interpretation results of the Total-shale model and the new model are generally consistent. However, when msh <1.62 (e.g., intervals at 2 384.2-2 387.0 m and 2 388.7-2 390.0 m in Fig. 13), the Total-shale model underestimates clay-bound water conductivity, resulting in calculated Sw values higher than the core-measured values. When msh>1.85 (e.g., the interval at 2 402.5-2 410.0 m in Fig. 13), the inhibitory effect of OM on clay-bound water conductivity intensifies, causing the Total-shale model to overestimate clay-bound water conductivity and yielding calculated Sw values significantly lower than the core-measured values. Therefore, the new model, which accounts for the differential inhibitory effect of OMs on clay-bound water conductivity, is more suitable for interpreting oil saturation in lacustrine shale oil reservoirs.
Table 2. Relative error in oil saturation calculated by different models |
| Well | Horizon | Relative error in oil saturation/% | ||
|---|---|---|---|---|
| Archie Law | Total-shale model | Proposed model | ||
| A | Q3 | 14.5 | 9.1 | 7.9 |
| Q2 | 18.9 | 11.2 | 6.3 | |
| Q1 | 13.3 | 11.7 | 6.4 | |
| Q1-Q3 | 14.0 | 10.7 | 7.2 | |
| B | Q3 | 21.9 | 21.7 | 13.7 |
| Q2 | 11.1 | 12.0 | 7.8 | |
| Q1 | 11.8 | 13.3 | 7.6 | |
| Q1-Q3 | 15.7 | 16.2 | 10.2 | |
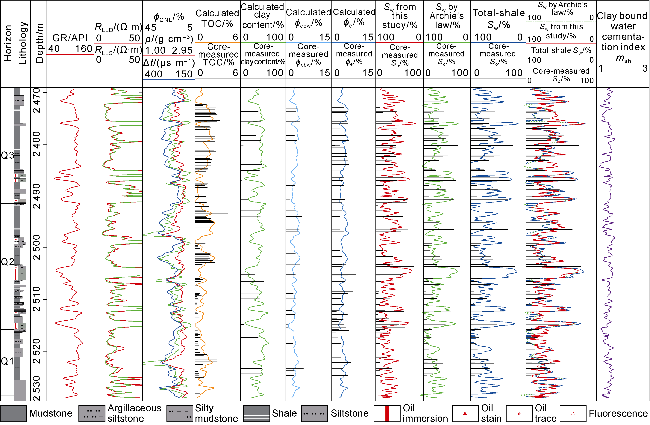
To validate the lateral applicability of the proposed model, an interpretive analysis was performed for Well B of K2qn1 in the study area (Fig. 14). Well B is situated in a deltaic outer-front subfacies (Fig. 1), where K2qn1 comprises thick mud-shale intervals interbedded with thin sandstone layers, characteristic of an interbedded shale oil play. Compared with Well A (located in the deep-lake subfacies), Well B has lower clay content (3.6%-52.4%, with an average of 39.4%). Its lithology is dominated by Type C (interbedded with siltstone) and argillaceous laminated felsic shale, accompanied by relatively low bound water volume fraction (averaging 3.12%) and effective porosity (averaging 4.37%), as well as higher RLLD values. Model parameters were calibrated using core data from Well B, with Cw set to 4.54 S/m. The relationship between msh and ϕe was largely consistent with that observed in Well A (Fig. 8a). Compared with core-measured results, the new model achieved an average saturation error of 10.2%, demonstrating higher accuracy than both the Archie's law and Total-shale model (Table 2). The msh values in Well B range from 1.13 to 1.74, with an average of 1.49, generally lower than those in Well A. This indicates a weaker inhibitory effect of OM on clay-bound water conductivity in this well. The new model's results are strongly consistent with those of the Total-shale model, except when msh<1.45, the new model yields lower Sw values that align more closely with core measurements (e.g., intervals at 2 473.8-2 475.2 m and 2 483.2-2 484.5 m, Fig. 14). The model also shows high interpretation accuracy in siltstone interbed intervals. These findings confirm that the new model is applicable for oil saturation interpretation in both pure mud-shale and interbedded shale oil reservoirs, with a consistently observed general relationship between msh and effective porosity.
Fig. 14. Calculated oil saturation of K2qn1 in Well B of Changling Sag, Songliao Basin. |
It should be noted that the conductivity model proposed in this study requires recalibration when applied to other exploration regions, due to variations in depositional environment, organic maturity, formation water salinity, clay mineral types and mineral composition. It should be constructed using core-measured data of parameters such as effective porosity, bound water volume fraction and water saturation. It is recommended to use sealed core samples combined with 2D NMR technology for accurate determination of these parameters. If sealed core samples are unavailable, bound water volume fraction can be measured via 2D NMR of water-saturated core samples, while effective porosity and water saturation may be determined using well-established experimental methods. In practical applications, the relationship between msh and effective porosity should be recalibrated by integrating core-measured parameters with RLLD. Additionally, log interpretation models for parameters such as effective porosity and bound water volume fraction must be refined through optimization methods to ensure accuracy and reliability.
6. Conclusions
Shale resistivity is jointly controlled by clay content and TOC. Higher clay content generally leads to lower formation resistivity, while under identical clay content conditions, increased OM abundance or adsorbed hydrocarbons result in higher shale resistivity. OMs and hydrocarbons adsorbed within clay interlayers can inhibit clay-bound water conductivity. This study introduces the clay-bound water cementation index msh to quantify the inhibitory effect of OM on clay-bound water conductivity. The msh values exhibit a wide range (1.1-2.3) and show a positive correlation with effective porosity. Under conditions of moderate OM abundance, well-developed rigid mineral frameworks and sufficient pores, msh values are higher, indicating a stronger inhibitory effect of OM on clay-bound water conductivity. Theoretically calculated resistivity increase ratio curves of shale exhibit a downward-curving trend, which is collectively influenced by bound water volume fraction, msh and effective porosity. For a given bound water volume fraction, higher effective porosity and msh values enhance the contribution of matrix free water conductivity, thereby resulting in a higher resistivity increase ratio. Compared to Archie's law and the Total-shale model, the oil saturation model proposed in this study—which incorporates the parallel conductive contributions of clay-bound water (accounting for OM inhibition) and matrix free water—exhibits superior interpretation accuracy. This model is particularly suitable for organic-rich lacustrine pure shale oil and interbedded shale oil reservoirs.
Nomenclature
Ct, Cma, Csh—conductivity of formation, matrix free water, and clay-bound water, S/m;
Cw, Ccw—conductivity of formation water and unit clay-bound water, S/m;
F—formation factor, dimensionless;
GR—natural gamma ray, API;
I—resistivity increase ratio, dimensionless;
k—maximum organic matter adsorption capacity per unit mass of clay, dimensionless;
m, n—cementation index and saturation index of matrix pores, dimensionless;
max{}—maximum value function;
msh—clay-bound water cementation index, dimensionless;
Ro, Rw, Rt—resistivity of fully water-saturated rock, formation water, and partially saturated rock, Ω·m;
Rsh—resistivity of mudstone layer, Ω·m;
RLLD—deep lateral resistivity, Ω·m;
RLLS—shallow lateral resistivity, Ω·m;
So, Sw—oil saturation and water saturation, %;
Swb—ratio of conductive bound water to total bound water, %;
T1—longitudinal relaxation time, ms;
T2—transverse relaxation time, ms;
TOC—total organic carbon content, %;
Vsh—clay mineral content, %;
ρ—compensating density, g/cm³;
ϕCNL—neutron porosity, %;
ϕe, ϕcbw—effective porosity and clay-bound water volume fraction, %;
Δt—acoustic interval transit time, μs/m.