

Introduction
Digital Rock Physics (DRP) offers a novel alternative to conventional lab-based petrophysical experiments for investigating the petrophysical properties of shale[1-4]. Shale porous media are commonly known for extreme complexity and heterogeneity, specifically multiscale pores and multiple mineral compositions[5-8]. The application of traditional DRP technologies for shale has been greatly hindered by the pressing issue of imaging technologies: it is challenging to obtain a 2D or 3D rock image with both high resolution and a large field of view (FoV) [9-10]. Although traditional stochastic reconstruction and experimental methods are only applicable to a single physical length scale[11-13], the hybrid superposition method offers a viable solution, which fuses single-scale digital rocks with different resolutions into a multiscale structure with a large FoV[14-16]. The hybrid method can resolve fine-scale and coarse-scale pores simultaneously, but commonly ignore the actual spatial position of fine-scale pores. Template-matching methods effectively address this issue but typically introduce noise into the templates, resulting in artificial pore connectivity [17-18]. Nevertheless, these methods usually operate on binary images without considering complex mineral compositions.
Recently, booming deep learning algorithms have inspired novel options for image processing [19], digital rock reconstruction [20], and modeling of multiple physical processes [21-23]. One effective way involves supplementing unresolved pores into coarse-scale digital rock, which is performed on binary structures using neural networks [24-25]. Another advanced approach is deep learning-based super-resolution (SR), which learns the end-to-end mapping between LR and HR images, effectively capturing the hierarchical representation and enhancing LR image quality [19,26-27]. These CNN (convolutional neural network)-based SR (SRCNN) models perform well at noise reduction, deblurring, and recovering edge detail and sharpness, but lose the high-frequency texture details nonetheless. Thus, GAN-based super-resolution methods (SRGANs), Residual Channel Attention Network (RCAN), and transformer-based models, e.g., Efficient Attention Super-Resolution Transformer (EAST), were proposed, and they are capable of boosting resolution and recovering textures [28-31]. Notably, training LR images are synthetically downsampled from HR images, inevitably resulting in a loss of noise and blur information compared to real-world images, and are not representative. Otherwise, paired HR and LR images are generally unavailable, and the HR images are limited in number due to time-consuming and expensive imaging at high resolution.
For accurate pore structure characterization and subsequent modeling of fluid transport processes, shale images should be segmented to identify the interesting phases, i.e., pores and minerals. Traditional segmentation methods, such as simple threshold, watershed, and even the machine-learning-based method, WEKA (Waikato Environment for knowledge analysis) [32], rely on manual identification, introducing user biases and dramatically affecting the prediction accuracy of petrophysical properties. Manual multi-mineral segmentation is also challenging due to the similar gray levels at the edges of different minerals. Fortunately, CNNs excel in end-to-end image translation and classification, tackling these human-factor limitations. Several CNN-based networks, e.g., SegNet [33], U-Net [34-35], U-SegNet [36], and Attention U-Net [37], have superior applications in automatic binary and multi-mineral segmentation on 2D and 3D grayscale images. However, applications of deep learning-based methods for multi-mineral segmentation on shale HR images remain limited and scarce.
Given the multiscale and multi-mineral characteristics of shale rock, limited HR images, unavailable real-world LR-HR image pairs, and challenging multi-mineral segmentation of shale HR images, this work proposes a GAN-based framework for shale petrophysical properties characterization from image augmentation, super-resolution, to image multi-mineral auto-segmentation, resulting in fine characterization of multiscale and multi-mineral shale. Based on two couples of shale SEM images, these GAN models are assessed visually and quantitatively through two-point correlation function, linear-path correlation function, entropy, and petrophysical properties, i.e., porosity, pore size distribution, coordination number, and permeability.
1. GAN-based method for pore structure characterization
Our comprehensive workflow consists of three key steps:
(1) HR image augmentation. To obtain substantial HR images for training the SR model, we start with training the StyleGAN2-ADA model using limited HR images (512×512 pixels) [38-40]. The trained generator is consequently used to synthesize a lot of HR images, resulting in training image augmentation (Fig. 1a), for training the SR model. Adaptive Discriminator Augmentation (ADA) enables StyleGAN to maintain high performance even when trained by a limited dataset.
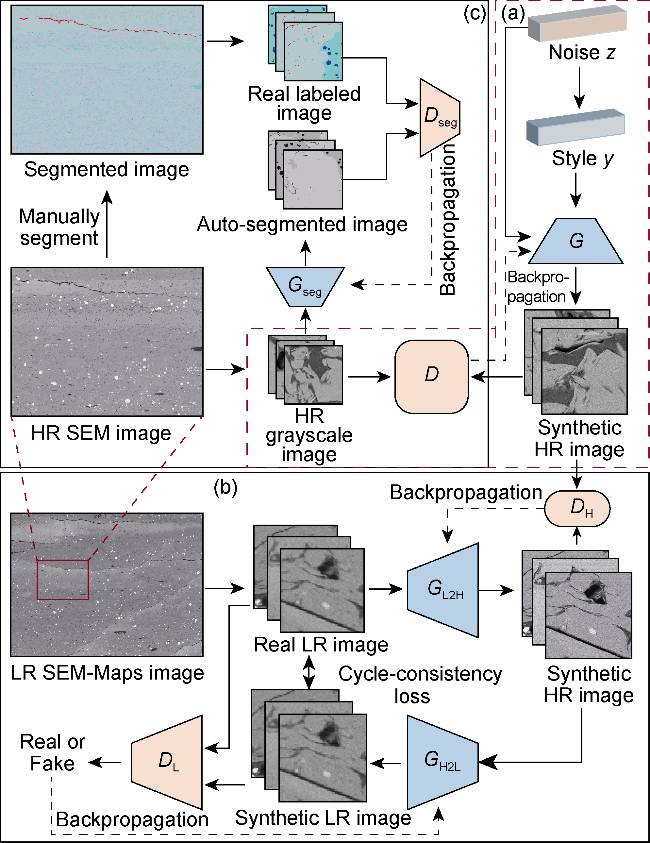
Fig. 1. Overview of HR image augmentation, image super-resolution, and auto-segmentation based on GAN. |
(2) Image super-resolution. The HR domain formed by the augmented HR images and original limited HR sub- images, coupled with the LR domain, are utilized to train the SR model (SRCycleGAN) based on the cycle consistency GAN [41-43]. The trained generator GL2H is applied to enhance the resolution of 2D LR images and 3D LR digital rock by 8 times to clarify the details and reproduce the unresolved fine-scale features (such as fine-scale pores) in LR images, thus achieving multiscale image fusion (Fig. 1b). To mitigate the demand on GPU memory and computation, we enhance the 3D FIB-SEM slice by slice in three vertical directions [42,44], and then upsample the three resulting digital rocks using the bicubic interpolation method along the low-resolution direction. Consequently, we can fuse them into a single matrix to generate the ultimate high-resolution digital rock by averaging the voxel values at the same position.
(3) Multi-mineral auto-segmentation. Grayscale images are first manually segmented using the watershed method to create a segmented image (Fig. 1c). Then, HR sub-images and corresponding labeled sub-images are extracted from the grayscale and the segmented image, respectively, to train the GAN-based segmentation (SegGAN) model [23,45]. Finally, with the generator GG2S of the SegGAN model, the grayscale HR image and the 3D digital rock can be segmented into different phases for further petrophysical properties analysis, i.e., porosity, organic matter proportion (OMP), pore size distribution, and permeability.
1.1. Style-based GAN: StyleGAN
A typical GAN comprises two competitive networks: a generator G and a discriminator D [46]. The generator focuses on producing realistic rock images G(z) from latent random noise z~pz(z) and learns how to deceive the discriminator to classify generated images G(z) into real images x~pdata(x). The discriminator distinguishes real images from synthetic ones. The discriminator is first trained to improve its recognition ability by maximizing loss V(D, G) (Eq. (1)). The generator is then optimized to minimize log-likelihood {lg[1-D(G(z))]} until both networks reach a “Nash Equilibrium”. Thus, the trained generator is capable of producing images that are indistinguishable from real images by the discriminator.
$\begin{array}{c}\min _{G} \max _{D} V(D, G)=\mathbb{E}_{x \sim p_{\text {data }}(x)}[\lg D(x)]+ \\\mathbb{E}_{z \sim p_{z}(z)}\{\lg [1-D(G(z))]\}\end{array}$
Style-based GAN (StyleGAN and StyleGAN2), introduced by Karras et al. [38-39], is renowned for its ability to create high-resolution images with intricate details, resulting in improved image fidelity and diversity. Both StyleGAN and StyleGAN2 comprise a mapping network and a synthesis network (Fig. 2). The mapping network, implemented using a multi-layer perceptron (consisting of 8 fully connected layers, as shown in Fig. 2b), transforms the input random noise z∈Z into an intermediate latent code w∈W. This intermediate code is then specialized to styles y via learned affine transformations (A in Fig. 2), which control the synthesis network through adaptive instance normalization (AdaIN) in StyleGAN.
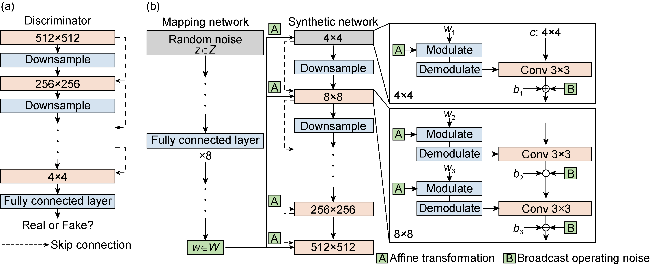
Fig. 2. The architecture of the StyleGAN2 used for shale HR image generation. |
The synthesis network generates realistic images based on style y and scaled random noise. It maps a learned constant vector (4×4) to HR images (512×512) via convolutional layers. Each layer undergoes Modulation and Demodulation through the input style y to prevent instability and mode collapse, ensuring stable training and improved image quality using the style y. The styles incorporated in different layers locally control image features at different scales. The styles in shallower layers only affect coarse-scale features, and those in deeper layers control fine-scale features, such as texture details and edges. Explicit noise inputs further decorate these styles and control local details, offering granular control over the generated images. This unique generative architecture enables the reproduction of complex pore structures in shale, making it a suitable choice for HR image reconstruction. The detailed architectures of the discriminator and the generator are shown in Fig. 2a and 2b.
Karras et al. [40] improved StyleGAN2 by introducing an ADA mechanism to mitigate the common issue of discriminator overfitting and training divergence when working with limited data. ADA is an effective data augmentation method that significantly bolsters the stability and performance of StyleGAN2 under limited data conditions. While data augmentation is a prevalent and feasible strategy against overfitting, its application in GAN training encounters a tough challenge, as the generator tends to learn and reproduce the augmentation (e.g., rotation, noise) applied to the training images. This leaking of augmentation is highly undesirable in image synthesis. ADA alleviates the influence due to the augmentation (e.g., rotation, noise) applied to the training images by augmenting the dataset with an adaptive probability that dynamically adjusts based on the degree of overfitting. Utilizing this adaptive augmentation strategy, a StyleGAN2 model is trained with a limited data-set of shale HR images to provide training data for the subsequent super-resolution model.
1.2. CycleGAN-based Super-resolution model: SRCycleGAN
The cycle-consistent property of the CycleGAN enables image translation without paired training samples [41]. Thus, leveraging sufficient synthetic HR images, along with real-world LR and HR images, we employ a CycleGAN-based model (SRCycleGAN) to reproduce the fine-scale pores identified in HR images to achieve multiscale image fusion.
A CycleGAN contains two generators (GL2H and GH2L) and two discriminators (DL and DH) for learning the mapping function between two domains (LR images and HR images). GL2H translates LR image l into HR image h. GH2L generates LR images from HR images. Discriminator DH discriminates training HR images h from translated HR images GL2H(l). Similarly, DL distinguishes training LR images l from generated LR images GH2L(h). Apart from the adversarial loss LGAN, CycleGAN training incorporates a cycle-consistent loss Lcyc and an identity loss Lidt. LGAN is applied to improve the generators and the discriminators to synthesize images as real as possible, as expressed:
$\begin{array}{c}L_{\mathrm{GAN}}\left(G_{\mathrm{L} 2 \mathrm{H}}, D_{\mathrm{H}}\right)=\mathbb{E}_{h \sim p_{\text {data }}(h)}\left[\lg D_{\mathrm{H}}(h)\right]+ \\\mathbb{E}_{l \sim p_{\text {data }}(l)}\left[\lg \left(1-D_{\mathrm{H}}\left(G_{\mathrm{L} 2 \mathrm{H}}(l)\right)\right]\right.\end{array}$
$\begin{array}{c}L_{\mathrm{GAN}}\left(G_{\mathrm{H} 2 \mathrm{~L}}, D_{\mathrm{L}}\right)=\mathbb{E}_{1 \sim p_{\text {data }}(I)}\left[\lg D_{\mathrm{L}}(I)\right]+ \\\mathbb{E}_{h \sim p_{\text {data }}(h)}\left\{\lg \left[1-D_{\mathrm{L}}\left(G_{\mathrm{H} 2 \mathrm{~L}}(h)\right)\right]\right\}\end{array}$
Lcyc ensures that the learned CycleGAN can translate the training LR images or HR images back to themselves, i.e., l→GL2H(l)→GH2L[GL2H(l)] ≈ l and h→GH2L(h)→ GL2H[GH2L(h)] ≈ h, which can make the generated images reproduce the contents of the input images with the desired style. Simply put, the Lcyc is given by:
$\begin{array}{c}L_{\text {cyc }}\left(G_{\mathrm{L} 2 \mathrm{H}}, G_{\mathrm{H} 2 \mathrm{~L}}\right)=\mathbb{E}_{l \sim p_{\text {data }}(l)}\left\{\left\|G_{\mathrm{H} 2 \mathrm{~L}}\left[G_{\mathrm{L} 2 \mathrm{H}}(l)\right]-l\right\|_{1}\right\}+ \\\mathbb{E}_{h \sim p_{\text {data }}(h)}\left\{\left\|G_{\mathrm{L} 2 \mathrm{H}}\left[G_{\mathrm{H} 2 \mathrm{~L}}(h)\right]-h\right\|_{1}\right\}\end{array}$
Lidt also helps to prevent the generator from overly deforming the input image during translation, thereby preserving the features and identity information of the input image. The identity loss is formulated as:
$\begin{array}{c}L_{\mathrm{idt}}\left(G_{\mathrm{L} 2 \mathrm{H}}, G_{\mathrm{H} 2 \mathrm{~L}}\right)=\mathbb{E}_{l \sim p_{\text {data }}(l)}\left[\left\|G_{\mathrm{L} 2 \mathrm{H}}(l)-l\right\|_{1}\right]+ \\\mathbb{E}_{h \sim p_{\text {data }}(h)}\left[\left\|G_{\mathrm{H} 2 \mathrm{~L}}(h)-h\right\|_{1}\right]\end{array}$
Consequently, the total loss of the CycleGAN is the sum of these three losses:
$\begin{array}{c}L(G, D)=L_{\mathrm{GAN}}\left(G_{\mathrm{L} 2 \mathrm{H}}, D_{\mathrm{H}}\right)+L_{\mathrm{GAN}}\left(G_{\mathrm{H} 2 \mathrm{~L}}, D_{\mathrm{L}}\right)+ \\\lambda_{1} L_{\mathrm{cyc}}\left(G_{\mathrm{L} 2 \mathrm{H}}, G_{\mathrm{H} 2 \mathrm{~L}}\right)+\lambda_{2} L_{\mathrm{idt}}\left(G_{\mathrm{L} 2 \mathrm{H}}, G_{\mathrm{H} 2 \mathrm{~L}}\right)\end{array}$
GL2H and GH2L share a similar architecture: GL2H receives an LR image with 64×64 pixels and outputs an HR image of 512×512 pixels. It comprises three modules: (1) an Encoder Module including two convolutional layers for extracting features (32×32) from the input images; (2) an Residual module including nine Residual Blocks applied to diminish gradient vanishing caused by network depth, every of which contains two couples of reflection padding, convolutional layers, instance normalization and ReLU activation functions (Fig. 3); and (3) an Decoder module composed of three deconvolutional layers which are followed by instance normalization and ReLU activation functions for reconstructing high-resolution features. Finally, a convolutional layer translates the feature maps treated with reflection padding to the target HR images (512×512). The discriminators DH and DL share the same architecture, as shown in Fig. 3b. It transforms the input image into an N×N patch, allowing for the evaluation of a local field (the receptive field) rather than the entire input image. Such a patch-level discriminator aims to distinguish the truth of each overlapping image, associated with the output N×N patch, within the input image. The discriminator contains five convolutional layers (4×4 kernel size), and each layer is followed by a LeakReLU activation function with a slope of 0.2, except for the last one. Instance normalization is applied only to the intermediate three layers.
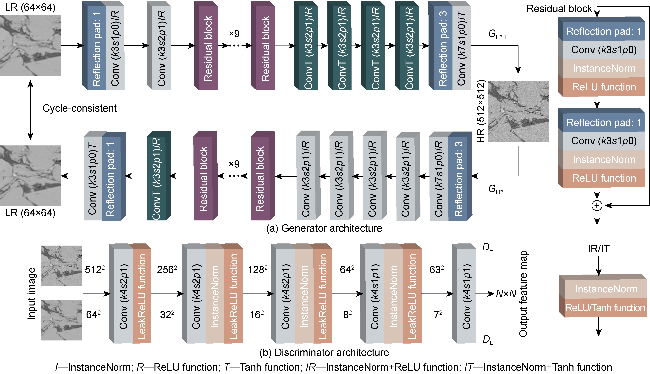
Fig. 3. The architecture of SRCycleGAN. |
1.3. U-Net-based GAN for Segmentation: SegGAN
This paper introduces a discriminator into the U-Net model, which has a great performance on rock image segmentation [34,47], to leverage the adversarial learning mechanism of GAN, and achieve multi-mineral segmentation of shale images. The SegGAN model with a U-Net generator learns the mapping from the HR images and manually labeled results using the watershed method. Compared with conventional methods such as threshold and watershed (susceptible to artificial bias), a SegGAN model provides a robust alternative for accurate segmentation.
The generator Gseg maps a grayscale image g to a segmented image S. The discriminator Dseg distinguishes auto-segmented images from real labeled images. The objective function of SegGAN combines the adversarial loss of cGAN LcGAN [48] and the identity loss Lidt (L1 distance). The adversarial loss can be expressed as:
$\begin{array}{c}L_{\text {cGAN }}\left(G_{\text {seg }}, D_{\text {seg }}\right)=\mathbb{E}_{g, S}\left[\lg D_{\text {seg }}(g, S)\right]+ \\\mathbb{E}_{g, Z}\left\{\lg \left[1-D_{\text {seg }}\left(g, G_{\text {seg }}(g, Z)\right)\right]\right\}\end{array}$
And the L1 distance is given by
$L_{\text {idt }}\left(G_{\text {seg }}\right) = \mathbb{E}_{g, S, Z}\left[\left\|S-G_{\text {seg }}(g, Z)\right\|_{1}\right]$
Thus, the final objective is
$L_{\mathrm{p} 2 \mathrm{p}}=L_{\mathrm{cGAN}}\left(G_{\mathrm{seg}}, D_{\mathrm{seg}}\right)+\lambda_{3} L_{\mathrm{idt}}\left(G_{\mathrm{seg}}\right)$
The discriminator used for SegGAN is the same as described in Section 1.2. Notably, the input grayscale image and the output labeled image share a great deal of underlying structures, such as the location of pore or grain edge. Therefore, a general U-Net structure is used [34], i.e., an encoder-decoder network with skip connection, which receives a grayscale image (512×512) and outputs a segmented image (512×512). The detailed network architecture of the generator is presented in Fig. 4.
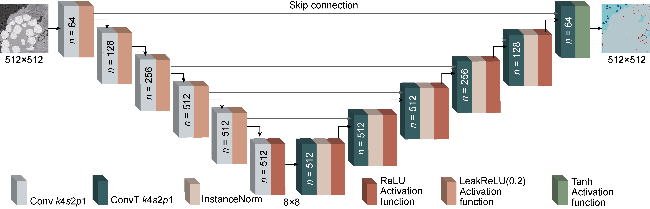
Fig. 4. The generator architecture of SegGAN. |
2. Model training and evaluation
2.1. Data preparation and model training
In this work, two couples of high- and low-resolution SEM images with an 8x resolution difference from two shale samples were employed to evaluate the feasibility and accuracy of the proposed workflow. Specifically, the resolutions of the first sample (S1) are 5 nm/pixel and 40 nm/pixel, while 10 nm/pixel and 80 nm/pixel for the second sample (S2). 100 HR sub-images were randomly extracted, each sized 512×512 pixels, from the higher-resolution SEM images (5 nm/pixel and 10 nm/pixel) of both S1 and S2 for StyleGAN2 evaluation. These sub-images are not overlapped with each other. Additionally, to train the SRCycleGAN model, 14 626 and 7 904 LR sub-images, each 64×64 pixels with a spacing of 128, were extracted from the lower-resolution SEM images of S1 and S2, respectively.
All models were trained on a single Nvidia V100 GPU with a memory of 32 GB. An Adam optimizer, with momentum constants β1 = 0.5 and β2 = 0.999, was used to update the generators and the discriminators. All StyleGAN2-ADA, SRCycleGAN, and SegGAN models followed a two-step training procedure: (1) Initialize the generator and the discriminator. (2) Train the discriminator by updating the loss function while fixing the generator. (3) Train the generator by updating the loss function while fixing the discriminator. (4) Repeat steps (2) and (3) until convergence or the maximum number of iterations is satisfactory. Notably, the three models used different loss functions. The SRCycleGAN model includes two generators and two discriminators.
2.2. HR image dataset augmentation and evaluation
Fig. 5 presents the original real sub-images alongside the synthetic results produced by the trained generators. The synthetic HR images are visually indistinguishable from the original HR sub-images, and accurately reproduce typical structures, such as organic and inorganic pores, microfractures, and pyrite minerals, at both 5 and 10 nm/pixel resolutions. This observation simultaneously indicates great performance in HR image generation and the diversity of synthetic results. The porosity and OMP were calculated to further validate the accuracy of the synthetic results. For each sample, 100 synthetic images were generated and compared to the total training sub-images, as depicted in Fig. 6. The close resemblance of porosity and OMP distributions quantitatively demonstrates that the synthetic images precisely captured the pore and organic matter features (Fig. 6a and 6b).
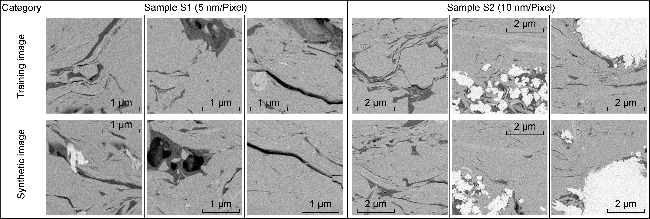
Fig. 5. Comparison of the original training HR images and the synthetic HR images using StyleGAN2-ADA. |
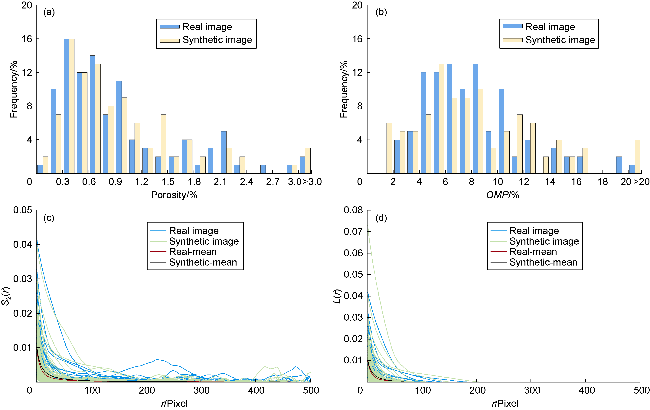
Fig. 6. Quantitative comparison between original training data and 100 synthetic realizations. |
$S_{2}(r)=P\left(x \in V_{\mathrm{p}}, x+r \in V_{\mathrm{p}}\right)$
$L(r)=P\left(x_{r} \in V_{\mathrm{p}}\right)$
Fig. 6c shows that the S2(r) curves of real and synthetic images show a consistent tendency. The S2(r) value decreases rapidly with increasing r, indicating that the pores in both real and generated images are isolated and less large pores are found. The average S2(r) curves share almost the same tendency except for a few samples at 10 nm/pixel. The S2(r) value is higher even at larger r, which suggests more clustered or connected pores. The L(r) curves of synthetic HR images closely resemble those of the real images, and their average curves are nearly identical (Fig. 6d). These L(r) curves decrease sharply and become stable at lower values, indicating poor pore connectivity in both real and generated images. Additionally, there are a few higher L(r) curves of both real and synthetic images with fractures, suggesting better connectivity. Consequently, based on a limited set of HR images, the trained generator of StyleGAN2-ADA can effectively learn the distributions of various phases—pores, organic matter, clay minerals, and pyrite—and capture pore structures and connectivity. This allows the generation of numerous HR images, providing abundant training data for subsequent SRCycleGAN models.
2.3. Image super-resolution and evaluation
Two groups of LR and HR images were used to intuitively assess the performance of the trained SRCycleGANs: the real-world LR images without associated HR images and the LR images downsampled from real-world HR images. The latter enables direct comparison between the SRCycleGAN results and corresponding HR images, as shown in Fig. 7. The trained generator GL2H improves and clarifies detailed features such as pores and microfracture boundaries. The SRCycleGAN results successfully recover fine-scale interparticle inorganic pores and organic pores, which are otherwise lost in LR images due to limited resolution. Additionally, SR results appear slightly darker than the ground truth but closely match in microstructure. This is evidenced through the normalized difference in gray values between the predicted and real-world HR images. Both the SRCycleGAN results and HR images exhibit similar gray value distributions, with identifiable “multi-peaks” features, despite slight differences in the peaks. The increasing distance between grayscale peaks indicates a more pronounced distinction between different phases, especially between organic matter and clay minerals. Moreover, the gray histograms show that the predicted HR images from SRCycleGAN effectively eliminate noise present in the ground-truth images. Similar results are observed in sample S2.
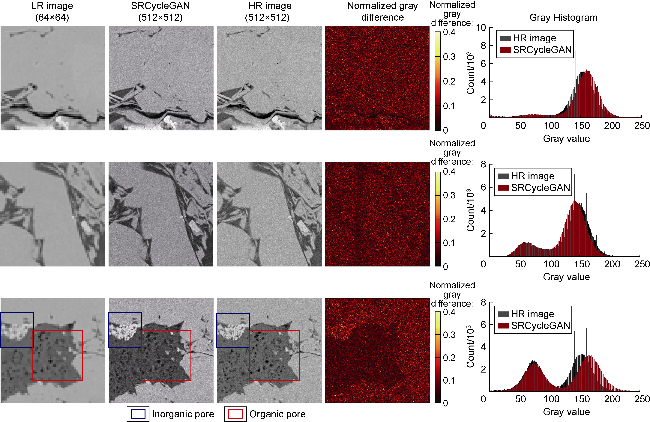
Fig. 7. Comparison between LR images, SRCycleGAN results, and real HR images. |
Meanwhile, the peak signal-to-noise ratio (PSNR) and structural similarity index (SSIM) for SRCycleGAN results and Bicubic results are further used to evaluate the performance of the trained SRCycleGAN model, as shown in Fig. 8. The PSNR distribution of SRCycleGAN results is more concentrated, with a higher average value compared to Bicubic results. Similarly, the SSIM distribution of SRCycleGAN is overall higher than that of Bicubic. Notably, the SSIM values are relatively low for SRCycleGAN results because the SRCycleGAN results exhibit certain differences in luminance and contrast compared to the real images, with larger peak grayscale differences (Fig. 7), and the SRCycleGAN model effectively eliminates noise present in the ground-truth images, which also contributes to the lower SSIM values. Next, we will further evaluate the structural similarity between the SRCycleGAN results and HR images through pore size and connectivity.
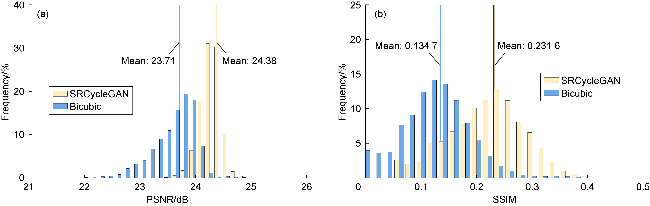
Fig. 8. PSNR and SSIM distribution of SRCycleGAN results and Bicubic results compared to real HR images. |
Then the SRCycleGAN is evaluated on real-world LR images. Without reference HR images, the entropy is used to estimate the quality of the multiscale fusion images [50].
$E=-\sum_{j=0}^{255} p(j) \log _{2} p(j)$
The entropy distribution of predicted results from SRCycleGAN closely resembles that of real-world HR images, whereas it diverges significantly from that of LR images and Bicubic results, as shown in Fig. 9a. The SRCycleGAN results and HR images exhibit similar average entropy, which are higher than that of LR images and Bicubic results. A similar trend is observed in Fig. 9b. The lower entropy of Bicubic results likely stems from the smoothing effect of Bicubic interpolation. In contrast, the substantial increase in entropy between the SRCycleGAN results and LR images indicates that SRCycleGAN effectively enhances image details and reconstructs fine-scale structures, such as texture features and fine-scale pores. Additionally, the close alignment of SRCycleGAN's entropy with that of the real HR images underscores its capability to produce high-fidelity SR images that preserve the complexity and details of the original high-resolution data. Meanwhile, to validate the capability of SRCycleGAN in other shale images, we improved the resolution of the SEM image of a marine shale sample, and got good results.
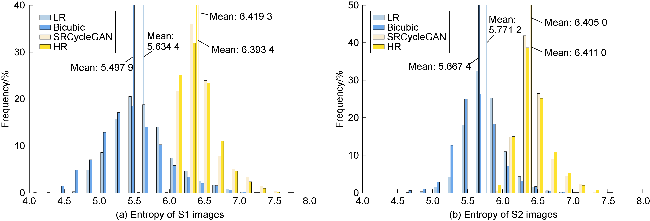
Fig. 9. Entropy distribution of LR images, Bicubic results, SRCycleGAN results, and Real HR images for S1 and S2. |
2.4. Multi-mineral segmentation and evaluation
Two SegGAN models were trained using paired grayscale HR images of S1 and S2, along with corresponding segmented images. The performance of the trained SegGAN models was assessed against manual segmentation results using the watershed method, as shown in Fig. 10. The intersection over union (IoU) between SegGAN predictions and manually segmented images is used to measure the overlap between the same regions and evaluate the similarity between SegGAN predictions and training images (Table 1). In general, the trained model effectively identifies different minerals, with IoU values exceeding 0.5 for all mineral phases and generally above 0.75. This indicates a strong similarity between SegGAN predictions and the results from watershed segmentation.
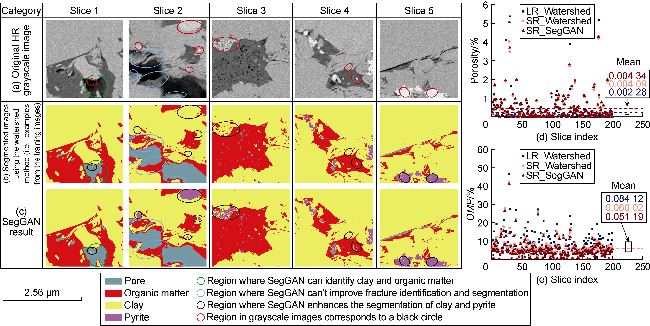
Fig. 10. Comparison of multi-mineral segmentation results with original HR images for S1. (a) Original grayscale HR images, (b) segmented images using the watershed method (i.e., examples from the training images), (c) SegGAN result, (d) porosity, and (e) organic matter proportion (200 images were used for the quantitative analysis). |
Table 1. The IoU between the segmentation results and the original HR images of S1 and S2 |
| Sample | Phase | IoU | ||||
|---|---|---|---|---|---|---|
| Slice1 | Slice2 | Slice3 | Slice4 | Slice5 | ||
| S1 | Pore | 0.658 | 0.968 | 0.657 | 0.738 | 0.664 |
| Organic matter | 0.886 | 0.916 | 0.985 | 0.964 | 0.864 | |
| Clay | 0.978 | 0.918 | 0.960 | 0.991 | 0.992 | |
| Pyrite | 0.001 | 0.003 | 0.903 | 0.935 | ||
| S2 | Pore | 0.973 | 0.874 | 0.848 | 0.793 | 0.706 |
| Organic matter | 0.788 | 0.975 | 0.963 | 0.762 | 0.925 | |
| Clay | 0.977 | 0.999 | 0.995 | 0.968 | 0.967 | |
| Pyrite | 0.951 | 0.925 | ||||
Moreover, SegGAN demonstrates superior performance in multi-mineral segmentation compared to the watershed method. The trained model accurately identified organic matter which is essential for evaluating total organic carbon (TOC), as highlighted in Slices 1 and 4 in Fig. 10. Although the gray values of organic matter and clay are similar, SegGAN can identify the edges between them and figure out the clay strips distributed in organic matter, which were classified erroneously into organic phase by the watershed method, as presented in Slice 4 in Fig. 10. Additionally, SegGAN recovered pyrites that missed in manually segmented images, as shown in Slices 2 and 3 in Fig. 10, which contributed to the low IoU values in the pyrite region.
The Depth of Field (DOF) in SEM images reveals the spatial features of microstructure but introduces challenges for conventional segmentation methods. SegGAN precisely identifies pore edges and successfully distinguishes clay minerals from organic matter (see Slice 1 in Fig. 10). However, it does not fully resolve this issue due to DOF in terms of fracture identification and segmentation (see Slice 2 in Fig. 10). Note that the training images were also segmented using the watershed method, resulting in many inaccuracies, but the trained SegGAN still excels in multi-mineral segmentation, refining mineral predictions effectively. This primarily stems from the adversarial training and its generator, which adopts a U-Net architecture with skip connections. On the one hand, it enables SegGAN to structure features at different scales, including texture and spatial distribution, rather than relying only on grayscale gradient information. On the other hand, skip connections help retain essential features from the original grayscale image, such as boundaries between different minerals and spatial positions. These properties allow SegGAN to mitigate the impact of label errors, thereby improving segmentation accuracy. This also explains why SegGAN can correctly identify the pyrite phase, recognize the “clay interlayer” within organic matter, and reduce misclassification caused by DOF.
To further assess the performance of SRCycleGAN and SegGAN, we tested SegGAN on 200 super-resolution realizations (SR images) generated using SRCycleGAN. Segmentation results using the watershed method on LR and SR images were used for comparison in terms of porosity and OMP. It is evident that the porosity (Fig. 10d) of LR images is generally lower than that of SR images, regardless of whether using the watershed method or the SegGAN model, verifying that SRCycleGAN can enhance LR image quality and accurately reproduce fine-scale details. Notably, the OMP of LR images at 40 nm/pixel (Fig. 10e) is higher because numerous organic pores recognized in SR images were classified into organic matter in LR images. This indicates that SRCycleGAN can effectively recover organic pores.
Both porosity and OMP predicted by the SegGAN model and the watershed method show similar distributions for SR images, indicating that SegGAN supplies persuasive segmentation results. For SR image segmentation of S1, the porosity predicted by SegGAN is slightly higher than that calculated by the watershed method, but the OMP is slightly lower. This discrepancy is probably due to the modification of DOF error and the accurate identification of clay strips within organic matter by SegGAN, which increases pore fraction while decreasing OMP. For S2, both porosity and OMP predicted by SegGAN are kind of higher than those calculated by the watershed method. This is attributed to the elimination of “clay interlayer” and correct classification into organic matter by the SegGAN model.
3. Case study and further evaluation
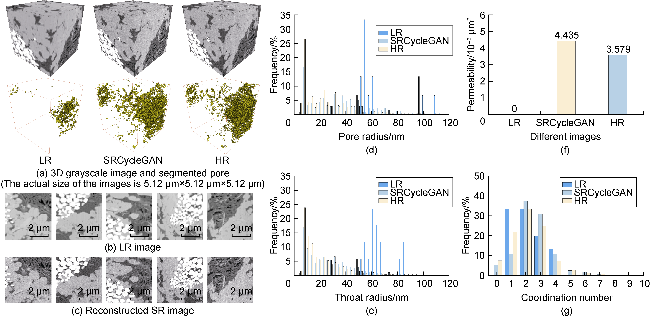
Taking the FIB-SEMs of Jurassic shale in the Sichuan Basin as a case, the approach proposed in this paper was used for super-resolution and multi-mineral segmentation on the 3D digital rock. First, the trained SRCycleGAN was applied to improve the resolution of the 3D LR digital rock, and then the SegGAN segmented the SR result. Finally, petrophysical properties, including porosity, OMP, pore/throat size distribution, coordination number, and permeability, were calculated [12]. Fig. 11a-11c reveal a significant enhancement in the SRCycleGAN result compared to the LR digital rock. It reproduced the fine-scale pores unresolved in the LR digital rock. The pores and grain boundaries in the SRCycleGAN realization are more distinctly defined, closely resembling the detailed structures in the HR sample. This visual fidelity is crucial for accurately capturing the intricate internal structures of shale, which directly impact the physical properties.
Fig. 11. Qualitative and quantitative evaluation of multiscale fusion on 3D digital rock. |
Quantitative analyses further substantiate the effectiveness of the SRCycleGAN application (Fig. 11d-11g and Table 2). The pore and throat size distributions of the SR digital rock predicted by SRCycleGAN better match those of the real HR digital rock, but differ highly from the LR digital rock (Fig. 11d and 11e). The SR and HR digital rocks share a semblable frequency distribution of coordination number, demonstrating that the trained generator GL2H produced realistic pore size distribution and recovered the pore connectivity of the HR digital rock. Moreover, although the LR digital rock has higher average pore and throat radii and a considerable average coordination number (Table 2), its permeability is negligible.
Table 2. Pore structure parameters calculated from LR image, SRCycleGAN results, and original HR image |
| Pore structure parameter | LR | SRCycleGAN | HR |
|---|---|---|---|
| Porosity/% | 0.71 | 2.83 | 2.55 |
| OMP/% | 32.25 | 29.81 | 29.99 |
| Pore number | 15 | 2052 | 2942 |
| Mean pore radius /nm | 67.50 | 33.43 | 22.50 |
| Throat number | 17 | 1040 | 1519 |
| Mean throat radius /nm | 63.4 | 25.43 | 18.72 |
| Mean shape factor | 0.059 | 0.044 | 0.048 |
| Mean coordination number | 2.13 | 2.51 | 2.24 |
In contrast, the permeability of the SR realization is 4.435 × 10⁻⁶ µm2, closely approximating the HR image permeability of 3.579 × 10⁻⁶ µm2. This is attributed to the presence of only a few pores and throats with larger radii in the LR digital rock. Additionally, the average shape factor is also brought closer to the HR digital rock. The OMP of the LR digital rock (32.25%) is higher than the similar OMPs of SR and HR samples (29.81% and 29.99%), due to misclassification between organic pores and organic matter in the LR image, namely, the organic pores are misclassified into organic matter. This indicates a more accurate representation of pore volume and OMP in SR images.
In summary, these analyses of pore structure and permeability demonstrate that the trained SRCycleGAN can significantly enhance the resolution of the shale images by refining edges, denoising, deblurring, and importantly recovering the small pores unresolved in the LR digital rock. By closely approximating the HR images in terms of key petrophysical properties and visual details, SRCycleGAN proves to be a valuable tool for generating high-fidelity multiscale digital rocks, and essential for accurate prediction of petrophysical properties.
The trained SegGAN excels in multi-mineral segmentation, precisely identifying and categorizing pore space, organic matter, and other minerals. Nevertheless, inaccurate training images for the segmentation model can still affect the performance of the trained SegGAN. To address this issue, two feasible improvements can be considered. First, the CycleGAN architecture utilization for image segmentation tasks does not require paired grayscale and segmented images, instead, unsupervised learning enables the generator to fully learn the features of the segmented images. Second, introduction of residual blocks and skip connections into SegGAN [31,51] can enhance information transfer and preserve more grayscale image information. Additionally, it allows the model to focus on the accurately segmented features, reducing the impact of inaccurate segmentation on the final decision and improving the overall segmentation performance.
4. Conclusions
This paper proposes a comprehensive GAN-based framework that comprises StyleGAN, SRCycleGAN, and SegGAN, for predicting shale physical properties, including porosity, pore size distribution, and permeability, through image augmentation, super-resolution, and multi-mineral segmentation. Initially, a StyleGAN model is trained using limited real-world HR images to generate numerous HR images. These synthetic HR images, along with real-world LR and HR images, are subsequently utilized to train a SRCycleGAN for the super-resolution of 3D digital rock images, which can reproduce the fine-scale structures lost at low resolution. Finally, a SegGAN model trained on paired HR grayscale and segmented images segments the multiscale HR images into multiple phases—including pores, organic matter, pyrite, and clay minerals—for further petrophysical properties prediction, e.g., pore structure, OMP, and permeability.
The availability of StyleGAN2 was evaluated using two types of HR images with different resolutions. The synthetic HR images closely resemble real-world HR images globally but differ in local features. Both visual and quantitative evaluations on 2D images and 3D digital rocks demonstrate that SRCyleGAN effectively enhances shale image quality and achieves multiscale fusion of 3D digital rocks, addressing the trade-off between resolution and FoV without requiring paired LR and HR shale images. Even though the training images for SegGAN are not accurate enough, the trained SegGAN precisely captures fine-scale features and eliminates the misclassification caused by the DOF of SEM images to some extent, refining the predictions of different phases, which is crucial for microstructure analysis and fluid transport modeling in shale. It is concluded that this framework addresses the challenge of the lack of rock images, especially HR images. It can achieve the fine characterization of complex shale microstructures, and can be applied to other heterogeneous porous media, such as carbonate, coal, and tight sandstone reservoirs.
Nomenclature
bi—the bias of the i layer;
c—constant input
D—the discriminator of StyleGAN;
DL, DH—the generators of SRCycleGAN;
Dseg—the discriminator of SegGAN;
E—image entropy;
$\mathbb{E}$ [·]—expectation;
g—grayscale training images;
G—the generator of StyleGAN;
GL2H, GH2L—the generators of SRCycleGAN;
Gseg—the generator of SegGAN;
h—HR training images;
IoU—intersection over union;
k—convolution kernel size;
l—LR training images;
LcGAN—conditional adversarial loss function;
Lp2p—total loss function of SegGAN;
LGAN—adversarial loss function of SRCycleGAN;
Lidt—identity loss function of SRCycleGAN and SegGAN;
Lcyc—cycle consistency loss function of SRCycleGAN;
L(r)—linear correlation function;
N—the output feature map size of DL, DH, and Dseg;
n—the number of filters;
OMP—organic matter proportion, %;
pdata—data distribution;
p(j)—the probability of intensity level j in an 8-bit grayscale image;
P—probability;
p—padding;
r—distance;
s—convolution stride;
S—training segmented images;
S2(r)—two-point correlation function;
V(G, D)—adversarial loss function;
Vp—pore space;
w—intermediate latent code transformed from random noise;
W—the set of intermediate latent code w;
x—training images;
xr—a random point along the line segment of length r;
y—style;
z—random noise;
Z—random noise set, following (0,1) Gaussian distribution;
β1—the exponential decay rate for the first moment;
β2—the exponential decay rate for the second moment;
λ1—the weight of Lcyc;
λ2—the weight of Lidt in SRCycleGAN;
λ3—the weight of Lidt in SegGAN.
Subscript
h~pdata(h)—h follows the distribution of pdata(h);
l~pdata(l)—l follows the distribution of pdata(l);
x~pdata(x)—x follows the distribution of pdata(x);
z~pz(z)—z follows the distribution of pz(z).