

Introduction
In recent years, natural gas exploration and development has made great breakthroughs in deep coal-rock reservoirs in the Ordos and Junggar basins, NW China, where the coal-rock gas in place below the depth of 2 000 m is preliminarily estimated to be over 30×1012 m3 [1]. In 2024, PetroChina Company Limited put more than 100 new coal-rock gas wells into production, achieving the annual production over 23×108 m3, which is 130% higher than that in 2023, and built up the global first coal-rock gas field [2]. Coal-rock gas has become an important strategic alternative for the growth and sustainability of natural gas resources in China [1-3]. Compared with shallow coal seams, deep coal rock reservoirs are higher in geostress, fluid pressure and temperature. Due to these properties, deep coal-rock gas emerges in the well immediately upon being put into production, and presents high yield immediately upon its breakthrough, with a long production lifecycle [4-5]. Currently, deep coal-rock gas is developed in a mode similar to shale gas, but it is significantly different from shale gas in terms of reservoir properties and production patterns. The research on the development mechanism of deep coal-rock gas is still in the initial stage, and especially the gas production behaviors and adsorbed/free gas production ratio in the process of deep coal-rock gas production have not been understood sufficiently [6-7]. These facts restrict, to some extent, the optimization of production system and the improvement of single well production.
Deep coal-rocks are highly capable of adsorption, with an adsorbed gas content of 65%-90%, due to their dual- porosity structure consisting of micro- and nano-pores and macroscopic cleats/fractures in the matrix [8]. Compared with medium-shallow coalbed methane (CBM), deep coal-rock gas has better reservoir conditions and higher free gas content [9-11]. However, there is controversy on the volume and proportion of original adsorbed/free gas in deep coal-rock reservoirs, and the research on the production mechanism of coal-rock gas and the quantitative evaluation of adsorbed/free gas has been scarcely reported. Such quantitative evaluation mainly relies on the material balance method and the online nuclear magnetic resonance (NMR) method [12-14]. In the material balance method, the relationship between the core's apparent average pressure and cumulative gas production is monitored to determine the free gas volume during the production process, which is then subtracted from the total gas production to obtain the adsorbed gas volume [12,15]. The NMR is an important method to determine the occurrence state of fluids [16], and it can derive a transverse relaxation time (T2) spectrum by which methane is divided into free gas and adsorbed gas. However, NMR observation is time-consuming, making it mostly used to monitor the equilibrium state under certain conditions in isothermal adsorption experiments [17-19]. The inapplicability of NMR to real-time, continuous monitoring of the dynamic process of gas production has limited the application of this technique in the research of coal rock development [13-14]. Additionally, there are no uniform criteria and rules for defining the threshold between free gas and adsorbed gas (T2 cutoff), which is mainly subject to subjective judgment in current practices.
Scholars have studied methane migration by various methods, such as on-site core desorption experiment [20-22], seepage-diffusion-desorption experiment [23-25], wellhead gas monitoring [26-29], numerical simulation [30-32] and molecular simulation [33], and indicated that multi- stage isotope fractionation is obvious in the process of methane migration, and the fractionation characteristics in each stage are closely related to gas production process [34-36], rock composition [23,37-38], gas content [21,39-41], and ratio of adsorbed gas to free gas [32,42-43]. This finding provides a new idea for applying isotope fractionation to determine production proportion of adsorbed/free gas in the process of deep coal-rock gas production. However, these studies mostly focused on shale gas and shallow CBM, but rarely investigated deep coal-rock gas. Moreover, simulation experiments were limited to on-site desorption processes, and insufficiently involved the production process of simulating gas wells.
This paper uses the full-diameter samples of the Carboniferous Benxi Formation deep coal rock in the Ordos Basin for physical simulation experiments on the lifecycle depletion development of deep coal-rock gas wells. Based on the experimental results, a coal rock fractures/cleats and matrix pores coupled dual-medium isotope fractionation model was constructed, a method for evaluating the lifecycle production of adsorbed/free gas was established, and the production performance of adsorbed/free gas at different production stages under the controlled pressure production modes was clarified. The study results provide theoretical support for the upgrading of deep coal-rock gas development technologies and the optimization of production systems.
1. Physical simulation experiments on the lifecycle depletion development of deep coal-rock gas wells
1.1. Geological settings and experimental samples
The experimental samples 1# and 2# were taken from deep coal-rocks in Daji (Daning-Jixian) and Yulin areas of the Ordos Basin, respectively (Fig. 1a). Both samples were acquired from the No. 8 coal rock of Benxi Formation (Fig. 1b), at the burial depth of 2 153.45 m and 2 585.16 m, being lagoonal-tidal flat sedimentary facies. From the perspective of macroscopic coal rock type, sample 1# is classified as semi-bright coal with primary texture, where fractures are not very developed; while sample 2# is bright coal with primary texture, with two groups of cleats approximately vertical to the bedding plane and being vertical or oblique each other (Fig. 1c). Both samples are full-diameter cores with a diameter of 10 cm. The photos of the cores show that compared with sample 1#, sample 2# has more developed cleats/fractures.
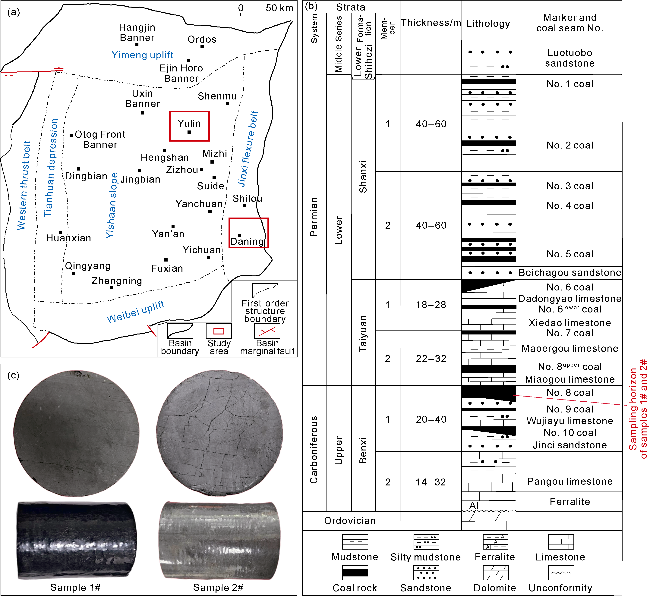
Fig. 1. Regional overview of the Ordos Basin (a), composite stratigraphic column of Benxi Formation-Shanxi Formation (b), and photos of experimental cores (c) (modified from Reference [44]). |
The basic physical parameters, proximate analysis, and maceral analysis results of samples 1# and 2# are shown in Table 1. Their porosities are 7.07% and 9.19%, and permeabilities are 0.006 34×10-3 μm2 and 1.12×10⁻³ μm2, respectively. Obviously, the permeability of sample 2# is much higher than that of sample 1#, which is consistent with the relatively developed cleats/fractures in sample 2# observed in Fig. 1c. Sample 1#, with the Ro of 2.61%, is included in the category of high-rank coal rock, and sample 2#, with the Ro of 1.74%, is included in the category of medium-rank coal rock. The proximate analysis results indicate that the air-dried basis ash (Aad), air-dried basis volatile (Vad), moisture and fixed carbon contents of sample 1# are 22.13%, 7.09%, 0.71% and 70.09%, respectively; and those of sample 2# are 7.53%, 13.62%, 0.42% and 78.43%. The Langmuir volume of medium- and high-rank coal rocks increases with the fixed carbon content [45]. The fixed carbon content of sample 2# is higher than that of sample 1#, which indicates that sample 2# has a larger amount of adsorbed gas than sample 1#. The macerals of samples 1# and 2# are mainly composed of vitrinite (84.89% and 79.00%, respectively), followed by inertinite (8.75% and 17.40%, respectively). The contents of exinite and mineral are relatively low - exinite 0% and 1.20%, and mineral 6.36% and 2.40%, respectively. Generally, vitrinite and inertinite have stronger methane adsorbability than exinite [46]. Sample 2# is greater than sample 1# in the sum of vitrinite and inertinite, which means that sample 2#, may have a stronger methane adsorbability than sample 1#.
Table 1. Basic physical parameters, proximate analysis, and maceral analysis of samples 1# and 2# |
| Sample | Well | Well depth/m | Type | Ro/% | Formation | Length/ cm | Diameter/ cm | Porosity/ % | Permeability/ 10-3 μm2 | Mass/g | Experimental pressure/MPa |
|---|---|---|---|---|---|---|---|---|---|---|---|
| 1# | DJ5 | 2 153.45 | No. 8 coal | 2.61 | Benxi | 12.28 | 9.97 | 7.07 | 0.006 34 | 1 528.99 | 24.09 |
| 2# | YY2 | 2 585.16 | No. 8 coal | 1.74 | Benxi | 10.51 | 9.92 | 9.19 | 1.120 00 | 1076.38 | 26.08 |
| Sample | Proximate analysis | Maceral | |||||||||
| Moisture/ % | Ash | Volatile | Fixed carbon/% | Vitrinite/% | Inertinite/% | Exinite/% | Mineral/% | ||||
| Aad/% | Ad/% | Vad/% | Vd/% | Vdaf/% | |||||||
| 1# | 0.71 | 22.13 | 22.28 | 7.09 | 7.14 | 9.19 | 70.09 | 84.89 | 8.75 | 0 | 6.36 |
| 2# | 0.42 | 7.53 | 7.56 | 13.62 | 13.68 | 14.80 | 78.43 | 79.00 | 17.40 | 1.20 | 2.40 |
1.2. Experimental methodology
1.2.1. Sample pretreatment
The two full-diameter samples need pretreating before the experiment. Firstly, the end faces of the samples were treated by means of wire cutting to reduce the dead volume between the end face and the instrument. Then, the uneven areas on the sides of the samples were cut and glued to improve the sealing between the sample and the instrument. In addition, the samples were coated with a layer of thermoplastic sleeve on the sides to prevent them from breaking along fissures due to the change of the confining pressure in the process of depletion development (Fig. 1c). In view that the moisture in the samples influences the enrichment and flow of coal-rock gas [47], the samples were placed in a 105 °C oven for drying after they were treated with glue and installed with thermoplastic sleeves.
1.2.2. Simulation of lifecycle depletion development of deep coal-rock gas wells
The independently designed desorption-diffusion- seepage coupled physical simulation experimental system was adopted (Fig. 2), corresponding to the maximum pressure up to 60 MPa. Previous laboratory simulation results showed that temperature has a relatively small impact on the overall effect of isotopic fractionation [48]. To compare with the results of most other simulation experiments conducted at room temperature, we conducted simulation experiments at 25 °C.
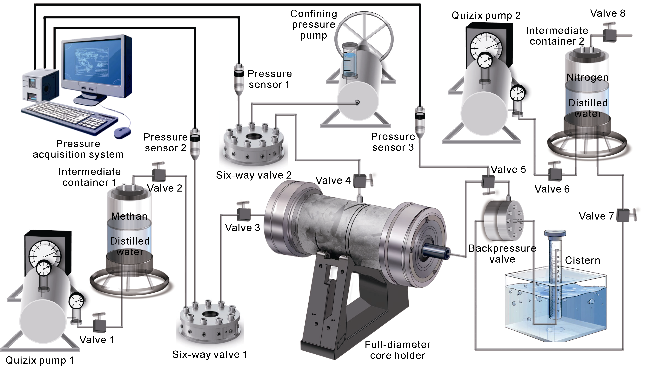
Fig. 2. Experimental system for physical simulation of lifecycle depletion development of a deep coal-rock gas well. |
The experimental procedures are as follows:
(1) Apply confining pressure to the core. Place the pretreated core into a full-diameter core holder, open valve 4, and apply a confining pressure of 15 MPa to the core using a confining pressure pump.
(2) Saturate the core with methane preliminarily. Inject methane into the intermediate container 1, open valve 1, and pressurize the methane in the intermediate container 1 through Quizix pump 1. Then open valves 2 and 3, and close valve 5, to start saturating the core with methane.
(3) Gradually increase the pressure to saturate the core. To avoid excessive effective stress causing pore closure during the application of confining pressure, increase the confining pressure while injecting methane, to keep the difference between confining pressure and pore pressure at around 15 MPa all the time (the vertical stress difference between the No. 8 coal seam and the roof in Daji Block mainly ranges from 8 MPa to 18 MPa [49-50]. To reflect the effective stress of actual reservoir, 15 MPa is selected here as the difference between confining pressure and pore pressure).
(4) Balance between adsorption and saturation. After the core is saturated with methane to the simulated formation pressure (pf), continue saturating it for more than 5 d in a constant pressure mode, then close valves 1 and 2, and observe the inlet/outlet pressure of the core until the pressure no longer decreases. At this moment, the core is considered to be fully saturated. Next, close valve 3, remove the high-pressure gas source, and prepare to start depletion development (The pf values of samples 1# and 2# are 24.09 MPa and 26.08 MPa, and their pressurized saturation continued 66 d and 23 d, respectively).
(5) Install the backpressure valve. Pressurize the water end of the intermediate container 2 to ph (ph>pf) using Quizix pump 2, while connecting the outlet end of the core holder to the top end of the backpressure valve, and the outlet end of the backpressure valve to a pipeline into the water tank for gas measurement and collection.
(6) Carry out depletion development. Keep the confining pressure constant, and open valves 5 and 7. ph is higher than pf, so at the beginning, no gas is produced at the outlet end. Then open valve 8 to decrease the water end pressure of the intermediate container 2. When it is lower than the simulated formation pressure, gas production begins. Adjust the pressure decline rate at the outlet end by controlling valve 8.
(7) Perform data monitoring, sample collection and testing. Continuously monitor and record the confining pressure, inlet pressure and outlet pressure of the samples in the entire development process in real time by using pressure sensors 1, 2, and 3 connected to a pressure acquisition system. Continuously read the gas produced from the outlet end of the backpressure valve through a measuring cylinder. And regularly collect the gas using a saltwater bottle for the testing and analysis of methane carbon isotope composition. In order to reduce isotopic fractionation caused by methane escape when it is stored in a glass bottle [51], it is necessary to ensure that the volume of water in each cylinder accounts for one- third of the bottle volume and maintain the gas-water inversion all the time. The testing of isotope compositions shall be completed within one month after collection.
1.2.3. Testing of methane carbon isotopic composition
The methane carbon isotopic composition (δ13C1) of the produced gas was tested using a stable isotope ratio mass spectrometer and gas chromatograph with a measuring precision of ±0.3‰. Gas component separation was carried out with helium as the carrier gas (1.5 mL/min) by means of PoraPLOT Q chromatographic column (25 m×0.32 mm×10 μm). The oven temperature of the gas chromatograph was initially set to 50 °C and maintained for 3 min, then raised to 150 °C at a rate of 15 °C/min and maintained for 2 min.
2. Results and discussion
2.1. Pressure decline and gas production curves
To simulate the depletion development mode of deep coal-rock gas, the depletion development of sample 1# was conducted in a slow-pressure control production mode with the outlet pressure decreasing from 24.09 MPa to 0.2 MPa within 12.9 d, at a pressure decline rate of 1.85 MPa/d. The back pressure valve needs a certain pressure, so sample 1# was produced stably for 33 d after its outlet pressure dropped to 0.2 MPa, and then in blowdown production mode. Due to the low permeability of the sample, the decline rate of inlet pressure was much lower than that of outlet pressure (Fig. 3a). In the late stage, cumulative gas production and gas production rate fluctuated slightly with the change of outlet pressure. At 130 d, the cumulative gas production was 28.63 L, and the gas production rate decreased from 306 mL/h to 1.09 mL/h (Fig. 3b, 3c). The monitoring results show that the δ13C1 values of the produced gas exhibits a clear trend of "stable → decrease → increase" in the early production stage. The turning point of decrease to increase occurs at 3.9 d, with a fractionation amplitude of 3.9‰. When the outlet pressure dropped suddenly, the δ13C1 value decreased rapidly and then continued to increase (Fig. 3d).
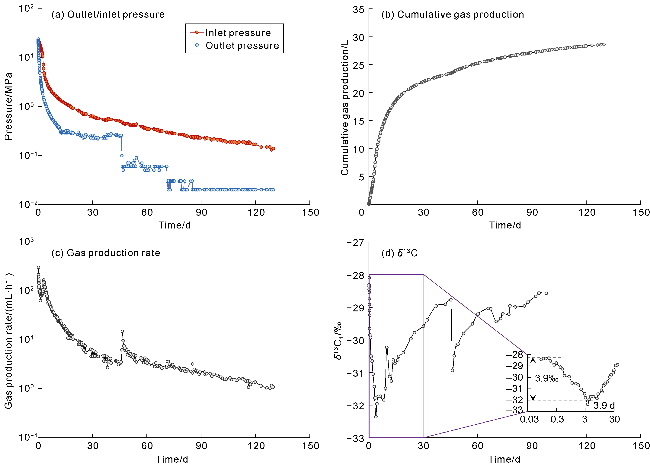
Fig. 3. Variation of inlet pressure, cumulative gas production, gas production rate and δ13C1 values over time in the depletion development process of sample 1#. |
Sample 2# contains cleats/fractures, so its production was conducted in a mode of staged pressure control. In stage 1, the outlet pressure was decreased rapidly from 26.08 MPa initially to 3.8 MPa (simulated bottomhole pressure) at a rate of 4 MPa/h, and then the production was carried out at a constant pressure of 3.8 MPa. In stage 2, the outlet pressure was decreased to 2.5 MPa, and then the production was continued at a constant pressure. In stage 3, the outlet pressure was decreased to 1.5 MPa, and then the production was continued at a constant pressure. In stage 4, the outlet pressure was decreased to 0.5 MPa, and then the production was continued at a constant pressure. In stage 5, the outlet pressure was decreased to the atmospheric pressure, and then blowdown production was carried out. The relatively developed cleats/fractures and high permeability in sample 2# made the inlet and outlet pressures follow almost the same decreasing trend over time (Fig. 4a). At the end of each stage, the cumulative gas production and gas production rate increase with the decreasing outlet pressure. As of 156 d, the cumulative gas production was 30.84 L, and the gas production rate decreased from 4 023.53 mL/h to 0.03 mL/h (Fig. 4b, 4c). In the early production stage (stage 1), the δ13C1 value of the produced gas exhibits a trend of "decrease → increase". The turning point of decrease to increase occurs at 0.3 d, with a decrease fractionation amplitude of 2.9‰. When the outlet pressure drops suddenly, the δ13C1 value increases after decreasing. Moreover, each pressure decline is accompanied by the phenomenon of “rapid decrease followed by continued increase” until the late production stage (stage 5), during which the outlet pressure remains constant at atmospheric pressure and the δ13C1 value increases continuously after decreasing (Fig. 4d).
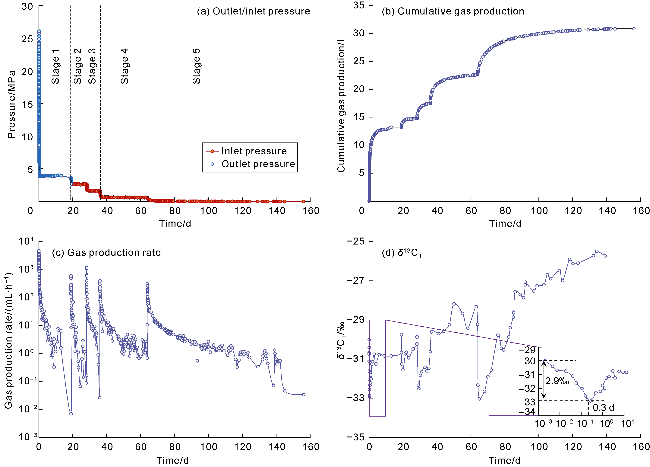
Fig. 4. Variation of inlet pressure, cumulative gas production, gas production rate and δ13C1 values over time in the depletion development process of sample 2#. |
2.2. Mechanisms of isotopic fractionation in coal-rock gas
In the experiments, samples 1# and 2# were observed with the phenomena of "stable → decrease → increase" and "decrease → increase" respectively in the isotope fractionation process in the early production stage before the outlet pressure changed suddenly. The previous adsorption-desorption simulation experiments on shale samples revealed that methane carbon isotopes generally exhibit four-stage fractionation, i.e. stable → decrease → increase → decrease, throughout the entire shale desorption process [23]. Combined with the phenomena observed in this study, the mechanism and general model of isotopic fractionation in the process of deep coal-rock gas production are proposed as follows. In stage I, the δ13C1 value is basically stable with small fluctuation, the produced gas is dominantly cleat/fracture gas, and 12CH4 and 13CH4 migrate synchronously under high pressure difference, without significant fractionation (Fig. 5a, 5d). In stage III, the δ13C1 value decreases, and both cleat/fracture gas and matrix gas are produced together. The matrix gas is mainly composed of free gas, and it is preferentially supplied to 12CH4 which has a higher diffusion rate and a weaker adsorption capacity. With the mixing of matrix gas, the δ13C1 value begins to decrease (Fig. 5b, 5d). In stage III, the δ13C1 value increases, and the produced gas is mainly adsorbed gas in the matrix pores, followed by free gas. Due to the large consumption of 12CH4 in the early stage, the proportion of 13CH4 in the residual gas in the core increases in the late stage, but it is still lower than that of 12CH4. As a result, the δ13C1 value increases monotonically (Fig. 5c, 5d). Sample 1# corresponds to stages I to III in the model, while sample 2# mainly corresponds to stages II and III. For Sample 2#, with a higher permeability, the gas produced in the initial stage is a mixture of cleat/fracture gas and matrix gas, so it directly enters stage II. Under the same experimental conditions, sample 2# exhibits isotope lighting to a smaller extent than sample 1# (2.9‰<3.9‰), which is attributed to the relatively developed cleats/fractures in sample 2#. Unlike previous shale desorption experiment results [23], neither of the two coal rock samples in this study showed the stage IV (decrease), possibly due to the difficult desorption of solid solution gas from kerogen in the samples.
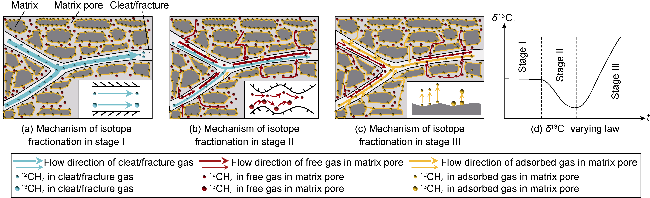
Fig. 5. Mechanism and general model of isotope fractionation in the process of deep coal-rock gas production in the Ordos Basin (the thickness of the arrow in a, b and c represents the relative contribution at relevant stage). |
The above-mentioned phenomena of isotopic fractionation were observed when the outlet pressure (or boundary condition) did not change suddenly. In the stage III of isotope fractionation, a sudden depressurization for production adjustment can lead to a rapid supply of remote matrix gas. Due to the relative abundance of 12CH4 in remote matrix gas, the δ13C1 value of the produced gas exhibits a trend of "rapid decrease followed by continued increase" (Fig. 6). In the production process of an actual gas well, a sudden change in bottomhole pressure caused by treatments such as shut in, well testing and refracturing can also induce variations in isotope fractionation. For example, Gao et al. [34] reported in 2017 that the Barnett shale gas well presented another decrease of δ13C1 due to a sudden change in gas production rate in stage III, when the value was expected to consistently increase.
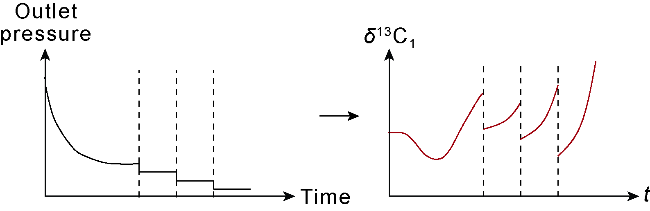
Fig. 6. Variation of δ13C1 with the sudden change of outlet pressure. |
2.3. Calculation of adsorbed/free gas production based on the material balance method
According to the material balance equation, for a closed gas reservoir with adsorbed gas excluded, the apparent average pressure decreases linearly with increasing cumulative free gas production:
$G_{\text {free }}=G_{0}\left(1-\frac{p / Z_{\mathrm{g}}}{p_{0} / Z_{0}}\right)$
where p/Zg is the apparent average pressure of the core at any given time, which can be calculated from core inlet and outlet pressures and gas compressibility factor:
$\frac{p}{Z_{\mathrm{g}}}=\sqrt{\left(\frac{p_{\text {in }} / Z_{\text {in }}}{2}\right)^{2}+\left(\frac{p_{\text {out }} / Z_{\text {out }}}{2}\right)^{2}}$
The gas in the dead volume between the core end face and pipeline is produced in the early stage, so the data of cumulative gas production and apparent average pressure in the linear segment after a period of production is generally used to analyze the production behaviors. At high pressure, as the apparent average pressure of the core decreases, it is in a good linear relationship with the cumulative gas production dominated by free gas. As the apparent average pressure of the core further decreases, the measured cumulative gas production gradually deviates from the fitted line (i.e. the material balance line), and the measured cumulative gas production corresponding to any pressure is greater than the cumulative gas production corresponding to the material balance line, which indicates the substantial desorption of adsorbed gas (Fig. 7a, 7c). The cumulative free gas production per unit mass at any time can be determined by extrapolating from the material balance line, and then the cumulative adsorbed gas production per unit mass at any time during the production process can be calculated by subtracting the cumulative free gas production per unit mass from the measured total cumulative gas production per unit mass (Fig. 7b, 7d). For sample 1# at 130 d, the cumulative gas production per unit mass is calculated using the material balance method to be 18.72 m3/t, including free gas of 5.05 m3/t and adsorbed gas of 13.67 m3/t, with free gas contributing 27.0%. For sample 2# at 156 d, the cumulative gas production per unit mass is 28.66 m3/t, including free gas of 4.81 m3/t and adsorbed gas of 23.85 m3/t, with free gas contributing only 16.8%. Sample 2# has cleats/fractures, so its actual free gas production and contribution should be higher. The above-mentioned significant deviation in the adsorbed/free gas production calculated by the material balance method is believed to relate to the fact that the method calculates the apparent average pressure of the core by using the monitored inlet and outlet pressures of the core, but the monitored inlet/outlet pressure in the core with cleats/fractures cannot represent the average pressure of matrix pores and cleats/fractures inside the core. Additionally, this method can only calculate the free gas production and adsorbed gas production in the case with measured cumulative gas production data, and is unable to predict the adsorbed gas production and its proportion in the subsequent production process.
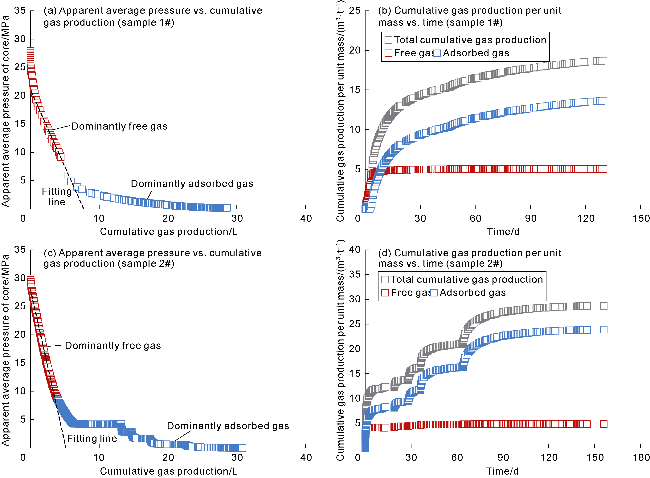
Fig. 7. Calculation results of adsorbed/free gas production based on the material balance method. |
3. Fracture/cleat and matrix pore coupled dual-medium isotopic fractionation model of coal rock
Considering the deviation in calculation by the material balance method and the previous finding that the isotope fractionation phenomenon in the process of coal-rock gas production is closely related to the original occurrence state and production process of adsorbed/free gas, the isotope fractionation effect was used in this study to calculate the adsorbed/free gas production in the process of deep coal-rock gas production. Xia et al. established an isotope fractionation model including diffusion and adsorption/desorption coupling in single pore medium [30]. Li et al. built a multi-scale pore semi-coupled isotopic fractionation model considering time-varying boundary [31]. Wang et al. [32] developed an isotope fractionation model that couples the dual dispersed pore structure with multiple gas transport mechanisms, depending on the complex pore structures and flow mechanisms inside coal rocks. Based on the previous research, this paper presents a methane carbon isotopic fractionation model for characterizing the depletion development process of deep coal rocks, which corresponds to a dual-porosity and dual-permeability system due to the presence of cleats and micropores. This model incorporates the coupling of dual-medium (cleat/fracture system and matrix pore system) space and multiple gas transport mechanisms of deep coal rocks. The relevant control equation set is as follows:
$\left\{\begin{array}{l}C_{1} \frac{\partial p_{\mathrm{m}}}{\partial t}+B_{1} \frac{\partial p_{\mathrm{m}}^{*}}{\partial t}=\nabla \cdot\left(D_{\mathrm{m} \_ \text {app }} \nabla p_{\mathrm{m}}\right)-D_{\mathrm{m}} \alpha^{*}\left(p_{\mathrm{m}}-p_{\mathrm{f}}\right) \\C_{2} \frac{\partial p_{\mathrm{m}}}{\partial t}+B_{2} \frac{\partial p_{\mathrm{m}}^{*}}{\partial t}=\nabla \cdot\left(D_{\mathrm{m} \_ \text {app }}^{*} \nabla p_{\mathrm{m}}^{*}\right)-D_{\mathrm{m}}^{*} \alpha^{*}\left(p_{\mathrm{m}}^{*}-p_{\mathrm{f}}^{*}\right) \\\phi_{\mathrm{f}} \frac{\partial p_{\mathrm{f}}}{\partial t}=\nabla \cdot\left(D_{\mathrm{f}} \nabla p_{\mathrm{f}}\right)+D_{\mathrm{m}} \alpha^{*}\left(p_{\mathrm{m}}-p_{\mathrm{f}}\right) \\\phi_{\mathrm{f}} \frac{\partial p_{\mathrm{f}}^{*}}{\partial t}=\nabla \cdot\left(D_{\mathrm{f}}^{*} \nabla p_{\mathrm{f}}^{*}\right)+D_{\mathrm{m}}^{*} \alpha^{*}\left(p_{\mathrm{m}}^{*}-p_{\mathrm{f}}^{*}\right)\end{array}\right.$
including
$B_{1}=-\frac{\left(1-\phi_{\mathrm{m} \_ \text {eff }}\right) c K K^{*} p_{\mathrm{m}}}{\left(1+K p_{\mathrm{m}}+K^{*} p_{\mathrm{m}}^{*}\right)^{2}}$
$C_{1}=\phi_{\mathrm{m} \_ \text {eff }}+\frac{\left(1-\phi_{\mathrm{m} \_ \text {eff }}\right) c\left(K+K K^{*} p_{\mathrm{m}}^{*}\right)}{\left(1+K p_{\mathrm{m}}+K^{*} p_{\mathrm{m}}^{*}\right)^{2}}$
$B_{2}=\phi_{\mathrm{m} \_ \text {eff }}+\frac{\left(1-\phi_{\mathrm{m} \_ \text {eff }}\right) c\left(K^{*}+K K^{*} p_{\mathrm{m}}\right)}{\left(1+K p_{\mathrm{m}}+K^{*} p_{\mathrm{m}}^{*}\right)^{2}}$
$C_{2}=-\frac{\left(1-\phi_{\mathrm{m} \_ \text {eff }}\right) c K K^{*} p_{\mathrm{m}}^{*}}{\left(1+K p_{\mathrm{m}}+K^{*} p_{\mathrm{m}}^{*}\right)^{2}}$
$c=\rho_{\mathrm{s}} V_{\mathrm{L}} Z_{\mathrm{m}} R T / V_{\text {std }} \quad \alpha^{*}=4 N(N+2) / L^{2}$
where $D_{\mathrm{m} \_\mathrm{app}}$ and $D_{\mathrm{m} \_\mathrm{app}}^{*}$ are the apparent diffusion
coefficients of 12CH4 and 13CH4 in matrix pores (coupling of viscous flow, Knudsen diffusion and surface diffusion), respectively; $D_{\mathrm{f}}$and $D_{\mathrm{f}}^{*}$ are the diffusion coefficients of 12CH4 and 13CH4 in cleats/fractures; ϕm_eff is the effective porosity of matrix pores, which is calculated using the formula given in Reference [32].
A geometric model was established based on the core dimensions shown in Table 1, and then it was inserted with the above equation set. For initial condition, the initial pressure was set to be p0. For boundary condition, the pressure at the outlet connecting to the pipeline was set to be equal to the experimentally measured outlet pressure pout. The above model can be solved using software such as COMSOL Multiphysics or MATLAB to obtain the spatiotemporal distribution of the pressure field inside the cores. The inlet/outlet pressure, cumulative gas production and δ13C1 values were calculated by integrating the partial pressures ($p_{\mathrm{f}}$, $\quad p_{\mathrm{f}}^{*}$, $\quad p_{\mathrm{m}}$ and $p_{\mathrm{m}}^{*}$) of cleats/fractures and matrix pores. The inlet pressure is determined by:
$p_{\text {in }}=\frac{1}{S} \iint\left[\phi_{\mathrm{m} \_ \text {eff }}\left(p_{\mathrm{m}}+p_{\mathrm{m}}^{*}\right)+\phi_{\mathrm{f}}\left(p_{\mathrm{f}}+p_{\mathrm{f}}^{*}\right)\right] /\left(\phi_{\mathrm{m} \_ \text {eff }}+\phi_{\mathrm{f}}\right) \mathrm{d} s$
The cumulative production of 12CH4 and 13CH4 in cleat/fractures, the cumulative production of free 12CH4 and 13CH4 in matrix pores, the cumulative production of adsorbed 12CH4 and 13CH4 in matrix pores, and the total cumulative gas production are calculated as follows:
$Q_{\mathrm{f}}(t)=V_{\mathrm{m}} \iiint\left[\frac{\phi_{\mathrm{f}}(0) p_{\mathrm{f}}(0)}{Z_{\mathrm{f}}(0) R T}-\frac{\phi_{\mathrm{f}}(t) p_{\mathrm{f}}(t)}{Z_{\mathrm{f}}(t) R T}\right] \mathrm{d} V$
$Q_{\mathrm{f}}^{*}(t)=V_{\mathrm{m}} \iiint\left[\frac{\phi_{\mathrm{f}}(0) p_{\mathrm{f}}^{*}(0)}{Z_{\mathrm{f}}(0) R T}-\frac{\phi_{\mathrm{f}}(t) p_{\mathrm{f}}^{*}(t)}{Z_{\mathrm{f}}(t) R T}\right] \mathrm{d} V$
$Q_{\mathrm{m} \_ \text {free }}(t)=V_{\mathrm{m}} \iiint\left[\frac{\phi_{\mathrm{m} \_ \text {eff }}(0) p_{\mathrm{m}}(0)}{Z_{\mathrm{m}}(0) R T}-\frac{\phi_{\mathrm{m} \_ \text {eff }}(t) p_{\mathrm{m}}(t)}{Z_{\mathrm{m}}(t) R T}\right] \mathrm{d} V$
$Q_{\mathrm{m} \_ \text {free }}^{*}(t)=V_{\mathrm{m}} \iiint\left[\frac{\phi_{\mathrm{m} \_ \text {eff }}(0) p_{\mathrm{m}}^{*}(0)}{Z_{\mathrm{m}}(0) R T}-\frac{\phi_{\mathrm{m} \_ \text {eff }}(t) p_{\mathrm{m}}^{*}(t)}{Z_{\mathrm{m}}(t) R T}\right] \mathrm{d} V$
$\begin{aligned}Q_{\mathrm{m} \_ \text {ads }}(t)= & \iiint\left\{\rho_{\mathrm{r}} V_{\mathrm{L}} \frac{\left[1-\phi_{\mathrm{m} \_ \text {eff }}(0)\right] K p_{\mathrm{m}}(0)}{1+K p_{\mathrm{m}}(0)+K^{*} p_{\mathrm{m}}^{*}(0)}-\right. \\& \left.\rho_{\mathrm{r}} V_{\mathrm{L}} \frac{\left[1-\phi_{\mathrm{m} \_ \text {eff }}(t)\right] K p_{\mathrm{m}}(t)}{1+K p_{\mathrm{m}}(t)+K^{*} p_{\mathrm{m}}^{*}(t)}\right\} \mathrm{d} V\end{aligned}$
$\begin{aligned}Q_{\mathrm{m} \_ \text {ads }}^{*}(t)= & \iiint\left\{\rho_{\mathrm{r}} V_{\mathrm{L}} \frac{\left[1-\phi_{\mathrm{m} \_ \text {eff }}(0)\right] K^{*} p_{\mathrm{m}}^{*}(0)}{1+K p_{\mathrm{m}}(0)+K^{*} p_{\mathrm{m}}^{*}(0)}-\right. \\& \left.\rho_{\mathrm{r}} V_{\mathrm{L}} \frac{\left[1-\phi_{\mathrm{m} \_ \text {eff }}(t)\right] K^{*} p_{\mathrm{m}}^{*}(t)}{1+K p_{\mathrm{m}}(t)+K^{*} p_{\mathrm{m}}^{*}(t)}\right\} \mathrm{d} V\end{aligned}$
$Q_{\text {total }}(t)=Q_{\mathrm{f}}(t)+Q_{\mathrm{f}}^{*}(t)+Q_{\mathrm{m} \_ \text {free }}(t)+Q_{\mathrm{m} \_ \text {free }}^{*}(t)+Q_{\mathrm{m} \_ \text {ads }}(t)+Q_{\mathrm{m} \_ \text {ads }}^{*}(t)$
The δ13C1 of the produced gas can be calculated by:
$\delta^{13} \mathrm{C}_{1}(t)=\frac{\frac{\mathrm{d} Q_{\mathrm{f}}^{*}(t)}{\mathrm{d} t}+\frac{\mathrm{d} Q_{\mathrm{m} \_ \text {free }}^{*}(t)}{\mathrm{d} t}+\frac{\mathrm{d} Q_{\mathrm{m} \_ \text {ads }}^{*}(t)}{\mathrm{d} t}}{\left[\frac{\mathrm{~d} Q_{\mathrm{f}}(t)}{\mathrm{d} t}+\frac{\mathrm{d} Q_{\mathrm{m} \_ \text {free }}(t)}{\mathrm{d} t}+\frac{\mathrm{d} Q_{\mathrm{m} \_ \text {ads }}(t)}{\mathrm{d} t}\right] R_{\text {std }}}-1$
The inlet pressure, cumulative gas production and δ13C1 value calculated by the model were applied to the historical matching of the experimentally measured inlet pressure, cumulative gas production and δ13C1 value (partial data of stage 1 without sudden pressure drop), so as to determine the key parameters in the model (Table 2). As shown in Fig. 8, the isotopic fractionation model provides good fitting of multiple sets of experimental data of the two samples, indicating that the model can effectively characterize the gas flow behaviors and isotope fractionation characteristics during the production of deep coal-rock gas.
Table 2. Parameters in the isotopic fractionation model |
| Parameter | Value (Sample 1#) | Value (Sample 2#) |
|---|---|---|
| Average size of matrix pore | 5.50 nm | 5.16 nm |
| Initial permeability of matrix pore | 5.02×10⁻¹⁹ m2 | 1.52×10⁻¹⁸ m2 |
| Initial permeability of cleat/fracture | 1.71×10⁻¹⁸ m2 | 1.04×10⁻¹⁵ m2 |
| Initial matrix porosity | 1.5% | 1.4% |
| Initial cleat/fracture porosity | 2.31% | 3.75% |
| Langmuir volume | 22.2 m3/t | 23.6 m3/t |
| Langmuir pressure | 2.31 MPa | 1.82 MPa |
| Initial δ13C1 value | -28.05‰ | -31.04‰ |
| $D_{\mathrm{m} \_\mathrm{app}}^{*}$/Dm_app | 0.991 | 0.998 |
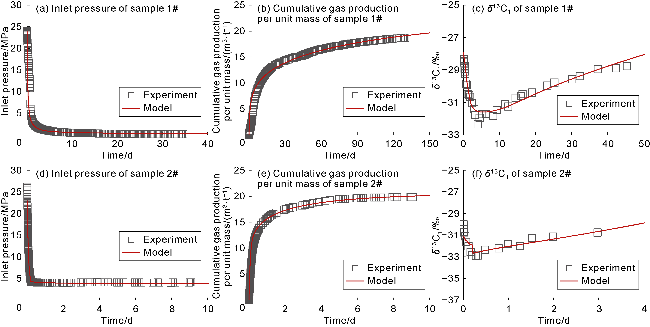
Fig. 8. History matching of measured inlet pressure, cumulative gas production and δ13C1 values by isotopic fractionation model. |
4. Evaluation of adsorbed/free gas production
The isotopic fractionation model can be used to calculate the interim contribution rate and recovery efficiency of adsorbed/free gas in the lifecycle depletion development process of deep coal-rock gas. The interim contribution rate of adsorbed/free gas stage refers to the ratio of the cumulative adsorbed/free gas production in a stage to the total cumulative gas production in the stage. The recovery efficiency of adsorbed/free gas refers to the ratio of the cumulative adsorbed/free gas production at a time to the original total adsorbed/free gas production. As shown in Fig. 9a, for sample 1#, the cumulative adsorbed/free gas production calculated by the isotopic fractionation model is basically consistent with the results calculated by the material balance method; for sample 2#, the cumulative adsorbed/free gas production calculated by the isotopic fractionation model is initially consistent with the results calculated by the material balance method, but later there is a deviation in the calculation by the material balance method, indicating that the isotopic fractionation model is more accurate than the material balance method. Based on the basic physical parameters of the cores, the original gas content of sample 1# calculated by the isotope fractionation model is 23.9 m3/t, including free gas of 5.5 m3/t (23.0%) and adsorbed gas of 18.4 m3/t; the original gas content of sample 2# is 30.7 m3/t, including free gas of 9.4 m3/t (30.6%) and adsorbed gas of 21.3 m3/t. Compared with sample 1#, sample 2# is higher in original free/absorbed gas content, which is consistent with its test results of higher porosity and fixed carbon content.
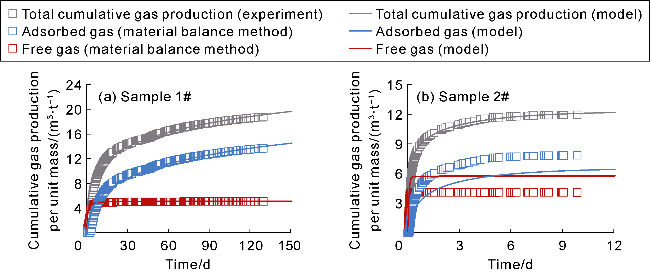
Fig. 9. Fitting of free/adsorbed gas production of samples 1# and 2#. |
With gas production from the cores, the pressure inside the cores decreases, and both samples show a decrease in the interim contribution rate of free gas and an increase in the interim contribution rate of adsorbed gas. The inflection point (P2) between stages II and III of isotopic fractionation in sample 1# occurs around 3.9 d (Fig. 10a), corresponding to the interim contribution rate of free gas being 55.7% (Fig. 10e). The P2 point of sample 2# occurs around 0.3 d (Fig. 10b), corresponding to the interim contribution rate of free gas being 73.1% (Fig. 10f). Notably, the two coal-rock samples have different degrees of cleat/fracture development, but both exhibit the dominance of free gas (interim contribution rate greater than 50%) in the stage II of isotopic fractionation. The recovery efficiency of free gas corresponding to P2 of samples 1# and 2# are 89.6% and 84.9%, and that of adsorbed gas are 16.9% and 8.6%, respectively (Fig. 10g, 10h). This indicates that most of the free gas has been produced in stages I and II of isotopic fractionation, with the recovery efficiency greater than 80%, but there is still a large amount of adsorbed gas remaining, which is the reason for the high initial production rate and long stable production period of deep coal-rock gas wells. In the initial production stage (before P2), the apparent average pressure of cores declines rapidly (Fig. 10c, 10d), and the recovery efficiency of adsorbed/free gas increases significantly, with the recovery efficiency of free gas growing at a rate greater than that of adsorbed gas (Fig. 10g, 10h). In the middle and late stages (after P2), the pressure declines slowly (Fig. 10c, 10d), and the recovery efficiency of free gas grows slowly, at a rate lower than that of adsorbed gas (Fig. 10g, 10h). The staged pressure control production method effectively increases the recovery efficiency of adsorbed/free gas, especially free gas that is difficult to produce. When the pressure drops to the atmospheric level (after 150 d), the recovery efficiency of free gas approaches 100%. The producibility of adsorbed gas depends on the desorption capacity of the rock. Although the permeability of sample 2# is higher than that of sample 1#, during the production period of 150 d to 200 d, the interim recovery efficiency of adsorbed gas in sample 2# (3.9%) is lower than that in sample 1# (4.8%). Sample 2# has higher "vitrinite + inertinite" content and lower Langmuir pressure, which are 96.4% and 1.82 MPa, respectively, in contrast to the values (93.6% and 2.31 MPa) of sample 1#. Generally, the adsorption capacity of vitrinite and inertinite to methane is higher than that of exinite. The lower the Langmuir pressure, the greater the adsorption capacity of rocks is. The measured "vitrinite + inertinite" content and the Langmuir pressure determined by history matching both indicate that sample 2# has greater adsorption capacity, so its adsorbed gas production capacity in the late stage is weaker than that of sample 1#.
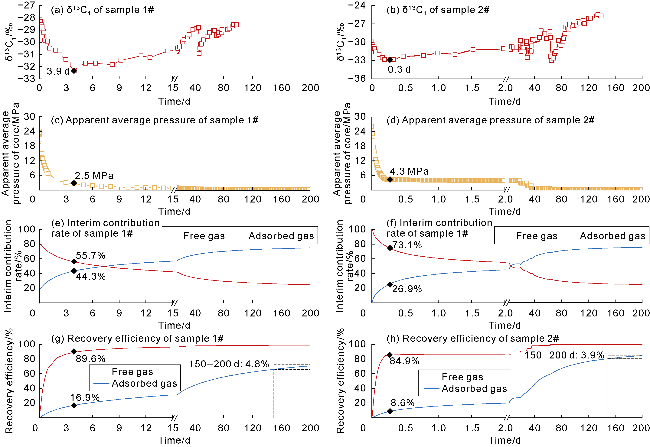
Fig. 10. Adsorbed/free gas production behaviors in the production process of samples 1# and 2#. |
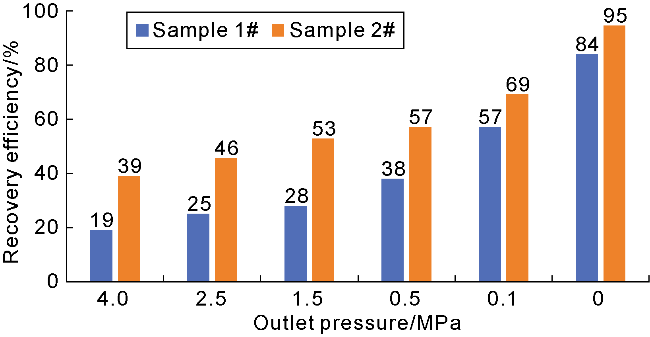
The experimental results indicate that coal-rock gas has the characteristics of low supply capacity with high permeability channels, which is closely related to the U-shaped pore structures comprising both micropores and cleats/fractures in coal rocks. The samples of No. 8 coal rock with varying cleat/fracture development from the Ordos Basin have the permeability dominantly ranging from 0.01×10⁻³ μm2 to 0.50×10⁻³ μm2. As shown in Fig. 11, however, when the outlet pressure is reduced to 4 MPa (close to the on-site bottomhole pressure), the recovery efficiency is relatively low (19% for sample 1# and 39% for sample 2#). When it is further reduced to 0.1 MPa, the recovery efficiency is only 57% and 69%, respectively. Even by the end of the production, there is still 16% of the gas remaining in sample 1#, indicating that the flow channels in the matrix of coal rock are small, leading to abnormally slow desorption and gas supply. Coal rock has a smaller pore size and higher capillary pressure than shale, and deep coal-rock gas in water-containing reservoirs is more susceptible to capillary resistance when it flows through micropores after desorption, which is embodied as a long period of low yield in the later stage. In our experiments, dry cores were adopted, and the influence of water was neglected. Once water or fracturing fluid is added to the flow channel, it is more difficult for gas molecules to break through the water phase blockage. Therefore, the key to effectively enhancing the recovery efficiency of adsorbed gas in coal rocks lies in the effective improvement of the gas desorption capacity in the late stage. The experiment provides a realistic simulation of the coal-rock gas production process, but the influence of geometric scale and time span may lead to differences between the isotopic fractionation features (fractionation amplitude and duration at each stage) of the experiment and the actual coal-rock gas wells. Further verification is required depending on on-site production monitoring and numerical simulation.
Fig. 11. Recovery efficiency of samples 1# and 2# at different outlet pressures |
5. Conclusions
In the production process of deep coal-rock gas, its δ13C1 value exhibits a three-stage isotopic fractionation model consisting of "stable (I) → decrease (II) → increase (III)". The sudden drop of boundary pressure (bottomhole flow pressure) can cause δ13C1 values to approach the gas source value in the previous stage. If the pressure drops suddenly in stage III, the δ13C1 value will exhibit the characteristics of "rapid decrease followed by continued increase".
Unlike shallow CBM, deep coal-rock gas is characterized by preferential production of free gas and long-term supply of adsorbed gas. The proportion of original free gas in samples 1# and 2# is 23.0% and 30.6%, respectively. The interim contribution rate of free gas corresponding to the inflection point between stages II and III of isotopic fractionation is 55.7% and 73.1% in samples 1# and 2#, respectively, indicating that the cumulative gas production in the first two stages of isotopic fractionation is mainly contributed by free gas.
Coal-rock reservoirs have the characteristics of high permeability flow channels and low supply capacity, and the key to long-term stable production of coal-rock gas still lies in the efficient production of adsorbed gas. In the experiment, when the bottom hole pressure was reduced to 4 MPa, the recovery efficiency did not exceed 40%; and by the end of the production, there was still 16% of the gas remaining in sample 1#. For the coal-rock gas dominated by adsorbed gas, effective improvement of the recovery efficiency of adsorbed gas remains crucial to enhanced gas recovery. The feasibility of production modes such as staged pressure control production, and high-pressure active desorption (e.g. fracturing fluid adsorption and replacement, CO2 adsorption and replacement, and heating), will be further considered to improve the recovery of coal-rock gas.
Nomenclature
c—mass balance coefficient, Pa;
Df—diffusion coefficient of 12CH4 in cleats/fractures, m2/s;
$D_{\mathrm{f}}^{*}$—diffusion coefficient of 13CH4 in cleats/fractures, m2/s;
Dm—diffusion coefficient of 12CH4 in matrix pores, m2/s;
$D_{\mathrm{m}}^{*}$—diffusion coefficient of 13CH4 in matrix pores, m2/s;
Dm_app—apparent diffusion coefficient of 12CH4 in matrix pores, m2/s;
$D_{\mathrm{m} \_\mathrm{app}}^{*}$—apparent diffusion coefficient of 13CH4 in matrix pores, m2/s;
G0—total free gas volume in the core, m3;
Gfree—volume of free gas under the pressure p, m3;
K—Langmuir constant of 12CH4 (K=1/pL), Pa-1;
K*—Langmuir constant of 13CH4, Pa-1;
L—cleat/fracture spacing, m;
N—number of cleat/fracture groups (1, 2 or 3);
p—average pressure within the core at any time, Pa;
p0—initial average pressure within the core, Pa;
pf—12CH4 pressure in cleats/fractures, Pa;
$p_{\mathrm{f}}^{*}$—13CH4 pressure in cleats/fractures, Pa;
pin—inlet pressure of core at any time, Pa;
pL—Langmuir pressure, Pa;
pm—12CH4 pressure in matrix pores, Pa;
$p_{\mathrm{m}}^{*}$—13CH4 pressure in matrix pores, Pa;
pout—outlet pressure of core at any time, Pa;
Qf—cumulative production of 12CH4 in cleats/fractures, m3;
$Q_{\mathrm{f}}^{*}$—cumulative production of 13CH4 in cleats/fractures, m3;
Qm_ads—cumulative production of adsorbed 12CH4 in matrix pores, m3;
$Q_{\mathrm{m} \_\mathrm{ads}}^{*}$—cumulative production of adsorbed 13CH4 in matrix pores, m3;
Qm_free—cumulative production of free 12CH4 in matrix pores, m3;
$Q_{\mathrm{m}_{-} \text {free }}^{*}$—cumulative production of free 13CH4 in matrix pores, m3;
Qtotal—total cumulative gas production, m3;
R—gas constant, 8.314 J/(mol・K);
Ro—vitrinite reflectance, %;
Rstd—mass ratio of 13CH4 to 12CH4 in the standard sample, dimensionless;
s—element area, m2;
S—area of inlet end, m2;
t—time, s;
T—rock temperature, K;
V—volume infinitesimal, m3;
VL—Langmuir volume, m3/kg;
Vm—molar volume of gas, m3/mol;
Vstd—molar volume of gas under the standard condition, 0.022 4 m3/mol;
Z0—gas compressibility factor corresponding to p0, dimensionless;
Zf—gas compressibility factor in cleats/fracture; dimensionless;
Zg—gas compressibility factor corresponding to p, dimensionless;
Zin—gas compressibility factor corresponding to pin, dimensionless;
Zm—gas compressibility factor in matrix pores, dimensionless;
Zout—gas compressibility factor corresponding to pout, dimensionless;
α*—characteristic parameter of cleats/fractures, m-2;
ρr—rock density, kg/m3;
ρs—matrix density, kg/m3;
ϕf—cleat/fracture porosity, %;
ϕm_eff—effective porosity of matrix pores, %.