

Introduction
Staged multi-cluster fracturing in horizontal wells is a key technique for the large-scale benefit development of unconventional oil and gas resources. Current fracturing practices in unconventional reservoirs are characterized by “high pumping rate, large fluid volume, high proppant loading, variable fluid viscosity, and multi-size proppants.” As a result, the postfrac fracture network often exhibits a multi-level structure comprising main fractures, branch fractures, and microfractures [1-2]. However, due to the significant width disparity between main and secondary fractures, proppant transport at fracture intersections is frequently obstructed, causing large amounts of proppants to accumulate in the main fractures connected to the wellbore [3-5]. This results in insufficient proppant support volume in secondary fractures and difficulty in maintaining stable production after fracturing. Therefore, investigating the microscopic transport mechanisms of proppants at fracture intersections is of great importance for achieving effective support of branch fractures.
To date, extensive laboratory experiments have been conducted to investigate proppant transport and placement within fractures. For main fractures, experiments under varying pumping rates, proppant concentrations, and proppant sizes were carried out to examine the formation mechanisms of sand bank [6-7], a dimensionless parameter model for predicting proppant equilibrium height and placement area was established [8], and the influence of fracture surface roughness on proppant placement was revealed [9]. For multi-level fracture systems, studies recognized two primary mechanisms of proppant entry into fractures: gravitational rolling and fluid suspension [10]. The effects of geometry, dip and initiation timing of branch fractures and injection sequence of different particle sizes on proppant transport and placement were analyzed [11-13]. These studies primarily relied on extracting sand bank parameters from experimental images, thus providing a macroscopic description of sand bank formation and accumulation in main and branch fractures.
To enable quantitative characterization of proppant transport velocity, particle image velocimetry (PIV) has been introduced into proppant transport experiments. At present, this technique is mainly used to analyze the velocity field distributions of proppants under different fracturing fluid systems and operational conditions [14-15], as well as within tortuous and rough fractures [16-17]. Moreover, based on PIV, analytical methods for coupled solid-liquid velocity fields have been developed to elucidate the motion characteristics and velocity evolution mechanisms of proppants at different spatial locations within main fractures [18-19]. However, conventional PIV is limited to two-dimensional planar measurements and cannot capture velocity components perpendicular to the main fracture, thereby failing to resolve the detailed microscopic transport process by which proppants deflect from the main fracture into branch fractures.
At present, studies on the three-dimensional deflection and entry behavior of proppants primarily rely on theoretical analyses and numerical simulations [20-23], while quantitative experimental investigations remain scarce. To address this gap, this study introduced stereoscopic particle image velocimetry (SPIV) to measure the three-dimensional velocity of proppants within a fracture configuration where a vertical main fracture intersects a vertical branch fracture at 90°. The deflection and entry behavior of proppants into branch fractures under various operating conditions were analyzed, with the aim of providing insights for optimizing hydraulic fracturing design.
1. Experimental device and principle
1.1. Experimental device
The experiments were conducted using a self-developed physical simulation system for proppant transport, which consists of five modules: a circulation and pumping module, a control module, a flat-plate fracture module, a laser measurement module, and an imaging acquisition module. The detailed structure and functions of each module can be found in Ref. [24]. Based on shale core observations and true triaxial mechanical test results [5,25], the analysis of local fracture structures revealed that multistage fracture networks are composed of two basic units: “vertical main fracture-vertical branch fracture” and “vertical main fracture-horizontal branch fracture.” Among these, the “vertical-vertical” type is more prevalent, and thus was selected as the focus of this study (Fig. 1). In the experiments, the intersection angle between the branch fracture and the main fracture was set to 90°.
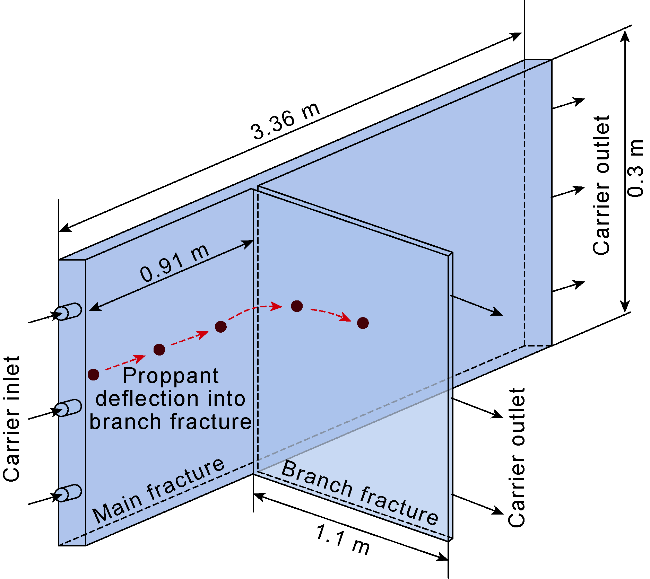
Fig. 1. Vertical-vertical fracture interaction unit. |
1.2. Experimental material
The experimental materials mainly included proppant and slickwater fracturing fluid. The proppants were quartz sand with particle size ranges of 0.212-0.425 mm (40/70 mesh, abbreviated as 4070 proppant), 0.106-0.212 mm (70/140 mesh, abbreviated as 7014 proppant), and 0.075-0.150 mm (100/200 mesh, abbreviated as 1020 proppant). Slickwater fracturing fluids with different viscosities were prepared by adjusting the dosage of drag-reducing agent, which consisted of polyacrylamide.
1.3. Principle of SPIV
PIV is widely used to investigate single-phase flow characteristics within a specified flow domain. In this technique, a sufficient number of tracer particles are introduced into a transparent fluid medium. With density comparable to that of the fluid, these particles exhibit excellent flow-following behavior, and their motion can be regarded as representative of the fluid flow field. A laser source and a camera are arranged perpendicularly, with the laser illuminating the flow field from above. A high-speed camera captures successive image pairs at specific time intervals to obtain high-frequency particle images, and the tracer particle velocities are then calculated using a cross-correlation algorithm, which reflect the instantaneous fluid velocity field [26]. SPIV is an extension of the conventional two-dimensional PIV technique, capable of measuring three-component velocity fields (3C) within a two-dimensional plane (2D). Hence, it is also referred to as the 2D-3C PIV method [27]. This approach employs two or more cameras to record particle images simultaneously, and by utilizing the parallax effect, reconstructs the third velocity component perpendicular to the measurement plane [28] (Fig. 2). In this study, the particle group is treated as a continuum, with proppant particles serving as tracer particles [29]. Consequently, the measured velocity field reflects the self-motion characteristics of the proppant. Through SPIV measurements, the three-dimensional velocity distribution of the proppant particle group can thus be obtained.
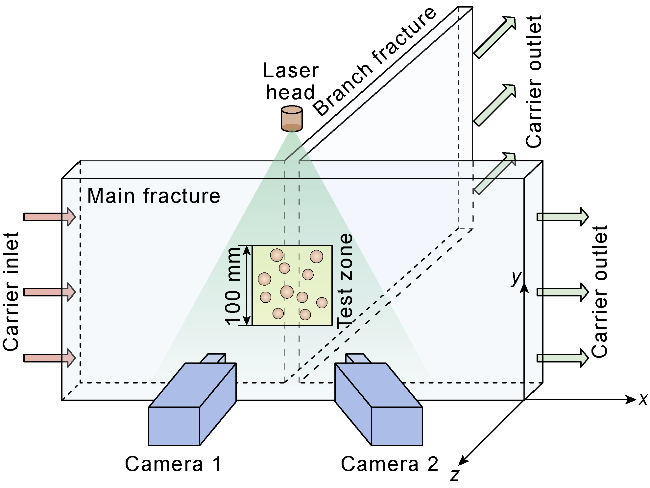
Fig. 2. Schematic diagram of double-camera SPIV measurement. |
2. Experimental procedures and scheme
2.1. Procedures
The experimental procedures were conducted as follows: (1) The experimental apparatus was connected, sealed integrity was checked, the control cabinet was activated, and all data were reset to zero. (2) Spatial calibration was performed to establish the mapping relationship between the two-dimensional pixel space of the SPIV cameras and the three-dimensional physical space. The laser plane (measurement zone) was positioned adjacent to the wall of the main fracture at the branch fracture side. (3) Image acquisition parameters were adjusted, including frame interval, laser intensity, and camera aperture, to ensure consistent exposure between the two consecutive frames. Each acquisition produced four raw particle images. (4) Fracturing fluid was prepared in the liquid mixing tank and sand mixing tank, ensuring consistent viscosity across both tanks, without the addition of proppant at this stage. (5) The outlet valves of the two tanks were opened, and the screw pump was started to inject fracturing fluid into the fracture until the fracture was completely filled. (6) Proppant was weighed and added into the sand-mixing tank using a quantitative sand-feeding device, followed by thorough mixing. (7) Pumping rate was adjusted, and the carrier fluid was injected into the fracture to initiate the experiment. (8) SPIV measurements were performed in the selected region. Optical images of laser reflections from proppant at the fracture intersection were recorded and stored on the computer. (9) After all proppant was injected, the experiment was terminated, and all equipment was shut down. (10) The apparatus was cleaned, and the fracturing fluid and proppant were collected. (11) The optical images were processed using DaVis software to obtain the three-dimensional velocity field of the proppant.
2.2. Experimental Scheme
To ensure that the experimental fractures exhibited hydrodynamic similarity with field-scale hydraulic fractures, the Reynolds numbers in the laboratory and in situ conditions were matched. Assuming a bi-wing fracture with uniform fluid injection into each cluster, the pumping rate conversion formula was derived [12,30]:
$Q_{\mathrm{e}}=\frac{1000 Q_{\mathrm{f}}}{2 N} \frac{h_{\mathrm{e}}}{h_{\mathrm{f}}}$
According to the engineering parameters of shale gas volume fracturing operations reported in Ref. [31], the typical field pumping rate ranges from 12 m3/min to 18 m3/min, with 6-12 clusters per stage. The hydraulic fracture height generally ranges from 10 m to 40 m, while the fracture width is usually less than 10 mm. Based on these parameters, this study adopted a pumping rate of 12-16 m3/min, a fracture height of 10-20 m, a fracture width of 6 mm, and 8 clusters per stage. For the experimental apparatus with a fracture height of 0.3 m and width of 6 mm, the calculated equivalent experimental pumping rate was 11.25-30.00 L/min, according to Eq. (1). Excessive proppant concentration can cause image overexposure, leading to inaccuracies in velocity interpretation. Therefore, the experimental proppant concentration was fixed at 4%. On the basis of the orthogonal “vertical main fracture-vertical branch fracture” configuration, proppant velocity field tests were conducted under different pumping rates, fracturing fluid viscosities, proppant sizes, and fracture widths (Table 1).
Table 1. Experimental scheme for proppant entry velocity at vertical-vertical fracture intersection |
| Number | Pumping rate/ (L·min−1) | Viscosity/ (mPa·s) | Proppant type | Main fracture width/mm | Branch fracture width/mm |
|---|---|---|---|---|---|
| 1 | 12 | 1.0 | 7014 | 6 | 3 |
| 2 | 18 | 1.0 | 7014 | 6 | 3 |
| 3 | 24 | 1.0 | 7014 | 6 | 3 |
| 4 | 30 | 1.0 | 7014 | 6 | 3 |
| 5 | 12 | 2.5 | 7014 | 6 | 3 |
| 6 | 12 | 10.0 | 7014 | 6 | 3 |
| 7 | 12 | 30.0 | 7014 | 6 | 3 |
| 8 | 12 | 2.5 | 4070 | 6 | 3 |
| 9 | 12 | 2.5 | 1020 | 6 | 3 |
| 10 | 12 | 2.5 | 7014 | 6 | 1 |
2.3. Characterization parameters
In SPIV, the illuminated plane is positioned along the main fracture wall adjacent to the entrance of branch fracture. The measurement provides three-dimensional velocity vectors projected onto the two-dimensional plane, including the physical quantities x, y, vx, vy, and vz, where (x, y) represent the grid center coordinates of the plane, and vx, vy, and vz are the corresponding three velocity components. Through data processing, the distribution of proppant velocity field within the measurement region can be obtained. In this study, the positive z-axis is defined as pointing from the laser measurement plane toward the midline of the main fracture. Accordingly, when proppant migrates toward the branch fracture, its velocity component along the z-axis is negative. The proppant deflection angle, α, is defined as 0° when aligned with the main fracture flow direction; α is negative when the trajectory deflects counterclockwise toward the branch fracture (Fig. 3). The closer α approaches −90°, the more favorable the condition for proppant entry into the branch fracture.
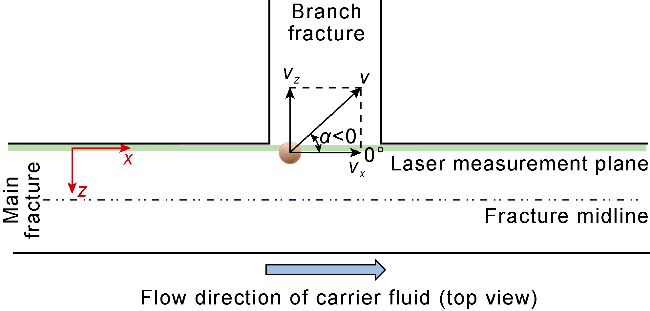
Fig. 3. Schematic diagram of coordinate axes and deflection angle orientation. |
The characterization of proppant entry behavior into branch fractures is performed using the following parameters: streamline distribution in the x-y plane, z-axis velocity component distribution, and proppant deflection angle. Streamline distribution provides an intuitive representation of proppant transport within the main fracture and highlights velocity differences before and after branching. The z-axis velocity component and the deflection angle directly quantify the proppant's ability to enter branch fractures.
3. Results and discussion
3.1. Analysis of the process of proppant deflection into branch fracture
A systematic analysis of the three-dimensional velocity measurements under different operating conditions reveals that the average deflection angle of proppants along the main fracture exhibits a consistent trend. Based on the deflection angle characteristics of proppants before and after the fracture intersection, the main fracture can be divided into five regions (Fig. 4). (1) Pre-entry transition region: The laser plane is positioned close to the main fracture wall adjacent to the branch fracture, and the equilibrium positions of particles maintain a certain distance from the wall [32], so when entering the measurement region, the proppants tend to migrate toward the main fracture midline. The average deflection angle is positive, and particle motion exhibits strong fluctuations. (2) Pre-entry stabilization region: When proppants approach the entrance of the branch fracture, the average deflection angle gradually approaches zero, and particle motion becomes increasingly stable. (3) Fracture-mouth deflection region: Within the test zone, proppants begin to deflect and migrate toward the branch fracture. The average deflection angle becomes negative. The length of this zone (about 5 mm) exceeds the branch fracture width (3 mm), indicating that proppants already exhibit a deflection trend before reaching the fracture mouth. (4) Rear absorption region: When the proppants that fail to deflect and enter the branch fracture at the intersection continues to migrate downstream along the main fracture, a small portion of proppants are re-entrained into the branch fracture by the drag of branch-fracture fluid. These proppants display deflection angles between -180° and -90°, while the average deflection angle in this region remains positive. (5) Movement away from the fracture mouth region: For the majority of proppants that fail to enter the branch fracture, the tendency to deflect toward the branch weakens significantly as they move farther away from the branch fracture mouth, while the tendency to deflect toward the midline of the main fracture strengthens. The average deflection angle thus becomes positive. In these five regions, the motion directions of proppants near the fracture wall exhibit clear distinctions (Fig. 5).
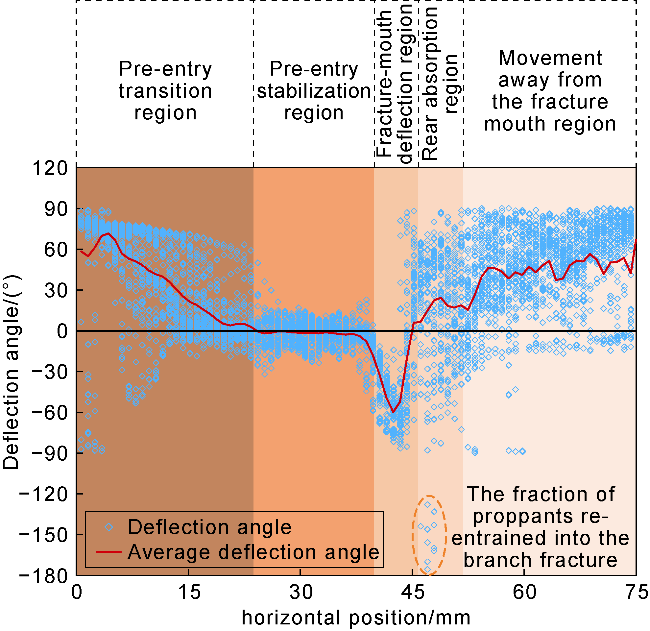
Fig. 4. Characteristics of proppant deflection angle across different regions within the main fracture near the intersection (horizontal position refers to the distance from the left boundary of the test zone, the same below). |
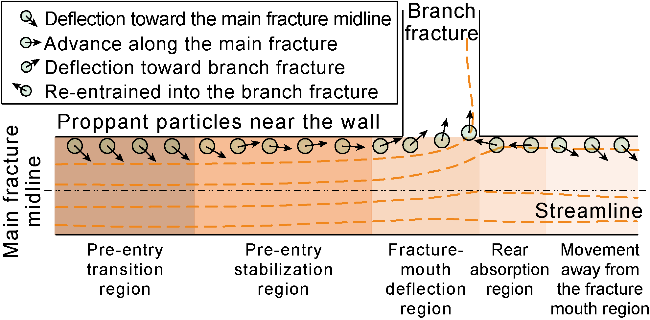
Fig. 5. Top-view diagram of proppant motion states in different regions. |
3.2. Effect of pumping rate
Schemes 1-4 correspond to three-dimensional velocity tests of proppant transport under varying pumping rates. At the stage before the formation of a distinct sand bank, the three-dimensional velocity field data of suspended proppants entering the fracture at different pumping rates were extracted and processed to analyze the transport characteristics. In the proppant velocity field distribution (Fig. 6), the color indicates the magnitude of three-dimensional velocity of proppants in the main fracture, while the arrows and streamlines represent their motion direction in the two-dimensional plane. At a pumping rate of 12 L/min, the flow regime is laminar, and the proppant velocity in the main fracture after flow diversion is less than 0.08 m/s. Under these conditions, gravity-induced sedimentation of proppants is evident, and streamlines are deflected downward. When the pumping rate increases to 18 L/min, the proppant velocity in the main fracture after diversion rises to approximately 0.14 m/s, the horizontal drag force exerted by the fluid on proppants becomes stronger, the sedimentation trend is mitigated, and the degree of downward streamline deflection decreases. When the pumping rate reaches 24 L/min or higher, the flow field within fractures enters a turbulent regime, in which transient fluid motion exhibits random pulsations. This enhances the irregularity of proppant movement, with streamlines near both sides of the branch-fracture entrance showing varying degrees of fluctuation.
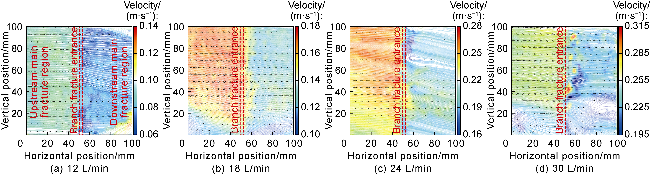
Fig. 6. Effect of pumping rate on the proppant flow field distribution (the vertical position refers to the distance relative to the lower boundary of the test zone, the same below). |
The distribution of the z-axis velocity component vz of the proppant is shown in Fig. 7, where orange denotes positive vz, indicating proppants moving toward the midline of the main fracture, while green denotes negative vz, indicating proppants moving toward the branch fracture. At 12 L/min, the region near the branch fracture entrance is dominated by orange, suggesting that proppants far from the branch fracture entrance primarily migrate toward the main fracture midline. As the pumping rate increases, the green region near the entrance expands, indicating that proppants gain a stronger capacity to enter the branch fracture.
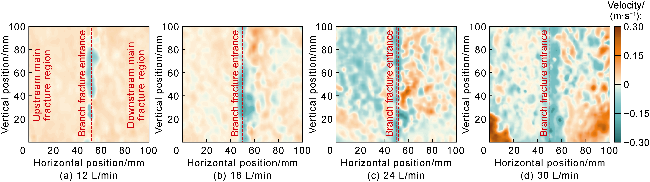
Fig. 7. Effect of pumping rate on the distribution of the z-axis velocity component of the proppant. |
Fig. 8a presents the relationship between vz at the midline of the branch fracture entrance and fracture height. The curves show that higher pumping rates lead to greater velocity fluctuations, suggesting that the proppant entry process becomes increasingly unsteady. Fig. 8b shows the probability density curves of z-axis velocity component corresponding to Fig. 8a. The area enclosed by any two points on the probability density curve and the horizontal axis represents the probability that the z-axis velocity component of proppants falls within that interval. Since proppants migrating into the branch fracture exhibit negative vz, a leftward shift of the curve indicates stronger entry capacity. Meanwhile, the area enclosed by the curve and the negative half of the horizontal axis represents the proportion of proppants migrating into the branch fracture at the entrance midline. In this study, this proportion is defined as the “proppant entry percentage at the branch entrance”, which quantitatively characterizes the ability of proppants to enter the branch fracture. Results indicate that when the pumping rate increases from 12 L/min to 30 L/min, the proppant entry percentage at the entrance increases from 78.1% to 96.8%, an improvement of 18.7 percentage points. Fig. 8c shows the relationship between pumping rate and the average deflection angle in the main-flow direction. With increasing pumping rate, the extreme value of the average deflection angle at the branch fracture entrance midline changes from −50.54° to −68.95°, representing a 36.4% increase in absolute value, which indicates an enhanced ability of proppants to enter the branch fracture.
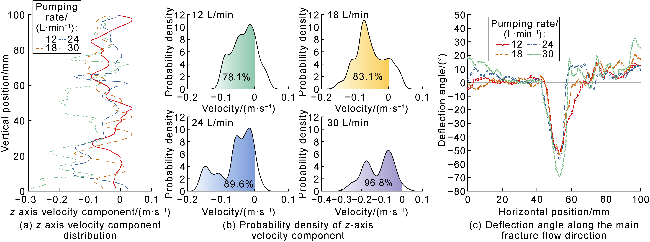
Fig. 8. Effect of pumping rate on the z-axis motion characteristics of proppant at the midline of the branch fracture entrance and on the deflection angle along the main fracture flow direction. |
3.3. Effect of fracturing fluid viscosity
Schemes 1 and 5-7 investigated the effect of fracturing fluid viscosity on the proppant flow field distribution. The results indicate that at lower viscosities (less than or equal to 2.5 mPa•s), there is a significant velocity difference between the two sides of the branch fracture entrance within the main fracture. The streamlines downstream of the entrance deflect downward, suggesting that the disturbance caused by fluid diversion into the branch fracture accelerates proppant settling (Fig. 6a, Fig. 9). With increasing viscosity, the degree of downward deflection of streamlines diminishes, the streamline distribution tends to become uniform, and the velocity magnitude gradually tends to be the same, indicating a reduction in the diverted flow rate into the branch fracture. This observation is consistent with the flowmeter monitoring results [33].
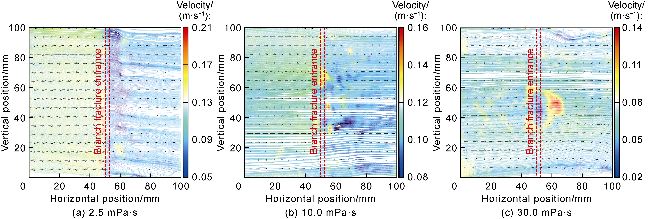
Fig. 9. Effect of fluid viscosity on the proppant flow field distribution. |
When the viscosity increases from 1 mPa·s to 2.5 mPa·s, the area of negative vz (green) in the vicinity of the branch entrance expands, implying enhanced proppant transport into the branch fracture (Fig. 7a, Fig. 10a). At a viscosity of 10.0 mPa·s, vz near the entrance become positive (orange), which is unfavorable for proppant entry (Fig. 10b). When the viscosity further increases to 30.0 mPa·s, proppant particles are unable to enter the branch and tend to accumulate and collide at the entrance, forming a localized orange zone in the middle of the branch entrance (Fig. 10c). As viscosity increases, both the z-axis velocity distribution and the corresponding probability density curve at the branch entrance midline shift leftward and then rightward (Fig. 11a, 11b). The proppant entry percentage at the branch entrance initially increases from 78.10% to 96.89% and then decreases sharply to 26.16% (Fig. 11c). Simultaneously, the average deflection angle at the branch entrance in the main fracture changes from negative values (−50.54°, −51.82°, −22.80°) to a positive value (39.52°), indicating a transition in proppant movement from deflecting toward the branch fracture to deflecting back toward the main fracture midline (Fig. 11d). These results demonstrate that increasing viscosity slightly enhances but subsequently significantly weakens the ability of proppant to enter branch fractures. In field fracturing operations, excessive fluid viscosity reduces proppant distribution within branch fractures, hindering the formation of effective support. The underlying mechanism is that higher viscosity increases proppant carrying capacity, retards proppant settling, and enhances the suspension and entry of proppant into branches. However, further increases in viscosity elevate the elastic modulus of slickwater and strengthens resistance to shear deformation [34], thereby reducing fluid diversion into branches. Consequently, the velocity component and deflection angle of proppant entry into branch fractures decrease.
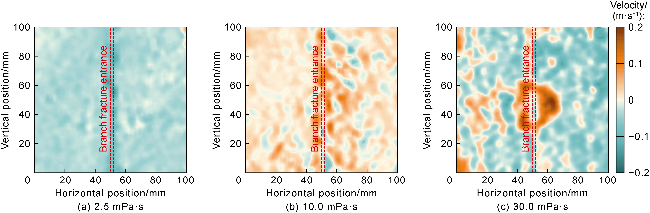
Fig. 10. Effect of fluid viscosity on the distribution of the z-axis velocity component of the proppant. |
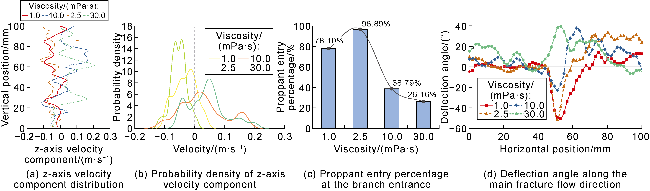
Fig. 11. Effect of fluid viscosity on the z-axis motion characteristics of proppant at the midline of the branch fracture entrance and on the deflection angle along the main fracture flow direction. |
3.4. Effect of proppant particle size
Schemes 5, 8, and 9 examined the effect of different particle sizes on the three-dimensional velocity characteristics of proppant. The results show that smaller proppant particles lead to weaker downward deflection of streamlines on the right side of the branch entrance in the main fracture, with streamlines becoming more horizontal (Fig. 12 and Fig. 9a). This indicates that smaller particles exhibit stronger resistance to the disturbance caused by fluid diversion at the branch entrance, better suspension capability, and longer transport distance.
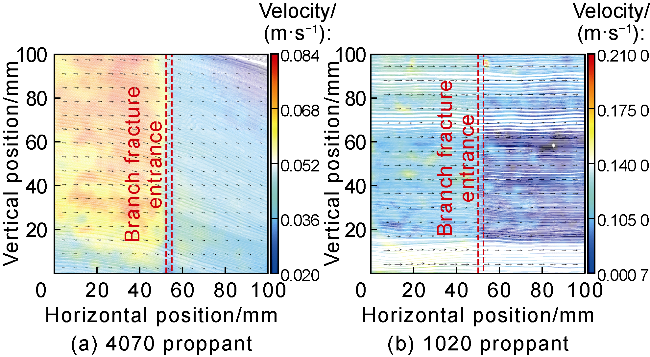
Fig. 12. Effect of particle size on the proppant flow field distribution. |
In addition, smaller particle sizes result in a wider distribution area of negative vz (green) near the branch entrance (Fig. 13, Fig. 10a), suggesting enhanced proppant entry into branch fractures. When the proppant type changes from 4070 to 1020, the z-axis velocity component curve at the midline of the branch entrance in the main fracture shifts leftward overall (Fig. 14a). The distribution range of the probability density curve expands, and the proppant entry percentage at the branch entrance increases by 24.15 percentage points from 72.18% to 96.33% (Fig. 14b). Meanwhile, the extreme value of the average deflection angle at the branch entrance in the main fracture changes from −22.05° to −56.25° (Fig. 15), with its absolute value increasing by 155.1%, indicating a significant enhancement in the ability of proppant to enter branch fractures.
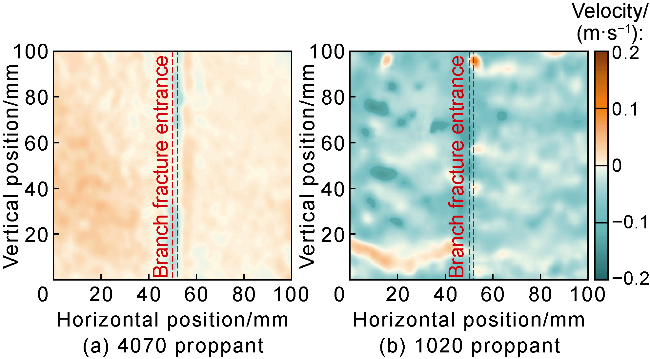
Fig. 13. Effect of particle size on the distribution of the z-axis velocity component of the proppant. |
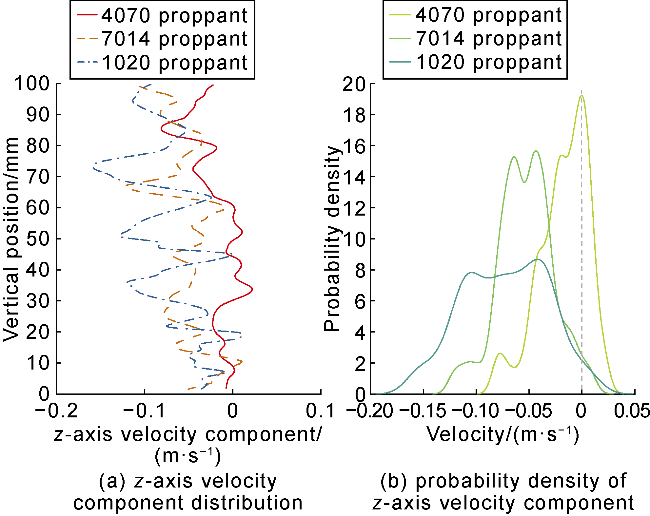
Fig. 14. Effect of particle size on the z-axis motion characteristics of proppant at the midline of the branch fracture entrance. |
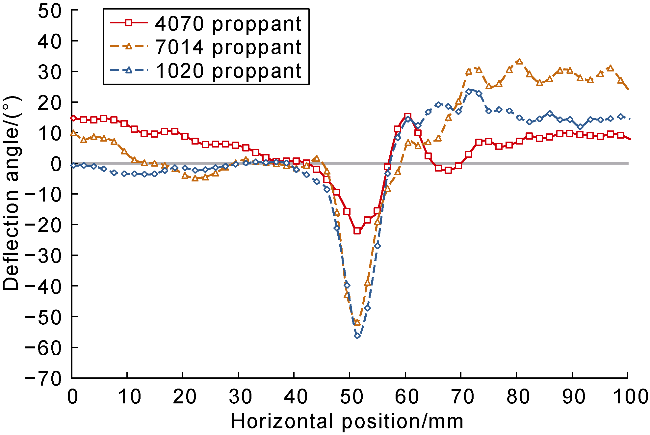
Fig. 15. Effect of particle size on the average deflection angle along the main fracture flow direction. |
The underlying mechanism is that smaller proppant particles have stronger flow-following capability, are less prone to collisions and kinetic energy loss at the branch entrance, and therefore show enhanced entry ability. During hydraulic fracturing operations, it is recommended to ensure a sufficient proportion of smaller particles such as 7014 proppant, and to explore the use of 1020 proppant or even finer proppant to secure effective support within branch fractures. In contrast, larger particles such as 4070 proppant have difficulty entering branch fractures and are more suitable for later-stage injection to provide support within the main fracture.
3.5. Effect of branch fracture width
Schemes 5 and 10 investigated the effect of different branch fracture widths on the three-dimensional velocity characteristics of proppant. The results indicate that narrower branch fractures lead to smaller velocity differences between the two sides of the branch entrance in the main fracture (Fig. 9a and Fig. 16a), and thus a reduced fluid diversion into the branch fracture. Moreover, with decreasing branch fracture width, the distribution area of negative vz (green) within the test region becomes smaller (Fig. 10a and Fig. 16b), suggesting reduced proppant entry into the branch.
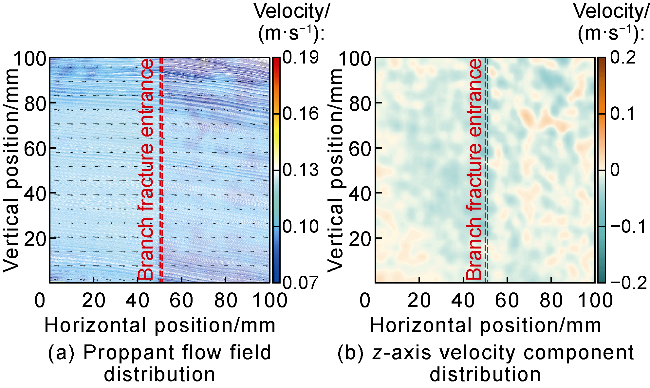
Fig. 16. Flow field characteristics of proppant particles at a branch fracture width of 1 mm. |
When the branch fracture width decreases from 3 mm to 1 mm, both the z-axis velocity component and its probability density curve shift rightward (Fig. 17). Consequently, the proppant entry percentage at the branch entrance decreases from 96.89% to 86.48%, while the extreme value of the average deflection angle at the branch entrance in the main fracture changes from −51.82° to −18.97° (Fig. 18), corresponding to a 63.4% reduction in absolute value. These results indicate that proppant entry into the branch fracture weakens as the fracture width narrows. The underlying mechanism is that narrower branch fractures reduce the fluid diversion capacity, weakening the ability of the fluid to carry proppant into the branch. In addition, particle collisions at the branch entrance intensify, further diminishing the likelihood of proppant entering the branch fracture.
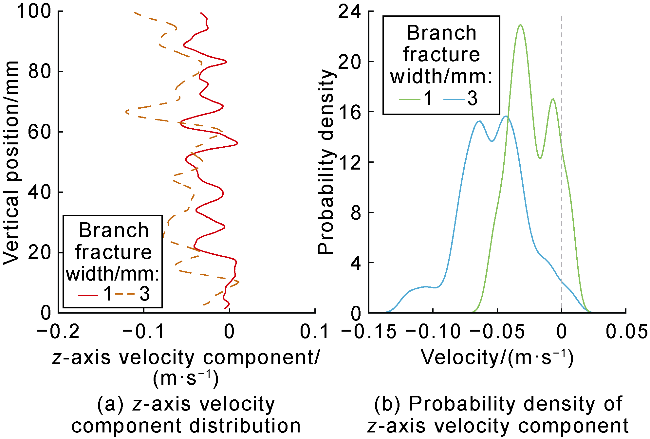
Fig. 17. Effect of branch fracture width on the z-axis motion characteristics of proppant at the midline of the branch fracture entrance. |
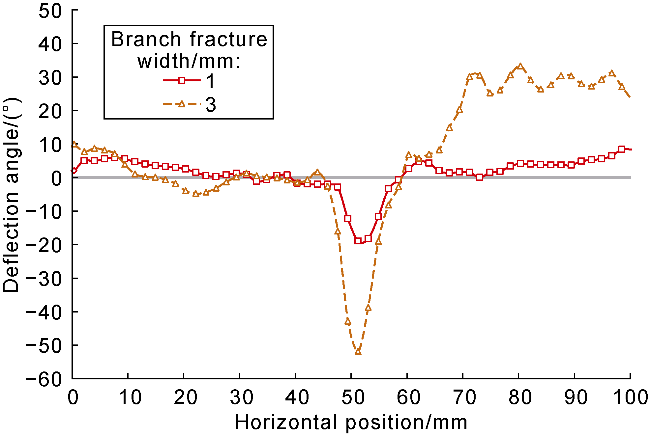
Fig. 18. Effect of branch fracture width on the average deflection angle along the main fracture flow direction. |
3.6. Analysis of the dominant factors
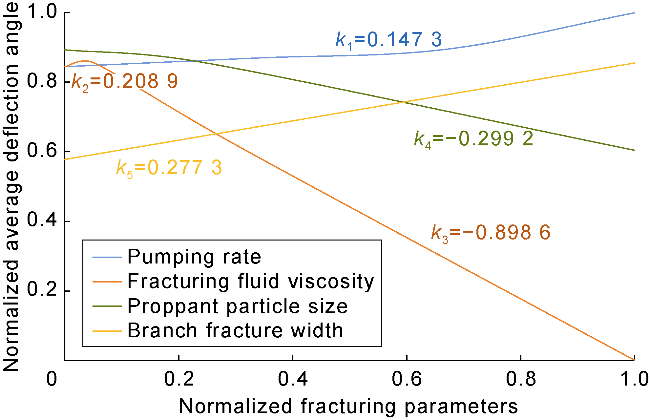
To clarify the influence of different factors on proppant entry into branch fracture, the average deflection angle of proppant along the midline of the branch fracture entrance was selected as the evaluation metric. The opposite number of the deflection angle and each experimental parameter were normalized via Eq. (2), with the proppant particle size range represented by its mean diameter, to analyze the influence degree of each factor. The normalization formula is:
$A_{\mathrm{norm}}=\frac{A-A_{\min }}{A_{\max }-A_{\min }}$
Fig. 19 shows the results. It can be observed that increasing pumping rate and branch fracture width, as well as reducing proppant size, all lead to an increase in proppant deflection angle, which favors proppant entry into branch fractures. With increasing fracturing fluid viscosity, the proppant deflection angle first increases and then decreases, indicating that excessive viscosity is unfavorable for proppant entry. Based on the slope of the curves, the order of influence of the factors within the experimental parameter range is: fracturing fluid viscosity, proppant size, branch fracture width, and pumping rate. This indicates that, under low-viscosity slickwater transport conditions, using smaller proppant sizes is an effective approach to enhance the supported volume of branch fractures.
Fig. 19. Influence factor analysis using average deflection angle as the evaluation metric. |
4. Conclusions
Based on the deflection characteristics of proppant in the main fracture before and after its intersection with a branch fracture during hydraulic fracturing, the main fracture can be divided into five regions: pre-entry transition, pre-entry stabilization, deflection entry at the fracture mouth, rear absorption entry, and movement away from the fracture mouth. Among these, the deflection entry region is the dominant zone where proppant enters the branch fracture.
Smaller proppant particles exhibit stronger suspension capacity, resulting in a greater absolute value of the deflection angle at the branch fracture entrance and, consequently, a higher probability of entering the branch fracture. Increasing the proportion of small proppant and exploring the use of micro-sized proppant are beneficial to enhancing the supporting effectiveness of branch fractures. Both higher pumping rates and wider branch fractures lead to larger absolute values of deflection angle and higher proppant entry velocity component, thereby promoting proppant transport into branch fractures. In contrast, excessive fracturing fluid viscosity reduces fluid diversion into branch fractures and hinders proppant entry.
The relative importance of the influencing factors on proppant entry into branch fractures is ranked as follows: fracturing fluid viscosity, proppant size, branch fracture width, and pumping rate. From an operational perspective, it is recommended that large pumping rates and micro-to-small proppant be employed during the initial stage of fracturing to ensure effective placement in branch fractures, followed by medium-to-large proppant in the later stage to secure adequate support in the main fracture, thereby improving the overall conductivity of the fracture network.
Nomenclature
A—raw data before normalization;
Amin, Amax—minimum and maximum values of raw data before normalization;
Anorm—normalized data;
he—experimental device fracture height, m;
hf—actual fracture height, m;
k1, k2, k3, k4, k5—slope, dimensionless;
N—number of fracture clusters per stage;
Qe—pumping rate in experiments, L/min;
Qf—pumping rate in field operations, m3/min;
v—proppant particle velocity, m/s;
vx, vy, vz—velocity components in three dimensions, m/s;
x, y, z—coordinate system, m.